This is an accepted manuscript of an article published by Elsevier in Journal of Transport Geography on Novembre 19 2015, available
at http://dx.doi.org/10.1016/j.jtrangeo.2015.10.020
This manuscript version is made available under de CC-BY-NC-ND 4.0 license http://creativecommons.org/licenses/by-nc-nd/4.0/
Please cite as:
Carrier, M., Apparicio, P., & Séguin, A.-M. (2016). Road traffic noise in Montreal and
environmental equity: What is the situation for the most vulnerable population groups? Journal of Transport Geography, 51, 1-8. doi:10.1016/j.jtrangeo.2015.10.020
Title: Road traffic noise in Montreal and environmental equity: What is the situation for the most vulnerable population groups?
Journal: Journal of Transport Geography
Word count of abstract: 217 words
Word count of body of text: 6823 words (with the bibliography)
Authors and affiliations
Mathieu Carrier, PhD candidate* - Corresponding author 385 rue Sherbrooke Est, Montréal (Québec), Canada H2X 1E3
[email protected] (514) 499-8249
Philippe Apparicio, PhD
385 rue Sherbrooke Est, Montréal (Québec), H2X 1E3 [email protected]
Anne-Marie Séguin, PhD
385 rue Sherbrooke Est, Montréal (Québec), H2X 1E3 [email protected]
Abstract
Road traffic noise is one of the most detrimental environmental nuisances for the population. Prolonged exposure to high road noise levels can lead to various problems in people’s health and well-being. The objective of this article is to determine whether the groups most vulnerable to road noise, that is, children under 15 years old, people 65 years old and over, and the groups most likely to experience high nuisance levels, visible minorities and low-income individuals, are affected by an environmental inequity related to this nuisance. The method of estimating this nuisance employed in the study is based on a combination of several elements: that is, average traffic flows, road geometries, normal atmospheric conditions, and the characteristics of the urban environment. All of these parameters were considered for the 14 boroughs that make up the central portion of the Island of Montreal. Modelling was used to calculate the maximum daily road noise, based in part on the LimA software predictive model and according to the XPS 31-133 computation method. The results obtained from three different statistical tests and spatial regression analyses show that, on the one hand, the groups chosen on the basis of age are not affected by any environmental inequity. On the other hand, low-income individuals and visible minorities live in city blocks marked by road traffic noise levels that are slightly higher than those experienced by the rest of the population.
1. INTRODUCTION
Noise can be defined as an unwanted sound produced by human activities that has notable effects on sleep, work and communication (Michaud et al., 2008). Road noise is moreover considered by the World Health Organization (WHO) as the second most problematic nuisance for people’s health and well-being, after air pollution (WHO, 2011). The impacts of road noise on affected populations increase according to the noise intensity, measured in decibels (dB(A)). The consequences for health and well-being are minimal at levels under 50 dB(A), and then increase accordingly at each 5 dB(A) threshold. Various European studies indicate that the physiological effects of road noise are more strongly felt starting at the 65 dB(A) threshold: on average, 35% of individuals exposed to such intensities claim to experience negative effects (WHO, 2011). In addition, Canadian transportation agencies recommend keeping daily road noise levels under 65 dB(A). At such a road noise threshold, mitigation measures are often put in place along highways by transportation authorities (MTQ, 2003), such as noise barriers that reduce road traffic noise levels by nearly 10 dB(A) between the source and the first row of buildings (BKSV, 2013).
Prolonged exposure to road noise can have a variety of impacts on people’s health and well-being. Loss of sleep (Bluhm et al., 2004; Öhrström and Skånberg, 2004), high blood pressure (Bluhm et al., 2007), development of cardiovascular disease (Babisch, 2006), increased cognitive difficulties in children (Evans et al., 2001) issues with diabetes (Sorensen et al., 2012), and hearing loss (Moudon, 2009; Seto et al., 2007; van Kempen et al., 2002) are some of the main problems mentioned. High noise levels can also trigger psychological stress and impair local residents’ quality of life (Passchier-Vermeer and Passchier, 2000; Stansfeld et al., 2000). Children and the elderly are among the population groups most likely to develop health issues stemming from prolonged exposure to road noise. Problems with language, reading and concentration have been found in children exposed to high road traffic noise levels (Evans and Maxwell, 1997; Ng, 2000). Children are in fact more vulnerable to the effects of road noise due to the fact that their organs and nervous systems are not fully developed (Bolte et al., 2010). The WHO has also noted that older people are more likely to feel the negative impacts of road noise at levels as low as 45 dB(A) (WHO, 2011). In addition, because of their more limited mobility, these two groups tend to be more restricted to their residential areas (Day, 2010; Greenberg, 1993; Philipps et al., 2005). If there are poor conditions in these areas, these groups are more affected than other age categories that spend less time there.
1.1 Road noise and environmental equity
The literature on environmental equity attempts to determine whether nuisances are distributed inequitably, and whether they therefore impact certain populations more strongly (Walker, 2011). Road noise has only recently been considered a nuisance of interest in the environmental equity literature. Among the studies on place of residence, Brainard et al. (2004) specify that in Birmingham, England, Blacks and low-income households tend to be located in environments where road noise levels are higher in the daytime than is the case for the rest of the population. Lam and Chan (2006) analyzed the relationship between socioeconomic disadvantage and the level of road noise in Hong Kong. They found that the relationship between a low-income level and road noise is positive and significant, but nonetheless weak (Lam and Chan, 2006). Méline et al. (2013) report that road noise tends to be greater in areas with low proportions of university graduates in the French departement of the Île-de-France. Finally, the results of Nega et al. (2013) in Minneapolis point to a positive association between road noise levels and the proportion of individuals from the non-white population (African-Americans, Hispanics and Asians). Mean household income levels are also negatively associated with an increase in road noise, meaning that lower-income households tend to live in areas where the intensity of this nuisance is greater (Nega et al., 2013).
Other studies have however qualified the results obtained relating to potential environmental inequities concerning road noise experienced by low-income households. In the Netherlands, Kruize et al. (2007) only found an environmental inequity for low-income households at night near railway lines. In their respective studies, Havard et al. (2011) and Bocquier et al. (2012) did not measure any environmental inequities for low-income households in Paris and Marseille, France.
Despite their observed physiological vulnerability in terms of the effects of noise on their state of health, people under 15 years old and individuals 65 years old and over have rarely been considered in studies on noise, or in environmental equity studies in general (Cutter, 2006). Paradoxically, we only found two studies, those by Brainard et al. (2004) and Nega et al. (2013), that examined one or the other of these two groups. Moreover, the two studies did not identify any environmental inequities for these groups.
1.2 Research objectives
The analysis of road noise is of particular interest, given that traffic flows have continued to increase on the Island of Montreal’s arterial road network since the 1990s (MTQ, 2013). Although noise barriers have been set up by the Québec Transportation Minister along a few sections of highway, the increase in traffic flows on the arterial and collector networks means that road noise levels remain high along major traffic arteries. The intensity of this nuisance experienced in some locations may thus have negative impacts on the well-being of the people most exposed to this nuisance. The vulnerability of young people and seniors to the effects of noise at their place of residence, as well as the likelihood of visible minorities and low-income individuals living in the areas most polluted by various nuisances, require that attention be accorded to these population groups. The objective of this study is therefore to verify the existence of environmental inequities relating to estimated road traffic noise levels for low-income individuals, visible minorities, people under 15 years old and persons 65 years old and over by using various statistical methods.
2. METHODOLOGY
A number of methodological issues surround the measurement of the existence of environmental inequities for a given population group. Among the important criteria for a rigorous evaluation of environmental equity, Walker (2010) emphasizes the issue of the choice of the scale of analysis. In concrete terms, this spatial division has to be as fine as possible in order to obtain a good degree of variability of the indicator of exposure to the nuisance across the spatial units in the area under study. This issue, the modifiable area unit problem (MAUP), has been raised on several occasions in the environmental equity literature (Bowen, 2002; Maantay et al., 2010; Schweitzer and Valenzuela, 2004) and, more recently, in the field of transportation (Wang et al., 2011). Walker (2010) also considers it appropriate to compare the levels of exposure to the nuisance in the target group with the levels for a control population, in order to establish whether these levels are in fact higher in the target group. Chakraborty (2009) and Mennis and Jordan (2005) have also underscored the importance of controlling for the effect of spatial dependence in the statistical tests used in environmental equity, in order to confirm the independence of the associations.
2.1 Study area, groups targeted, and scale of analysis
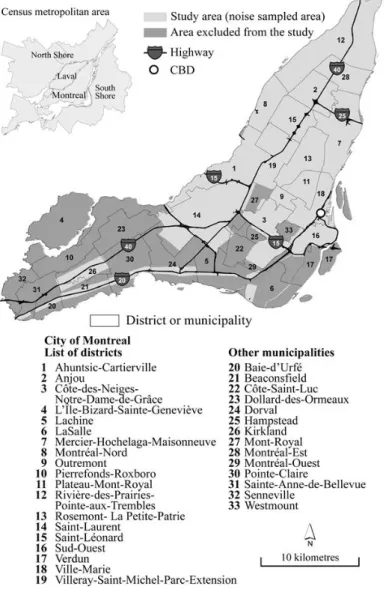
Our study focuses on 14 of the 19 boroughs forming the territory of the Island of Montreal (Canada). Due to the lack of data on traffic flows for collector and arterial roads located in the autonomous municipalities in the western part of the Island of Montreal and for some City of Montreal boroughs that were recently merged with the central city, we were unable to include the entire territory of the island. Our study does however cover an area that, in 2006, included 1.41 million inhabitants out of a total of 1.8 million for the island as a whole. Figure 1 shows the areas covered by the study.
Figure 1. Study area
The study area includes the principal generators of road noise: that is, all the highway sections and the main arterial and collector roads that link the Island of Montreal to its suburbs (Carrier et al., 2014). The central Island of Montreal boroughs also represent a major employment pole for the 3.92 million inhabitants of the Montreal Metropolitan Community, with its 1.1 million
jobs (City of Montreal, 2011). The Island of Montreal’s socioeconomic profile is another element of interest, given the sufficiently large numbers of the four population groups examined in our study (low-income individuals, persons claiming to be members of visible minorities, people under 15 years old, and individuals 65 years old and over). We are thus focusing on two “classic” groups considered in environmental equity studies: that is, low-income individuals and members of visible minorities1 (the reality in Canada making this group a more relevant category than African-Americans or Hispanic populations). We also selected two groups presenting particular vulnerabilities to road noise: that is, the elderly and children. The numbers of these groups and of the total population were taken from the 2006 Statistics Canada census at the level of the dissemination area: that is, the finest spatial division for which socioeconomic data are available. It should be noted that a dissemination area usually includes between 400 and 700 people and is generally made up of several city blocks (Statistics Canada, 2006).
Checking for environmental inequities for a given population group requires that analyses be performed at a fine geographic scale, as road noise levels can vary greatly at the scales of a neighbourhood, a census tract, or a dissemination area. We therefore decided to use the city block as the spatial unit from which both pollution indicators and variables related to the four groups studied are generated. The city block refers to an area equivalent to a block of homes and is delimited by the surrounding road network (Statistics Canada, 2006). It should however be noted that Statistics Canada only provides data on the total population and the number of dwellings at the city block level. To address this issue, we estimated the numbers of each group as follows, as recently proposed by Pham et al. (2012):
𝑡
𝑏= 𝑡
𝑑𝑇
𝑏𝑇
𝑑where 𝑡𝑏 represents the estimated population of the group (low-income individuals, for example) in city block b, td is the group’s population in dissemination area d, and Tb and Td are
the total population in the block and the dissemination area respectively. Descriptive statistics for the estimated populations in each group are shown in Table 1.
Table 1. Univariate statistics for the groups studied at the city block level
Groups Abbr. N Mean S.D. Min Median Max
0-14 years old (%) Pop014Pct 7,456 15.19 5.36 0.00 15.15 40.00 65 and over (%) Pop65Pct 7,456 14.83 8.54 0.00 13.64 95.15 Visible minorities (%) VisMinPct 7,456 22.54 17.46 0.00 18.75 96.60 Low-income population (%) LowIncPct 7,456 27.10 16.19 0.00 25.45 94.42
1 The “visible minorities” variable refers to all non-white individuals, except Aboriginal people: that is, the census
categories of Chinese, South Asian, Filipino, Latin American, Black, Arab, Korean, Japanese, Southeast Asian and West Asian individuals, and persons of Oceanic origin (Statistics Canada, 2006).
2.2 Modelling of road noise and parameters used
The XPS 31-133 calculation method was used to model the level of road noise, with the help of LimA software predictive module 9.3.1. This calculation method has moreover recently been employed in the European Union countries to implement the “environmental noise directive,” in order to identify areas where daily road noise levels exceed the 65 dB(A) threshold, commonly called “black zones” (King et al., 2011; Miedema, 2007; Murphy and King, 2010). The calculations associated with the XPS 31-133 method are based on an estimation of the mean road noise level over a 24-hour period (Lden-24 hours), using the variables of traffic flows, road geometries, land elevation, building height, and atmospheric conditions. This estimation method includes a corrective factor of 5 dB(A) and 10 dB(A) for the periods of evening and night respectively, considering that the effects of road noise are more strongly felt by the population at those times of day (Brainard et al., 2004).
For the purposes of this modelling, all of the parameters were first structured in ArcGIS 10.1 software. Average daily traffic flows (AADT), obtained from the City of Montreal’s sampling for the arterial, collector and local networks, and that of the Québec Transportation Minister for the expressway network, were recalculated for the periods of daytime (6 am to 7 pm), evening (7 pm to 11 pm) and night-time (11 pm to 6 am) for each of the 26,103 road sections in the territory. The categorization of traffic flows was done in this way to harmonize with the selected road noise calculation technique. The heights in metres of each of the buildings in the study area were then included. City of Montreal data on land elevation were also used to determine the height differential between the roadway and the buildings. Finally, noise barriers erected by the Transportation Minister along certain highway sections were also taken into account in the analysis.
For the purposes of the modelling, the average meteorological conditions recorded in Montreal for the summer period were selected: that is, an average temperature of 18 degrees Celsius, a 50% humidity level, an atmospheric pressure of 101.3 kilopascal (kPa), and a 25 km/h wind speed from the southwest. Summer conditions were considered because that is the time of year when people are most likely to be affected by problems with road noise in their residential environments. Once all of the parameters had been included and defined in the modelling software, points were created at a distance of 25 metres between them, and mean noise values were calculated for each. Finally, noise level thresholds ranging from 40 to 95 dB(A) were established in each of the zones making up the study area.
2.3 Statistical analyses
Once the mean road noise levels had been calculated within the boundaries of the city blocks, various tests were performed to measure the statistical association between this nuisance and the four population groups studied. The statistical analyses chosen for this research were inspired by those widely used in environmental equity studies (Briggs et al., 2008; Carrier et al., 2014; Kingham et al., 2007; Pham et al., 2012). The analyses were conducted in SAS software version 9.2. First, the Student’s T-test was used to compare differences in the mean road noise values between city blocks weighted by the numbers of members of the groups studied and the rest of the population. Secondly, Spearman coefficients were calculated between the road traffic noise indicator and the proportions of each of the groups studied at the city block level in order to evaluate the intensity and linearity of the relationship. Thirdly, mean road noise values in the extreme quintiles were compared for each of the groups studied.
Two spatial regression analyses were then performed with the maximum road noise level as the dependent variable. The use of spatial regression is necessary, as several environmental equity studies have recently shown the spatial dependence of classic regression models, whether as regards dependent variables relating to air pollution (Chakraborty, 2009) or those relating to road noise (Bocquier et al., 2012; Havard et al., 2011; Nega et al., 2013). It is therefore necessary to consider the dimension of spatial autocorrelation in statistical models, which has increasingly been done in recent studies on environmental equity (Carrier et al., 2014; Chakraborty, 2009; Mennis and Jordan, 2005; Nega et al., 2013; Pham et al., 2013). As we wanted to control for spatial dependence, we conducted two spatial autoregressive models: that is, the spatial lag and spatial error models (Anselin, 2009). Because Montreal city blocks are mostly regular and have similar sizes and shapes, we used a row-standardized rook contiguity matrix. The choice of either spatial lag or spatial error was based on the values of the Lagrange Multiplier and Robust Lagrange Multiplier (LM and Robust LM) tests calculated using the residuals from the OLS models (Anselin, 2009). The spatial regressions were computed in R by using the spdep library (Bivand, 2013).
3. RESULTS
Before we examine the issue of environmental equity in connection with the maximum road noise level in residential environments, we need to describe the general characteristics of the spatial distribution of this nuisance. The maximum road noise indicator was calculated for 7,456 city blocks located in 14 of the City of Montreal’s 19 boroughs. The univariate statistics
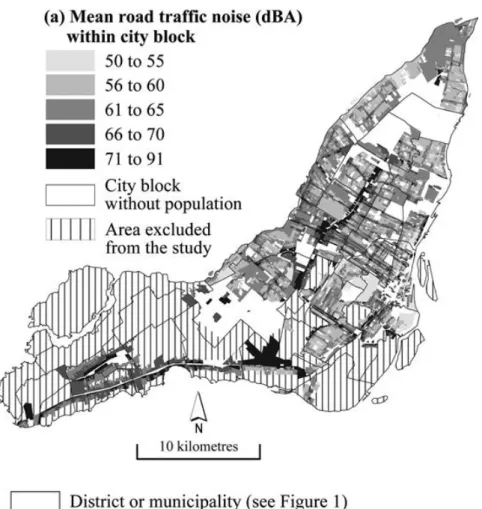
for the spatial distribution of the road traffic noise indicator weighted by the groups studied are shown in Table 2, and this distribution is mapped by decibel threshold in Figure 2.
Table 2. Univariate statistics for the road traffic noise in city block weighted by the total population and the groups studied
Weighting Mean P5 P25 P50 P75 P95 Total population 61.92 55.10 58.41 61.23 64.98 70.96 Pop014Pct 61.83 55.05 58.24 61.00 64.90 71.07 Pop65Pct 61.86 55.05 58.36 61.19 64.86 71.16 VisMinPct 62.34 55.43 58.64 61.54 65.28 71.77 LowIncPct 62.19 55.20 58.60 61.44 65.16 71.21 P5 = 5th percentile; P25 = first quartile; P50 = median; P75 = third quartile; P95 = 95th percentile.
Figure 2 shows that city blocks with the highest road traffic noise levels can be found along the Island of Montreal’s main urban expressways. Next, city blocks located along arterial and collector roads in the central Island of Montreal boroughs are also characterized by noise levels exceeding the 65 dB(A) threshold. Conversely, residential areas characterized by lower levels of road noise are found at the eastern end of the study area, where there are lower urban densities and a network of roads that is less dense as well.
3.1 Determination of environmental inequity
The identification of possible environmental inequities associated with the level of road noise in residential city blocks for the four groups under study is central to our analysis. In order to determine this, we used four types of statistical analyses commonly employed in environmental equity studies.
Comparison of means for the groups and the rest of the population (T-test)
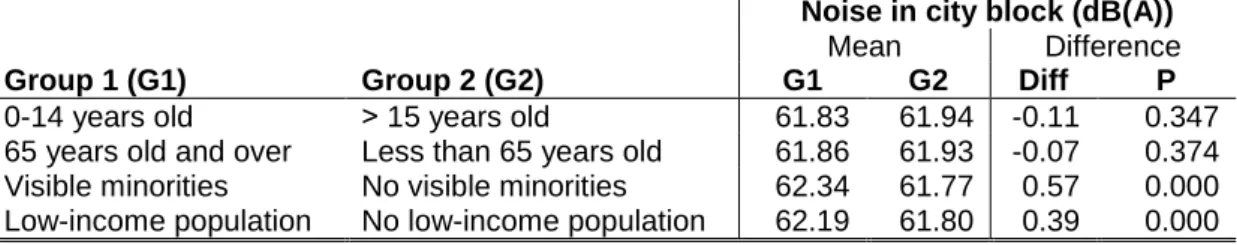
We first performed a T-test to compare the means for the road traffic noise indicator weighted by the numbers of the four groups studied (Table 3). Significant differences were found for visible minorities (62.34 dB(A) versus 61.77 dB(A)) and low-income individuals (62.19 dB(A) versus 61.80 dB(A)), but they remained relatively weak. This indicates a very slight environmental inequity for these two population groups. Conversely, we did not find any significant differences in road noise levels for children under 15 years old and people 65 years old and over.
Correlation between road noise levels and the proportions of the different groups
Spearman coefficients were calculated to check for the presence of significant linear relationships between the proportions of the groups studied and the level of road noise (Table 4). We can immediately note that the correlations are significant and positive, although weak, for two population groups: the percentage of visible minorities (0.110, P<0.0001), and the percentage of low-income individuals (0.109, P<0.0001). Conversely, the situation seems to be better for young people (-0.071, P<0.0001) and seniors (-0.026, P=0.0233).
Table 3. Means of road traffic noise indicator from the T-test for the four groups studied and the rest of the population
Noise in city block (dB(A)) Mean Difference
Group 1 (G1) Group 2 (G2) G1 G2 Diff P
0-14 years old ˃ 15 years old 61.83 61.94 -0.11 0.347 65 years old and over Less than 65 years old 61.86 61.93 -0.07 0.374 Visible minorities No visible minorities 62.34 61.77 0.57 0.000 Low-income population No low-income population 62.19 61.80 0.39 0.000 If the variances of the two groups are unequal (with P<0.05), the Satterthwaite variance estimator is used for the T-test; otherwise, the pooled variance estimator is used.
Correlation between road noise levels and the proportions of the different groups
Spearman coefficients were calculated to check for the presence of significant linear relationships between the proportions of the groups studied and the level of road noise (Table 4). We can immediately note that the correlations are significant and positive, although weak,
for two population groups: the percentage of visible minorities (0.110, P<0.0001), and the percentage of low-income individuals (0.109, P<0.0001). Conversely, the situation seems to be better for young people (-0.071, P<0.0001) and seniors (-0.026, P=0.0233).
Table 4. Spearman coefficients between the road traffic noise indicator and the presence of different groups by city block
Group Noise (dB(A)) P
0-14 years old (%) -0.071 <0.0001 65 years old and over (%) -0.026 0.0233 Visible minorities (%) 0.110 <0.0001 Low-income population (%) 0.109 0.0001 N=7,456.
Comparison of the means for the extreme quintiles (first and last quintiles) of the groups
A third statistical test was performed to analyze the associations between the proportions of the four groups and road noise levels, by focusing on the extreme quintiles (first and last quintiles). The results again show a situation of environmental inequity for low-income individuals and visible minorities. For example, the mean of the maximum road noise in the last quintile of the percentage of low-income individuals is 63.27 dB(A) versus 61.79 dB(A) in the first quintile, that is, a significant difference of 1.48 dB(A) (P=0.000). The situation is similar for visible minorities, for which the mean road noise level is 1.98 dB(A) higher in the last quintile of this group than in the first (63.16 dB(A) versus 61.18 dB(A), with P=0.000). In other words, the areas where these two populations are strongly concentrated are more exposed to road noise. As seen in the preceding statistical analyses, the situation is slightly advantageous for people under 15 years old, for whom the level of road noise is 1.03 dB(A) less in the last quintile than in the first (62.25 dB(A) versus 63.28 dB(A), with P=0.000). So the areas where this population is concentrated seem to be better in terms of noise exposure. Finally, as in the preceding analyses, the situation for older people indicates that there is no environmental inequity, as no significant difference was found between the means (Table 5).
Table 5. Comparison of values for the road traffic noise indicator associated with the minimal and maximal quintiles of the groups studied
Noise in city block (dB(A)) Mean Difference
Quintile 1 Quintile 5 Q1 Q5 Mean P
0-14 years old (%) 0-14 years old (%) 63.28 62.25 1.03 0.000 65 years old and over (%) 65 years old and over (%) 62.56 62.46 0.10 0.613 Visible minorities (%) Visible minorities (%) 61.18 63.16 -1.98 0.000 Low-income pop. (%) Low-income pop. (%) 61.79 63.27 -1.48 0.000 If the variances of the two groups are unequal (with P<0.05), the Satterthwaite variance estimator is used for the T-test; otherwise, the pooled variance estimator is used.
Spatial dependence test
Due to lack of space, we are reporting only the fit diagnostic and the diagnostic for spatial dependence for the conventional model (Table 6). The Moran’s I values calculated among residuals clearly show the spatial dependence of the OLS models. Moreover, the higher values for the Lagrange Multiplier and Robust Lagrange Multiplier tests for lag compared with those for error suggest the relevance of using a spatial error model. It should first be noted that the AIC values show that the spatial error models represent a marked improvement over the OLS models. Globally, the results of the spatial models corroborate those obtained from the bivariate analyses (Table 6).
Two spatial lag error models were therefore developed. The first, in Table 7, introduces independent variables relating to the four population groups in the form of continuous variables (expressed as a percentage of the total population). It shows that, once we have controlled for the other socioeconomic variables, people under 15 years old enjoy an advantageous situation, as the road traffic noise indicator is negative and significant (-0.056, P=0.000). In other words, as the proportion of this group in a city block increases, the road noise level decreases. Similarly, the relationship between the road noise level and the proportion of people 65 years old and over by city block is slightly negative (-0.015, P=0.026). Conversely, the road noise level increases for visible minorities (0.011, P=0.016) by city block, and even more so for low-income individuals (0.015, P=0.000).
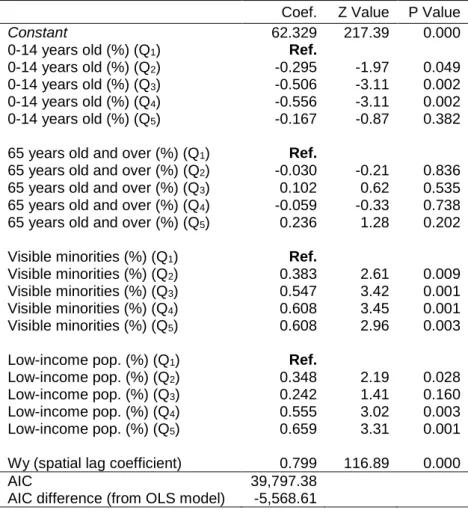
A second model was then constructed, which this time introduced independent variables relating to the four population groups in quintiles (Table 8). It is in fact possible that the relationships between the variables for the groups and the road noise level are not linear. We can therefore identify the quintiles where the road noise levels are significantly different from the first (reference) quintile. We thus find that the more the proportion of people under 15 years old in a city block increases (and this is true up to the fourth quintile), the more the road noise level diminishes. For individuals 65 years old and over, none of the differences in road noise between the first (reference) quintile and the following four are significant. Conversely, the more the proportion of visible minorities in a city block increases, the more the road noise level rises. For example, compared with the first quintile, blocks with high concentrations of visible minorities (Q5) show higher road noise levels of 0.608 dB(A) (P=0.003). For low-income individuals, the road noise level significantly increases in the last two quintiles at the threshold of 0.05. The level is thus 0.659 dB(A) (P<0.001) higher in city blocks showing a high concentration of poverty (Q5) than in less disadvantaged blocks (Q1).
Table 6. Diagnostic of the ordinary least squares regressions of the road traffic noise indicator (dependent variable: Noise in city block)
Model A Model B OLS fit diagnostic
R2 0.027 0.034
Adjusted R2 0.026 0.032
F statistic 51.300 16.580
P-value 0.000 0.000
AIC 45,400.76 45,365.99
Diagnostic for spatial
dependence of the OLS models
Moran’s I (error)a 0.634* 0.629*
LM (lag) 2,607.128* 2,588.461* LM (error) 5,426.443* 5,332.176*
RLM (lag) 20.241* 14.925*
RLM (error) 2,839.556* 2,758.640*
Table 7. Spatial lag error regressions of the road traffic noise indicator Dependent variable Coef. Z Value P Value
Intercept 63.257 200.57 0.000
0-14 years old (%) -0.056 -4.18 0.000
65 years old and over (%) -0.015 -2.22 0.026 Visible minorities (%) 0.011 2.42 0.016
Low-income pop. (%) 0.015 3.67 0.000
Lambda 0.799 116.82 0.000
AIC 39,792.75
AIC difference (from OLS model) -5,608.01
Table 8. Spatial lag regressions of the road traffic noise indicator Coef. Z Value P Value
Constant 62.329 217.39 0.000
0-14 years old (%) (Q1) Ref.
0-14 years old (%) (Q2) -0.295 -1.97 0.049 0-14 years old (%) (Q3) -0.506 -3.11 0.002 0-14 years old (%) (Q4) -0.556 -3.11 0.002 0-14 years old (%) (Q5) -0.167 -0.87 0.382 65 years old and over (%) (Q1) Ref.
65 years old and over (%) (Q2) -0.030 -0.21 0.836 65 years old and over (%) (Q3) 0.102 0.62 0.535 65 years old and over (%) (Q4) -0.059 -0.33 0.738 65 years old and over (%) (Q5) 0.236 1.28 0.202 Visible minorities (%) (Q1) Ref.
Visible minorities (%) (Q2) 0.383 2.61 0.009 Visible minorities (%) (Q3) 0.547 3.42 0.001 Visible minorities (%) (Q4) 0.608 3.45 0.001 Visible minorities (%) (Q5) 0.608 2.96 0.003 Low-income pop. (%) (Q1) Ref.
Low-income pop. (%) (Q2) 0.348 2.19 0.028 Low-income pop. (%) (Q3) 0.242 1.41 0.160 Low-income pop. (%) (Q4) 0.555 3.02 0.003 Low-income pop. (%) (Q5) 0.659 3.31 0.001 Wy (spatial lag coefficient) 0.799 116.89 0.000
AIC 39,797.38
4. DISCUSSION
In light of these results, we can say that visible minorities and low-income individuals tend to live in areas where the maximum road noise level is slightly higher than that experienced by the rest of the population in the study area. Road noise levels are indeed highest in residential areas with large proportions of visible minorities and low-income individuals. These findings are in line with those of other studies on road noise (Brainard et al., 2004; Lam and Chan, 2006; Nega et al., 2013). On the other hand, people under 15 years of age seem to live in areas where road noise levels are lower compared with individuals aged 15 and over, although this difference, which is statistically significant, is nonetheless quite weak. People 65 years old and over are not affected by any environmental inequity related to this nuisance. The lack of environmental inequities experienced by these two groups corroborates the results obtained by Brainard et al. (2004), Nega et al. (2013) and Kolhuber et al. (2006).
4.1 Examination of the results from a social geography perspective
These results are in part explained by the social geography of the study area. First of all, it is hardly surprising that low-income individuals live in the noisiest areas, as they are concentrated in Montreal’s central neighbourhoods (Apparicio and Séguin, 2006). These residential environments are characterized in particular by high residential densities and by the presence of a greater number of expressways. The study by Carrier et al. (2014), moreover, found a significant and positive correlation between the length of major traffic arteries and the proportion of low-income individuals on the Island of Montreal at the city block level. These combined factors lead to higher road noise levels for lower-income populations. The marked presence of these disadvantaged populations on either side of certain urban expressways in the study area (Carrier et al., 2014) and in some neighbourhoods in the central boroughs explains the environmental inequity that we measured.
Another finding was that people 65 years old and over are not affected by any environmental inequity. This is not surprising, as a recent study on the changing spatial distribution of the elderly in Montreal from 1981 to 2006 pointed to a decentralization of this age group (Séguin et al., 2013). Finally, individuals under 15 years old live in urban environments where there are more local streets and fewer major traffic arteries. Since the 1950s, the number of people under 15 years of age has been declining in the central boroughs, whereas their numbers have been growing considerably in the suburbs on the edges of the Island of Montreal
(Apparicio et al., 2010). These suburbs are characterized by low urban density and a road network organized to minimize traffic passing through residential areas.
4.2 Distribution of the groups in noise problem areas
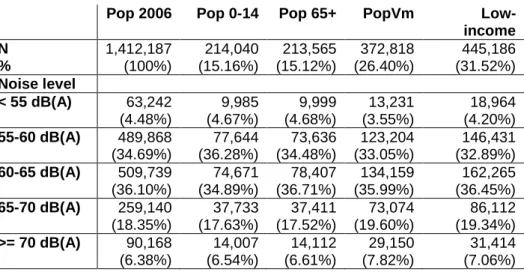
The last table shows the distribution of the groups studied by the maximum road traffic noise level to which these groups are potentially exposed in their residential city block. The proportions were calculated based on the number of individuals distributed in each noise category relative to their total numbers in the study area (Table 9). Some 24.7% of the total population of the Island of Montreal was found to live in a city block where the maximum daily road noise level exceeds the 65 dB(A) threshold considered to be harmful to human health (Gidlöf-Gunnarsson and Öhrström, 2007; Miedema, 2007) and the mean value at which the Québec Transportation Minister provides for the setting up of mitigation measures in these so-called sensitive zones (MTQ, 2003). Low-income individuals and visible minorities are overrepresented in areas where the noise level is over 65 dB(A), with percentages of 26.40% and 27.42% respectively, compared with 24.7% for the total population. People under 15 years old and individuals 65 years old and over are less likely to live in these problem areas (24.17% and 24.13%).
Table 9. Population distribution by population numbers and percentages according to the level of road traffic noise in the city block
Pop 2006 Pop 0-14 Pop 65+ PopVm Low-income N 1,412,187 214,040 213,565 372,818 445,186 % (100%) (15.16%) (15.12%) (26.40%) (31.52%) Noise level < 55 dB(A) 63,242 (4.48%) 9,985 (4.67%) 9,999 (4.68%) 13,231 (3.55%) 18,964 (4.20%) 55-60 dB(A) 489,868 (34.69%) 77,644 (36.28%) 73,636 (34.48%) 123,204 (33.05%) 146,431 (32.89%) 60-65 dB(A) 509,739 (36.10%) 74,671 (34.89%) 78,407 (36.71%) 134,159 (35.99%) 162,265 (36.45%) 65-70 dB(A) 259,140 (18.35%) 37,733 (17.63%) 37,411 (17.52%) 73,074 (19.60%) 86,112 (19.34%) >= 70 dB(A) 90,168 (6.38%) 14,007 (6.54%) 14,112 (6.61%) 29,150 (7.82%) 31,414 (7.06%)
4.3 Influence of the study area in the assessment of environmental equity
The direction taken by the statistical associations calculated between the population groups and the maximum road noise levels was the one that we expected to find. On the other hand,
the strength of the coefficients is relatively weak compared with the strengths obtained for road transportation-related air pollutants for the same groups as measured by Crouse et al. (2009) and Carrier et al. (2014) for the entire Island of Montreal. This is explained by the fact that the area that was the focus of our study is missing certain areas that were included in the other two studies. The spatial data that were needed to model road traffic noise were not available (especially traffic flows) for 2,916 city blocks located in some autonomous municipalities and certain boroughs in the west and northeast of the island. These areas however show higher proportions of people under 15 years old (17.7% versus 15.19% for our study area) and lower proportions of low-income individuals (14.97% versus 27.10%). Traffic flows in these suburban areas are also lower compared with those in our study area. Consequently, if we had been able to include these areas in our analysis, we would probably have found higher positive regression coefficients for low-income individuals and visible minorities, and higher negative coefficients for children under 15 years old. In other words, it is very probable that we would have concluded that there were greater inequities for low-income individuals and visible minorities and a more advantageous situation for people under 15 years of age.
5. RESEARCH LIMITATIONS
There are some inherent limitations to modelling noise. Our study measures noise in the outside environment. There is in fact a 15 dB(A) difference between the level of outside noise and the noise perceived inside a building (BKSV, 2013). To measure the latter, we would have had to analyze the influence that the orientation of the building facade, the layout of the rooms, and the materials making up the building structure had on the level of noise experienced by the occupants (Lam and Chan, 2006).
The modelling of road noise gave us the approximate level of this nuisance for an average summer day in a given location: that is, its concentration (Janssen and Mehta, 2006). The notion of the concentration of a nuisance in the environment differs from that of an individual’s exposure to this nuisance. To measure exposure, it is important to consider the period of time that an individual spends in a given environment and the quantity of pollutants to which the person is exposed (Janssen and Mehta, 2006). So, to measure an individual’s real exposure to pollutants at the place of residence, we would have to determine the time spent (amount of time and time of day, given the variations in traffic throughout the day) by the person in that location (Kingham and Dorset, 2011; Maantay et al., 2010).
6. CONCLUSION
The results of this study corroborate those of a number of other environmental equity studies: low-income individuals and visible minorities tend to live in the noisiest areas. We should however add that the differences are nonetheless relatively modest.
In terms of the management of urban nuisances, the road noise map could be used to target city blocks where the level of this nuisance surpasses the tolerance threshold set by the authorities. The Québec Transportation Minister’s noise policy states that daily road traffic noise levels should not exceed 65 dB(A) within the territory of Montreal (MTQ, 2003). Our analysis showed that about 25% of the total population in the study area lives in city blocks where the mean road noise level is above this tolerance threshold. Land-use planning policies currently in effect allow municipalities to better protect areas around major traffic arteries affected by road noise levels above the tolerance threshold. The Montreal Metropolitan Community, through its development plan, could require the municipalities within its territory to prohibit certain so-called sensitive land uses and to put stricter urban planning standards in place near major traffic arteries for the reasons of citizens’ public health and well-being. Finally, to determine people’s exposure to noise, it would be interesting in a future study to use dynamic noise level monitoring methods to monitor the movements of a sample of individuals from each of the four groups over the period of a week, for example, and to measure the noise levels to which they are exposed. In other words, over a given period, it would then be possible to evaluate the amount of time during which these individuals are exposed to noise levels above 65 dB(A).
The continuous evaluation of road noise is an emerging research area for which increasingly sophisticated measurement techniques are being developed (Barrigón Morillas and Prieto Gajardo, 2014; Can et al., 2011; Rey Gozalo et al., 2014). The use of these techniques would enable us to produce an even more accurate picture of the current situation.
7. REFERENCES
Anselin, L., 2009. Spatial regression, In: Rogerson, I.A.S.F.P.A. (Ed.), The Sage Handbook of Spatial Analysis. Sage, London.
Apparicio, P., Cloutier, M., Séguin, A., Ades, J., 2010. Accessibilité spatiale aux parcs urbains pour les enfants et injustice environnementale. Exploration du cas montréalais. Revue internationale de géomatique 20, 363-389.
Apparicio, P., Séguin, A.-M., 2006. Measuring the accessibility of services and facilities for residents of public housing in Montreal. Urban Studies 43, 187-211.
Babisch, W., 2006. Transportation noise and cardiovascular risk: updated review and synthesis of epidemiological studies indicate that the evidence has increased. Noise and Health 8, 1.
Barrigón Morillas, J., Prieto Gajardo, C., 2014. Uncertainty evaluation of continuous noise sampling. Applied Acoustics 75, 27-36.
Bivand, R., 2013. Spdep: Spatial Dependence: Weighting Schemes, Statistics and Models.R Package Ver.0.5-56. .
BKSV, 2013. Environmental & Urban Noise, In: Vibration, B.K.S. (Ed.), p. 67.
Bluhm, G., Berglind, N., Nordling, E., Rosenlund, M., 2007. Road traffic noise and hypertension. Occupational and environmental medicine 64, 122-126.
Bluhm, G., Nordling, E., Berglind, N., 2004. Road traffic noise and annoyance-An increasing environmental health problem. Noise and Health 6, 43.
Bocquier, A., Cortaredona, S., Boutin, C., David, A., Bigot, A., Chaix, B., Gaudart, J., Verger, P., 2012. Small-area analysis of social inequalities in residential exposure to road traffic noise in Marseilles, France. The European Journal of Public Health, cks059.
Bolte, G., Tamburlini, G., Kohlhuber, M., 2010. Environmental inequalities among children in Europe—evaluation of scientific evidence and policy implications. The European Journal of Public Health 20, 14-20.
Bowen, W.M., 2002. An analytical review of environmental justice research: what do we really know? Environmental management 29, 3-15.
Brainard, J.S., Jones, A.P., Bateman, I.J., Lovett, A.A., 2004. Exposure to environmental urban noise pollution in Birmingham, UK. Urban Studies 41, 2581-2600.
Briggs, D., Abellan, J.J., Fecht, D., 2008. Environmental inequity in England: small area associations between socio-economic status and environmental pollution. Social science & medicine 67, 1612-1629.
Can, A., Van Renterghem, T., Rademaker, M., Dauwe, S., Thomas, P., De Baets, B., Botteldooren, D., 2011. Sampling approaches to predict urban street noise levels using fixed and temporary microphones. Journal of Environmental Monitoring 13, 2710-2719.
Carrier, M., Apparicio, P., Séguin, A.-M., Crouse, D., 2014. The application of three methods to measure the statistical association between different social groups and the concentration
of air pollutants in Montreal: A case of environmental equity. Transportation Research Part D: Transport and Environment 30, 38-52.
Chakraborty, J., 2009. Automobiles, air toxics, and adverse health risks: Environmental inequities in Tampa Bay, Florida. Annals of the Association of American Geographers 99, 674-697.
City of Montreal, 2011. L'évolution de l'emploi à Montréal 1981-2006.
Crouse, D.L., Ross, N.A., Goldberg, M.S., 2009. Double burden of deprivation and high concentrations of ambient air pollution at the neighbourhood scale in Montreal, Canada. Social science & medicine 69, 971-981.
Cutter, S.L., 2006. Issue in environmental justice research, In: Earthscan (Ed.), Hazards, Vulnerability and Environmental Justice, pp. 263-270.
Day, R., 2010. Environmental justice and older age: consideration of a qualitative neighbourhood-based study. Environment and planning. A 42, 2658.
Evans, G.W., Lercher, P., Meis, M., Ising, H., Kofler, W.W., 2001. Community noise exposure and stress in children. The Journal of the Acoustical Society of America 109, 1023-1027. Evans, G.W., Maxwell, L., 1997. Chronic Noise Exposure and Reading Deficits The Mediating Effects of Language Acquisition. Environment and Behavior 29, 638-656.
Gidlöf-Gunnarsson, A., Öhrström, E., 2007. Noise and well-being in urban residential environments: The potential role of perceived availability to nearby green areas. Landscape and Urban Planning 83, 115-126.
Greenberg, M., 1993. Proving environmental inequity in siting locally unwanted land uses. Risk 4, 235.
Havard, S., Reich, B.J., Bean, K., Chaix, B., 2011. Social inequalities in residential exposure to road traffic noise: an environmental justice analysis based on the RECORD Cohort Study. Occupational and environmental medicine 68, 366-374.
Janssen, N.A., Mehta, S., 2006. Human exposure to air pollution, Quality guidelines: global update 2005. World Health Organization (WHO), Copenhague, Danemark.
King, E.A., Murphy, E., Rice, H.J., 2011. Implementation of the EU environmental noise directive: lessons from the first phase of strategic noise mapping and action planning in Ireland. Journal of environmental management 92, 756-764.
Kingham, S., Dorset, W., 2011. Assessment of exposure approaches in air pollution and health research in Australia and New Zealand. Air quality and climate change 45, 28-38.
Kingham, S., Pearce, J., Zawar-Reza, P., 2007. Driven to injustice? Environmental justice and vehicle pollution in Christchurch, New Zealand. Transportation Research Part D: Transport and Environment 12, 254-263.
Kohlhuber, M., Mielck, A., Weiland, S.K., Bolte, G., 2006. Social inequality in perceived environmental exposures in relation to housing conditions in Germany. Environmental research 101, 246-255.
Kruize, H., Driessen, P.P., Glasbergen, P., van Egmond, K.N., 2007. Environmental equity and the role of public policy: experiences in the Rijnmond region. Environmental management 40, 578-595.
Lam, K.-c., Chan, P.-K., 2006. Socio-economic status and inequalities in exposure to transportation noise in Hong Kong. Transportation, 107-113.
Maantay, J., Chakraborty, J., Brender, J., 2010. Proximity to environmental hazards: environmental justice and adverse health outcomes. US Environmental Protection Agency, trans. Washington, DC: Strengthening Environmental Justice and Decision Making.
Méline, J., Van Hulst, A., Thomas, F., Karusisi, N., Chaix, B., 2013. Transportation noise and annoyance related to road traffic in the French RECORD study. International journal of health geographics 12, 44.
Mennis, J.L., Jordan, L., 2005. The distribution of environmental equity: Exploring spatial nonstationarity in multivariate models of air toxic releases. Annals of the Association of American Geographers 95, 249-268.
Michaud, D.S., Keith, S.E., McMurchy, D., 2008. Annoyance and disturbance of daily activities from road traffic noise in Canada. The Journal of the Acoustical Society of America 123, 784-792.
Miedema, H.M., 2007. Annoyance Caused by Environmental Noise: Elements for Evidence‐ Based Noise Policies. Journal of social issues 63, 41-57.
Moudon, A.V., 2009. Real noise from the urban environment: how ambient community noise affects health and what can be done about it. American journal of preventive medicine 37, 167-171.
MTQ, 2003. Politique sur le bruit routier. Gouvernement du Québec, p. 17
MTQ, 2013. Atlas des débits de circulation des années 1990 à 2012, In: Québec, M.d.T.d. (Ed.), Québec.
Murphy, E., King, E.A., 2010. Strategic environmental noise mapping: Methodological issues concerning the implementation of the EU Environmental Noise Directive and their policy implications. Environment international 36, 290-298.
Nega, T.H., Chihara, L., Smith, K., Jayaraman, M., 2013. Traffic Noise and Inequality in the Twin Cities, Minnesota. Human and Ecological Risk Assessment: An International Journal 19, 601-619.
Ng, C.F., 2000. Effects of building construction noise on residents: A quasi-experiment. Journal of environmental psychology 20, 375-385.
Öhrström, E., Skånberg, A., 2004. Sleep disturbances from road traffic and ventilation noise— laboratory and field experiments. Journal of Sound and Vibration 271, 279-296.
Passchier-Vermeer, W., Passchier, W.F., 2000. Noise exposure and public health. Environmental health perspectives 108, 123.
Pham, T.-T.-H., Apparicio, P., Landry, S., Séguin, A.-M., Gagnon, M., 2013. Predictors of the distribution of street and backyard vegetation in Montreal, Canada. Urban Forestry & Urban Greening 12, 18-27.
Pham, T.-T.-H., Apparicio, P., Séguin, A.-M., Landry, S., Gagnon, M., 2012. Spatial distribution of vegetation in Montreal: An uneven distribution or environmental inequity? Landscape and Urban Planning 107, 214-224.
Philipps, D., Siu, O.-L., Yeh, A., Cheng, K., 2005. Ageing and the urban environment, In: Routledge (Ed.), Ageing and Place: Perspectives, policy, practice, pp. 147-163.
Rey Gozalo, G., Barrigón Morillas, J.M., Gómez Escobar, V., 2014. Analyzing nocturnal noise stratification. Science of The Total Environment 479, 39-47.
Schweitzer, L., Valenzuela, A., 2004. Environmental injustice and transportation: the claims and the evidence. Journal of Planning Literature 18, 383-398.
Séguin, A.-M., Apparicio, P., Negron, P., 2013. La répartition de la population âgée dans huit métropoles canadiennes de 1981 à 2006: un groupe de moins en moins ségrégué. Cybergeo: European Journal of Geography.
Seto, E.Y.W., Holt, A., Rivard, T., Bhatia, R., 2007. International Journal of Health Geographics. International journal of health geographics 6, 24.
Sorensen, M., Andersen, Z.J., Nordsborg, R.B., Becker, T., Tjonneland, A., Overvad, K., Raaschou-Nielsen, O., 2012. Long-term exposure to road traffic noise and incident diabetes: a cohort study. Environmental health perspectives 121, 217-222.
Stansfeld, S., Haines, M., Brown, B., 2000. Noise and health in the urban environment. Reviews on environmental health 15, 43-82.
Statistics Canada, 2006. Recensement de la population 2006.
van Kempen, E., Kruize, H., Boshuizen, H., 2002. The association between noise exposure and blood pressure and ischemic heart disease: a meta-analysis. Environ Health Perspect 110, 307-317.
Walker, G., 2010. Environmental justice, impact assessment and the politics of knowledge: The implications of assessing the social distribution of environmental outcomes. Environmental impact assessment review 30, 312-318.
Walker, G., 2011. Environmental justice: concepts, evidence and politics, In: Routledge (Ed.), New York, p. 249.
Wang, C., Quddus, S., Ryley, T., Enoch, M., Davison, L., 2011. Spatial models in transport: 743 a review and assessment of methodological issues, Transportation 744 Research Board 91st Annual Meeting, Washington, DC.
WHO, 2011. Burden of disease from environmental noise- Quantification of healthy life years lost in Europe, In: Health, T.W.E.C.f.E.a. (Ed.), Bonn, Allemagne p. 129 p.