Journal of Fundamental and Applied Sciences is licensed under aCreative Commons Attribution-NonCommercial 4.0 International License. Libraries Resource Directory. We are listed under Research Associations category.
FATTY ACID COMPOSITION OF ALGERIAN PROPOLIS
A. Rebiai*1, M. L. Belfar2, M. A. Mesbahi2, S. Nani1, A.Tliba1, D.Ghamem Amara3, A. Chouikh3
1
VTRS Laboratory, University of El Oued, P.O. Box 789, 39000, El Oued, Algeria
2
VPRS Laboratory, University of Ouargla, P.O. Box 511, 30000, Ouargla, Algeria
3
Department of Biology, Faculty of Nature and Life Sciences, University of El Oued, P.O. Box 789, 39000, El-Oued, Algeria
Received: 28 Jully 2017 / Accepted: 29 August 2017 / Published online: 01 Sebtember 2017
ABSTRACT
The fatty acid composition of eight honey bee (Apis mellifera) propolis load samples acquired in Algeria, were determined. The fatty acids presented a variable composition among these samples. All samples contained oleic, linoleic, stearic, eicosenoic, palmitoleic and palmitic acid. Only two samples did not contain arachidonic acid. Also results indicated palmitic, palmitoleic, linoleic, arachidonic and eicosenoic acid, respectively, accounted for 0.05% to 3.71%, 0.14% to 14.58%, 1.3% to 12.1%, 0.19% to 18.83%, and 0.23% to 12.86%; of the total lipids.The unsaturated fatty acid level varied from 19.72% to 51.85% of the total fatty acid composition, suggesting that propolis is a good source of unsaturated fatty acids to the diet. These data might help the regulatory agencies establish quality parameters for propolis produced in Algeria. There are no additional data available on Algerian propolis fatty acid composition.
Keywords: propolis, fatty acid composition, unsaturated fatty acid, oleic, linoleic.
Author Correspondence, e-mail: [email protected] doi: http://dx.doi.org/10.4314/jfas.v9i3.26
ISSN 1112-9867
1. INTRODUCTION
Propolis, a complex mixture of several resinous materials, it's often called "bee glue", is a natural resinous product that honeybees collect from trees and several plants and mix it with β-glucosidase (salivary enzymes) and beeswax [1]. Propolis is a lipophilic material that is hard and easily broken when cold but soft, elastic, and very viscous when warm; it possesses an enjoyable aromatic smell and different coloration, including red, brown, and green, among others [2]. In terms of chemical composition, it is generally constituted of 50% resin, 30% wax, 10% essential oils, 5% pollen, and 5% other substances which include minerals and organic compounds like phenolic acids (caffeic and chlorogenic acid) or their esters, flavonoids (flavones, flavanones, flavonols, and dihydroflavonols chalcones), aromatic aldehydes, terpenes and alcohols, fatty acids, stilbenes, steroids and stilbenes [3, 4]. In the following years, analysis of a large number of samples from different geographic origins revealed that chemical composition of propolis is highly variable because it depends on factors such as the vegetation, season, and environmental conditions of the site of collection. Marcucci and Bankova [3, 4] registered more than 300 substances in propolis and recent reports showed the presence of compounds never mentioned before [5, 6].
Propolis fatty acids have been investigated previously in Bulgaria [7], Oxford (UK) [8], Turkey [9], Omani [10] and Cameroon [11]. There are no studies related to the fatty acid composition of propolis samples collected in Algeria. The present study aims to provide new information about fatty acid composition of propolis collected by bees in Algeria.
2. MATERIALS AND METHODS 2.1. Chemicals
Fatty acids (FA) standards (Supelco® 37 Component FAME Mix) were all purchased as methyl esters from Sigma-Aldrich (St Louis, MO, USA). These quantitative commercial preparations (Table 1) of fatty acid methyl ester (FAME) included homologous series of normal straight-chain saturated, monounsaturated, and polyunsaturated FA, from 4 to 24 carbon atoms in length. Potassium hydroxide (KOH), sodium chloride (NaCl) and sodium sulphate (Na2SO4) were purchased from Sigma-Aldrich (St Louis, MO, USA). Methanol
reagents used were of analytical grade. Nitrogen (N2), helium (He), hydrogen (H2) and
compressed air for operation of the analytical instruments were obtained from National Industrial Gas Company, Algeria (Ouargla).
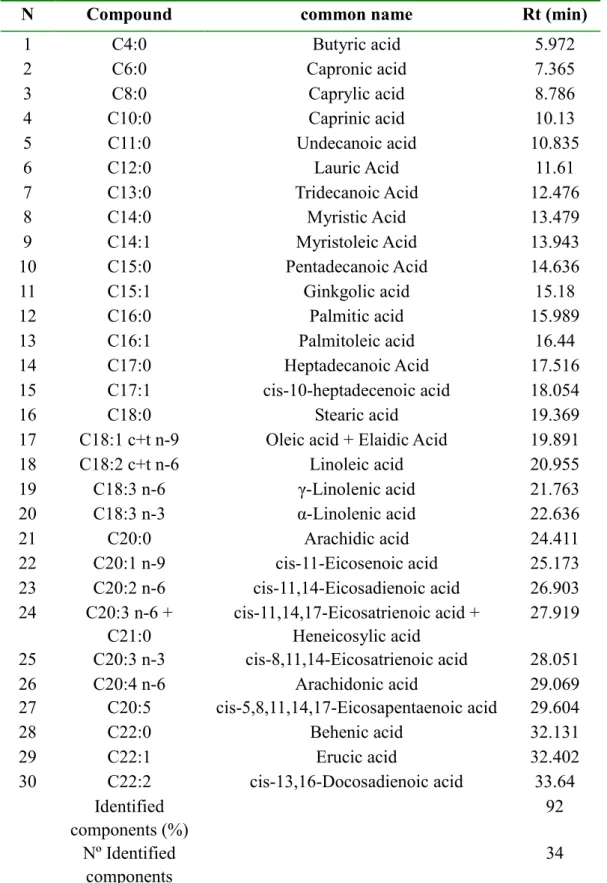
Table 1. Fatty Acid Methyl Ester Mix
N Compound common name Rt (min)
1 C4:0 Butyric acid 5.972 2 C6:0 Capronic acid 7.365 3 C8:0 Caprylic acid 8.786 4 C10:0 Caprinic acid 10.13 5 C11:0 Undecanoic acid 10.835 6 C12:0 Lauric Acid 11.61 7 C13:0 Tridecanoic Acid 12.476 8 C14:0 Myristic Acid 13.479 9 C14:1 Myristoleic Acid 13.943 10 C15:0 Pentadecanoic Acid 14.636 11 C15:1 Ginkgolic acid 15.18 12 C16:0 Palmitic acid 15.989 13 C16:1 Palmitoleic acid 16.44 14 C17:0 Heptadecanoic Acid 17.516 15 C17:1 cis-10-heptadecenoic acid 18.054 16 C18:0 Stearic acid 19.369
17 C18:1 c+t n-9 Oleic acid + Elaidic Acid 19.891
18 C18:2 c+t n-6 Linoleic acid 20.955 19 C18:3 n-6 γ-Linolenic acid 21.763 20 C18:3 n-3 α-Linolenic acid 22.636 21 C20:0 Arachidic acid 24.411 22 C20:1 n-9 cis-11-Eicosenoic acid 25.173 23 C20:2 n-6 cis-11,14-Eicosadienoic acid 26.903 24 C20:3 n-6 + C21:0 cis-11,14,17-Eicosatrienoic acid + Heneicosylic acid 27.919 25 C20:3 n-3 cis-8,11,14-Eicosatrienoic acid 28.051 26 C20:4 n-6 Arachidonic acid 29.069 27 C20:5 cis-5,8,11,14,17-Eicosapentaenoic acid 29.604 28 C22:0 Behenic acid 32.131 29 C22:1 Erucic acid 32.402 30 C22:2 cis-13,16-Docosadienoic acid 33.64 Identified components (%) 92 Nº Identified components 34
2.2. Instruments
Chromatographic analysis was performed using a Shimadzu GC-2014 gas chromatograph with a flame ionization detector (FID), with a LabSolutions, Shimadzu GC Solution, Chromatography Data System, software version 2.3, equipped with a split/splitless injector. The capillary column was a DB-Wax of dimensions 30 m × 0.32 mm i.d. ×0.25 µm df (polyethylene glycol, Agilent). The column temperature was held at 50 ºC (1 min) and then increased at a rate of 25 ºC.min-1 up to 200 ºC and then increased at a rate of 3 ºC.min-1 up to 230 ºC and held for 18 min. The linear velocity of carrier gas (nitrogen) was constant at 12 cm/s. The temperature of the injector was 250 ºC, and the detector was 280°C, applying the split mode (split ratio was fixed at 1:50) [12].
2.3. Propolis origin
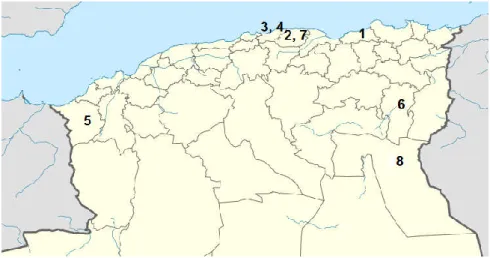
Propolis samples were collected from six different regions of Algeria as shown in Figure 1. The samples from Jijel (1), Tizi Ouzou (2, 7), Boumerdès (3, 4), and Tlemcen (5) Khenchela (6) and El Oued (8). Hand-collected propolis samples were kept desiccated in the dark up to their processing.
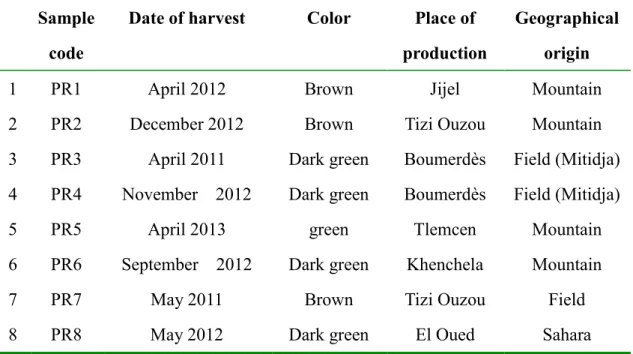
Table 2. Algerian propolis samples used in this study on the basis of date of harvest, geographical origin.
Sample code
Date of harvest Color Place of
production
Geographical origin
1 PR1 April 2012 Brown Jijel Mountain
2 PR2 December 2012 Brown Tizi Ouzou Mountain
3 PR3 April 2011 Dark green Boumerdès Field (Mitidja)
4 PR4 November 2012 Dark green Boumerdès Field (Mitidja)
5 PR5 April 2013 green Tlemcen Mountain
6 PR6 September 2012 Dark green Khenchela Mountain
7 PR7 May 2011 Brown Tizi Ouzou Field
8 PR8 May 2012 Dark green El Oued Sahara
2.4. Lipid extraction
A known weight (approximately 5 g) of propolis, was extracted with 150 mL of hexane for 3h in a Soxhlet apparatus [13]. Hexane extracts containing lipids were subjected to vacuum distillation at approximately 40◦C using a Rotovap to remove hexane. Extracted lipids were stored at –10◦C under nitrogen until further analysis. Lipid samples were analyzed in duplicate for saturated and unsaturated fatty acid composition. Total fat content and fatty acid analysis were carried out in bulked harvest samples.
2.5. Total fat content
Total fat content was determined in accordance with [13] method 7.061.
% Fat on dry weight basis=(g of fat in sample/g of dried sample)×100 [14] 2.6. Fatty acid methyl ester preparation
0.5g of lipid extracts were converted into fatty acid methyl esters. Methyl esters were synthesized using potassium hydroxide (KOH) as catalyst and methanol at 75 °C. After 1 h, the stirring was stopped and the reaction product was separated into two phases by simple decantation. FAME (upper phase) was further purified by washing several times with water. Then, FAME was dissolved in hexane, kept standing over magnesium sulfate, filtered and the
volatiles removed under reduced pressure. The transesterification reaction utilized a total molar ratio of methanol: oil: KOH of 10:0.5:0.02.
2.7. Analysis of fatty acid methyl esters
Fatty acids were identified by comparing the relative retention times of the samples' FAME peaks with fatty acids methyl esters standards. The samples were spiked with the standard. The peak areas were determined with Star software (GCSolution). The data were expressed as percentages of the normalized area of fatty acids.
2.8. Description of data and variables
The fatty acid composition was identified and quantified in area percentage, being SFA (sum of mean peak area percentages of saturated fatty acids), UFA (sum of mean peak area percentages of unsaturated fatty acids), MUFA (sum of mean peak area percentages of monounsaturated fatty acids), PUFA (sum of mean peak area percentages of polyunsaturated fatty acids), SFA:UFA ratio, MUFA:PUFA ratio, and Hypo:Hyper ratio, hypocholesterolemic fatty acids (MUFA + PUFA) to hypercholesterolemic fatty acids (C14:0 + C16:0) [15]. 2.9. Clustering Analysis.
Compounds identified by GC/FID of all eight propolis samples were analyzed using the neighbor-joining method and the software PAST v.2.17.
3. RESULTS AND DISCUSSION 3.1. Gravimetric extraction yield
The yields of dry propolis extracts in the studied propolis samples were found to be; 71.16% for Tizi Ouzou (PR7), 65.3% for Tlemcen (PR5) and El Oued (PR8), 55.2% for Jijel (PR1), 41.16% for Boumerdès (PR3), 37.74% for Tizi Ouzou (PR2), 25.75% for Boumerdès (PR4), 16.19% (w/w) for Khenchela (PR6) using hexane as solvent (Figure 2). The best yield of soluble content was found the propolis collected from Tizi Ouzou region. Different propolis samples collected from different areas showed different solubility in hexane even if the same amount of propolis samples were tried to be dissolved in the same volume of hexane.
Fig 2. Comparison of lipid recovery by Soxhlet extraction utilizing hexane
3.2. Fatty acid profile
The GC-FID techniques have been proven to be suitable for chemical profiling of food and natural products like propolis. Even though these techniques provide a sufficient profile and identification of the compounds analyzed, the propolis has to be derivatized in order to increase the concentration of volatile compounds for detection. However, not all compounds comprising propolis are able to be derivatized or become volatile after derivatization. Fatty acids are one of the groups that are derivatized to convert to fatty acid methyl esters.
The GC-FID analysis of the fatty acid methyl esters of the lipid extracts led to the identification of over 34 compounds belonging to various groups of fatty acid such as Saturated Fatty Acids; Monounsaturated Fatty Acids; Polyunsaturated Fatty Acids; Omega-3and Omega-6. The most abundant compounds in the hexane extracts are Polyunsaturated Fatty Acids, Monounsaturated Fatty Acids, and Omega-6, respectively. The major compounds present in the different propolis lipid extracts identified by GC-FID analysis are listed in Table 3 respectively. Their percentages are given in the tables and refer to percent of the total area.
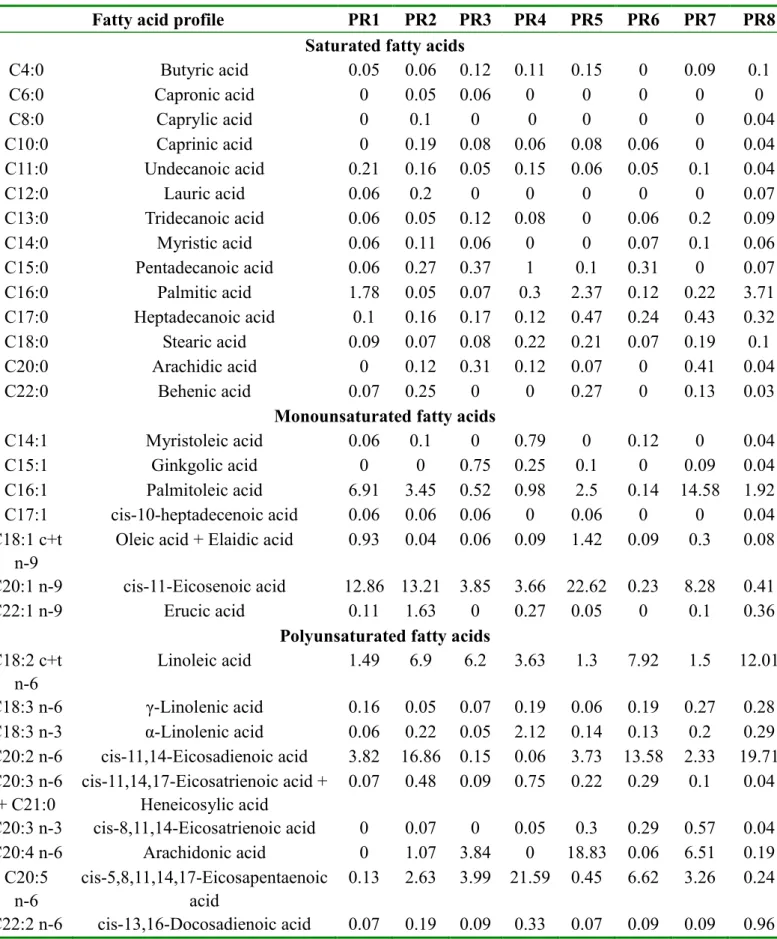
Table 3. Comparison of normalized fatty acids (FA) composition between different propolis lipid extracts determined from FAME analysis by GC-FID
Fatty acid profile PR1 PR2 PR3 PR4 PR5 PR6 PR7 PR8
Saturated fatty acids
C4:0 Butyric acid 0.05 0.06 0.12 0.11 0.15 0 0.09 0.1 C6:0 Capronic acid 0 0.05 0.06 0 0 0 0 0 C8:0 Caprylic acid 0 0.1 0 0 0 0 0 0.04 C10:0 Caprinic acid 0 0.19 0.08 0.06 0.08 0.06 0 0.04 C11:0 Undecanoic acid 0.21 0.16 0.05 0.15 0.06 0.05 0.1 0.04 C12:0 Lauric acid 0.06 0.2 0 0 0 0 0 0.07 C13:0 Tridecanoic acid 0.06 0.05 0.12 0.08 0 0.06 0.2 0.09 C14:0 Myristic acid 0.06 0.11 0.06 0 0 0.07 0.1 0.06 C15:0 Pentadecanoic acid 0.06 0.27 0.37 1 0.1 0.31 0 0.07 C16:0 Palmitic acid 1.78 0.05 0.07 0.3 2.37 0.12 0.22 3.71 C17:0 Heptadecanoic acid 0.1 0.16 0.17 0.12 0.47 0.24 0.43 0.32 C18:0 Stearic acid 0.09 0.07 0.08 0.22 0.21 0.07 0.19 0.1 C20:0 Arachidic acid 0 0.12 0.31 0.12 0.07 0 0.41 0.04 C22:0 Behenic acid 0.07 0.25 0 0 0.27 0 0.13 0.03
Monounsaturated fatty acids
C14:1 Myristoleic acid 0.06 0.1 0 0.79 0 0.12 0 0.04 C15:1 Ginkgolic acid 0 0 0.75 0.25 0.1 0 0.09 0.04 C16:1 Palmitoleic acid 6.91 3.45 0.52 0.98 2.5 0.14 14.58 1.92 C17:1 cis-10-heptadecenoic acid 0.06 0.06 0.06 0 0.06 0 0 0.04 C18:1 c+t n-9
Oleic acid + Elaidic acid 0.93 0.04 0.06 0.09 1.42 0.09 0.3 0.08
C20:1 n-9 cis-11-Eicosenoic acid 12.86 13.21 3.85 3.66 22.62 0.23 8.28 0.41
C22:1 n-9 Erucic acid 0.11 1.63 0 0.27 0.05 0 0.1 0.36
Polyunsaturated fatty acids C18:2 c+t n-6 Linoleic acid 1.49 6.9 6.2 3.63 1.3 7.92 1.5 12.01 C18:3 n-6 γ-Linolenic acid 0.16 0.05 0.07 0.19 0.06 0.19 0.27 0.28 C18:3 n-3 α-Linolenic acid 0.06 0.22 0.05 2.12 0.14 0.13 0.2 0.29 C20:2 n-6 cis-11,14-Eicosadienoic acid 3.82 16.86 0.15 0.06 3.73 13.58 2.33 19.71 C20:3 n-6 + C21:0 cis-11,14,17-Eicosatrienoic acid + Heneicosylic acid 0.07 0.48 0.09 0.75 0.22 0.29 0.1 0.04 C20:3 n-3 cis-8,11,14-Eicosatrienoic acid 0 0.07 0 0.05 0.3 0.29 0.57 0.04 C20:4 n-6 Arachidonic acid 0 1.07 3.84 0 18.83 0.06 6.51 0.19 C20:5 n-6 cis-5,8,11,14,17-Eicosapentaenoic acid 0.13 2.63 3.99 21.59 0.45 6.62 3.26 0.24 C22:2 n-6 cis-13,16-Docosadienoic acid 0.07 0.19 0.09 0.33 0.07 0.09 0.09 0.96
The total concentrations of fatty acids in the propolis samples ranged from 21.21 to 55.63% (Table 4). The lowest concentration was found in the propolis from the PR3 (Boumerdès) area and the highest concentration was in sample PR5 (Tlemcen). In a previous report, the total fatty acid concentration of Yemeni propolis samples was low, ranging from 0.25 to 20.78% [16].
The fatty acids of flora and fauna have mainly even carbon chain length homologues and usually range from C12 to C32. They are generally unsaturated in flora and saturated in fauna.
The major fatty acids in plants are the C18 monosaturated, disaturated and triunsaturated forms,
whereas polyunsaturated fatty acids are more common in algae than higher plants [16, 17]. In total, 14 Saturated fatty acids were determined; four of them are from all propolis samples (Undecanoic; Palmitic; Heptadecanoic and Stearic acid), seven obtained from most samples (Butyric; Caprinic; Tridecanoic; Myristic; Pentadecanoic; Arachidic and Behenic acid), and three obtained from two or three samples (Capronic; Caprylic and Lauric acid) (Figure 3). In a previous report, compounds extracted from Canadain; Turkish and New Zealand propolis also showed a Lauric; Myristic; Palmitic and Stearic acid [18-20].
In total, 16 unsaturated fatty acids were determined; seven of them are monounsaturated fatty acids and nine are polyunsaturated fatty acids, ten of them are from all propolis samples (Palmitoleic; Oleic, Elaidic; Linoleic, γ-Linolenic, α-Linolenic, cis-11,14-Eicosadienoic,
cis-11,14,17-Eicosatrienoic, Heneicosylic, cis-5,8,11,14,17-Eicosapentaenoic and
cis-13,16-Docosadienoic acid). Myristoleic acid obtained from PR1; PR2; PR4; PR6 and PR8 samples, Ginkgolic acid obtained from PR3; PR4; PR5; PR7 and PR8 samples, Erucic and cis-8,11,14-Eicosatrienoic acid obtained from most samples (Figure 3). The analyzed samples present a level of UFA between 19.72% and 51.85. The profiles obtained for the analyzed propolis from Algeria were similar to the data from a report by Al-Ghamdi, on Yemeni propolis [16].
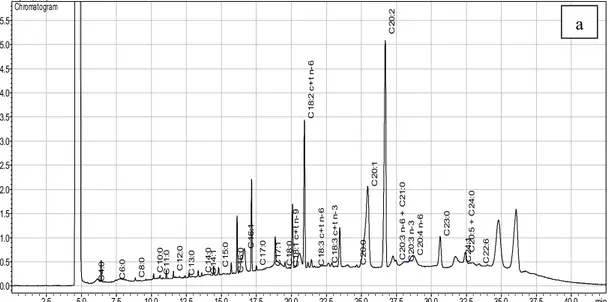
2.5 5.0 7.5 10.0 12.5 15.0 17.5 20.0 22.5 25.0 27.5 30.0 32.5 35.0 37.5 40.0 min 0.0 0.5 1.0 1.5 2.0 2.5 3.0 3.5 4.0 4.5 5.0 5.5 uV(x10,000) Chromatogram C 4 :0 C 6 :0 C 8 :0 C 1 0 :0 C 1 1 :0 C 1 2 :0 C 1 3 :0 C 1 4 :0 C 1 4 :1 C 1 5 :0 C 1 6 :0 C 1 6 :1 C 1 7 :0 C 1 7 :1 C 1 8 :0 C 1 8 :1 c+ t n -9 C 1 8 :2 c+ t n -6 C 1 8 :3 c+ t n -6 C 1 8 :3 c+ t n -3 C 2 0 :0 C 2 0 :1 C 2 0 :2 C 2 0 :3 n -6 + C2 1 :0 C 2 0 :3 n -3 C 2 0 :4 n -6 C 2 3 :0 C 2 4 :1 C 2 0 :5 + C 2 4 :0 C 2 2 :6 2.5 5.0 7.5 10.0 12.5 15.0 17.5 20.0 22.5 25.0 27.5 30.0 32.5 35.0 min 0.0 1.0 2.0 3.0 4.0 5.0 6.0 7.0 8.0 uV(x10,000) Chromatogram C 4 :0 C 8 :0 C 1 0 :0 C 1 1 :0 C 1 2 :0 C 1 3 :0 C 1 4 :0 C 1 4 :1 C 1 5 :0 C 1 5 :1 C 1 6 :0 C 1 6 :1 C 1 7 :0 C 1 7 :1 C 1 8 :0 C 1 8 :1 c+ t n -9 C 1 8 :2 c + t n -6 C 1 8 :3 c+ t n -6 C 1 8 :3 c+ t n -3 C 2 0 :0 C 2 0 :1 C 2 0 :2 C 2 0 :3 n -6 + C2 1 :0 C 2 0 :3 n -3 C 2 0 :4 n -6 C 2 3 :0 C 2 4 :1 C 2 0 :5 + C 2 4 :0 C 2 2 :6
Fig 3. GC−FID profiles of hexane extracts of propolis (a) PR2, and (b) PR8 samples
The hexane extracts are similar in that they all contain Butyric, Caprinic, Undecanoic, Heptadecanoic, Stearic, Oleic, Elaidic, γ-Linolenic, α-Linolenic, cis-11,14,17-Eicosatrienoic, Heneicosylic and cis-13,16-Docosadienoic acid, but PR2 and PR8 contains Caprylic acid exclusively, also PR2 and PR3 contains Capronic acid exclusively, and PR1, PR2, and PR8 contains Lauric Acid exclusively (Table 3).
The Palmitic, Palmitoleic, cis-11-Eicosenoic, Linoleic, and cis-11,14-Eicosadienoic acid were
the most abundant in the PR1 sample, while cis-11-Eicosenoic, Linoleic,
cis-11,14-Eicosadienoic and cis-5,8,11,14,17-Eicosapentaenoic acid were the most abundant in a
the PR1 sample.
The cis-11-Eicosenoic, Linoleic, Arachidonic, and cis-5,8,11,14,17-Eicosapentaenoic acid were the most abundant in the PR3 sample, and the cis-11-Eicosenoic, Linoleic, α-Linolenic and cis-5,8,11,14,17-Eicosapentaenoic acid were the most abundant in the PR4 sample, In relation to the individual fatty acids, PR8 sample showed a higher percentage of linoleic, cis-11,14-Eicosadienoic acid and, in general, of palmitic acid, compared to other samples (Table 3).
PR1 sample showed a significantly higher proportion of palmitoleic and
cis-11,14-eicosadienoic acid. PR2 and PR6 samples showed the highest proportion of
cis-11,14-Eicosadienoic acid and PR4 samples, the highest levels of
cis-5,8,11,14,17-Eicosapentaenoic acid. PR7 sample showed the highest proportion of Palmitoleic; Arachidic and cis-8,11,14-Eicosatrienoic acid.
Table 4. Proportion of different fatty acids groups in the propolis lipid extracts
Fatty acid group PR1 PR2 PR3 PR4 PR5 PR6 PR7 PR8
SFA 2.54 1.84 1.49 2.16 3.78 0.98 1.87 4.71 UFA 26.73 46.96 19.72 34.76 51.85 29.75 38.18 36.65 UFA/SFA ratio 10.52 25.52 13.23 16.09 13.72 30.36 20.42 7.78 MUFA 20.82 16.86 5.24 5.77 26.7 0.58 23.25 2.53 PUFA 5.78 27.47 10.49 7.4 24.7 22.55 11.67 33.88 PUFA/MUFA ratio 0.28 1.63 2.00 1.28 0.92 38.88 0.50 13.39 ω-3 0.06 0.29 0.05 2.17 0.44 0.42 0.77 0.33 ω-6 5.74 28.18 14.43 26.55 24.66 28.75 14.06 33.43 ω-6/ ω-3 ratio 95.67 97.17 288.6 12.23 56.04 68.45 18.26 101.3 H 1.84 0.16 0.13 0.3 2.37 0.19 0.32 3.77 h 2.84 11.46 14.3 28.42 22.72 15.59 12.71 13.17 h/H ratio 1.54 71.62 110 94.73 9.58 82.05 39.72 3.49 Total FA 29.27 48.8 21.21 36.92 55.63 30.73 40.05 41.36
SFA: Saturated Fatty Acids; UFA: Unsaturated Fatty Acids; MUFA: Monounsaturated Fatty Acids; PUFA: Polyunsaturated Fatty Acids; ω-3: Omega-3; ω-6: Omega-6; H: Hypercholesterolemic Fatty Acids (H=C14:0
+ C16:0); h: Hypocholesterolemic Fatty Acids
(h=C18:1+C18:2+C18:3+C20:3+C20:4+C20:5+C22:4+C22:5+C22:6).
The analyzed samples present a level of ω-6 between 5.74% and 33.43% of the total fatty acids. In all cases, ω-6 is significantly higher than ω-3 (Table 4). The profiles obtained for the
analyzed propolis from Algeria were opposite to the data from a report by Feás [21]. Fatty acids from ω−6 series are biogenetic precursors of some physiologically important prostaglandins, thromboxanes, and leukotrienes hormones, which are related to the inflammatory response. The nutritional value of essential ω−3 and ω−6 fatty acids is also widely known for its health advantages [22].
A comparison between the results of the present investigation and data from the literature relative to the composition of propolis reveals a general similarity between the latter and Algerian propolis, although notable differences are apparent as to the relative proportions of some constituents (Table 5).
Table 5. Results of previous studies Cameroon [11] Canada [19] Yemen [16] Turkey [9, 20, 23, 24] Caprinic acid 0.02 Lauric acid 0.33 Myristic Acid 0.001-0.13 Palmitic Acid 0.6 + 0.1-4.67 0.33-2.39 Stearic Acid 0.2 0.1 0.013 0.11-1.23 Arachidic Acid 0.2 0.01-0.018 Oleic Acid 0.8 0.3-0.7 0.002-1.21 0.63-1 Linoleic acid 0.12-3.43 α-Linoleic acid 0.4 9-Octadecanoic acid 2.12-0.36 Behenic acid 1.88-1.02 3.3. Clustering analysis
Obviously, the fatty acids compositions of propolis samples vary between different samples. The major compounds determined in the samples from Algeria include cis-11-Eicosenoic;
cis-11,14-Eicosadienoic; cis-5,8,11,14,17-Eicosapentaenoic; Arachidonic; Linoleic;
Palmitoleic; Palmitic and α-Linolenic acid. Heptadecanoic; Myristoleic; Ginkgolic; γ-Linolenic and Erucic acid, which were detected in these samples, were not detected in Turkish, Yemeni, Cameroon and Brazilian propolis. The compounds vary between different samples and locations. To investigate the similarity between the different samples,
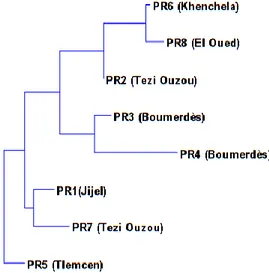
hierarchical cluster analysis (HCA) by the neighbor-joining method was used. The output of the cluster analysis is shown in Figure 4 where three separate sample clusters are recognized. The first cluster includes three (PR2; PR6 and PR8) propolis samples, the second includes two (PR3 and PR4) propolis samples, and the third includes the rest of the propolis samples (PR1; PR5 and PR7).
The third cluster shows that the sample PR5 deviate from PR1 and PR7. This indicates that sources of propolis components from Tlemcen are different from the samples collected from Jijel and Tezi ouzou.
Fig 4. Clustering analysis of identified constituents by GC/FID of samples of Algerian propolis using the neighbor-joining method.
4. CONCLUSIONS
In the present study, propolis from the six regions of Algeria was characterized by identifying and semi-quantifying major fatty acids components. The major compounds were in order: cis-11-Eicosenoic Acid> cis-11,14-Eicosadienoic acid> cis-5,8,11,14,17-Eicosapentaenoic acid> Arachidonic acid> Linoleic acid> Palmitoleic acid> Palmitic acid> α-Linolenic acid. The results obtained in this study demonstrated that propolis constitutes a good source of healthy compounds, namely, unsaturated fatty acids (ω-6 and ω-3), and suggests that it might be useful in prevention of diseases. Algerian propolis from different regions is nutritionally well-balanced and revealed high levels of healthy fatty acids and good PUFA/SFA ratios.
5. REFERENCES
[1] Silva-Carvalho R, Baltazar F, Almeida-Aguiar C: Propolis: a complex natural product with a plethora of biological activities that can be explored for drug development. J. Evid. Based. Complementary. Altern. Med., 2015, 2015: 1-29.
[2] Bogdanov S: Propolis: Composition, health, medicine: A review. Bee Product Science, www bee-hexagon net, 2012.
[3] Marcucci MC: Propolis: chemical composition, biological properties and therapeutic activity. Apidologie, 1995, 26(2):83-99.
[4] Bankova V: Chemical diversity of propolis and the problem of standardization. J. Ethnopharmacol., 2005, 100(1):114-117.
[5] Segueni N, Zellagui A, Moussaoui F, Lahouel M, Rhouati S: Flavonoids from Algerian propolis. Arab. J. Chem., 2016, 9:S425-S428.
[6] Piccinelli AL, Mencherini T, Celano R, Mouhoubi Z, Tamendjari A, Aquino RP, Rastrelli L: Chemical composition and antioxidant activity of Algerian propolis. J. Agric. Food Chem., 2013, 61(21):5080-5088.
[7] Bankova V, Dyulgerov A, Popov S, Marekov N: A GC/MS study of the propolis phenolic constituents. Zeitschrift für Naturforschung C 1987, 42(1-2):147-151.
[8] Greenaway W, Scaysbrook T, Whatley F: The composition and plant origins of propolis: a report of work at Oxford. Bee world 1990, 71(3):107-118.
[9] Sahinler N, Kaftanoglu O: Natural product propolis: chemical composition. Nat. Prod. Res., 2005, 19(2):183-188.
[10] Popova M, Dimitrova R, Al-Lawati HT, Tsvetkova I, Najdenski H, Bankova V: Omani propolis: chemical profiling, antibacterial activity and new propolis plant sources. Chem Cent J., 2013, 7(1):158.
[11] Ngenge TA, Carol MDE, Emmanuel T, Vernyuy TP, Joseph MT, Popova M, Bankova V: Chemical Constituents and Anti-ulcer Activity of Propolis from the North-West Region of Cameroon. Research Journal of Phytochemistry 2016, 10(2):45-57.
[12] Vickers AK: High-efficiency FAMEs analyses using capillary GC. American laboratory 2007, 39(2):18.
[13] AOAC: Official Methods of Analysis of AOAC International, 16th Edition edn: AOAC International, Arlington, VA; 1995.
[14] Nawar W: Lipids, 3rd edn edn. New York: Marcel Dekker; 1996.
[15] Huerta-Leidenz N, Cross H, Lunt D, Pelton L, Savell J, Smith S: Growth, carcass traits, and fatty acid profiles of adipose tissues from steers fed whole cottonseed. J. Anim. Sci., 1991, 69(9):3665-3672.
[16] Al-Ghamdi AA, Bayaqoob NI, Rushdi AI, Alattal Y, Simoneit BR, El-Mubarak AH, Al-Mutlaq KF: Chemical compositions and characteristics of organic compounds in propolis from Yemen. Saudi. J. Biol Sci., 2016.
[17] Kolattukudy PE, Croteau R, Buckner J: Biochemistry of plant waxes. Chemistry and biochemistry of natural waxes 1976.
[18] Markham KR, Mitchell KA, Wilkins AL, Daldy JA, Lu Y: HPLC and GC-MS identification of the major organic constituents in New Zeland propolis. Phytochemistry, 1996, 42(1):205-211.
[19] Christov R, Trusheva B, Popova M, Bankova V, Bertrand M: Chemical composition of propolis from Canada, its antiradical activity and plant origin. Nat. Prod. Res., 2006, 20(06):531-536.
[20] Koru O, Toksoy F, Acikel CH, Tunca YM, Baysallar M, Guclu AU, Akca E, Tuylu AO, Sorkun K, Tanyuksel M: In vitro antimicrobial activity of propolis samples from different geographical origins against certain oral pathogens. Anaerobe, 2007, 13(3):140-145.
[21] Feás X, Vázquez-Tato MP, Estevinho L, Seijas JA, Iglesias A: Organic bee pollen: botanical origin, nutritional value, bioactive compounds, antioxidant activity and microbiological quality. Molecules 2012, 17(7):8359-8377.
[22] Abedi E, Sahari MA: Long‐chain polyunsaturated fatty acid sources and evaluation of their nutritional and functional properties. Food. Sci. Nutr., 2014, 2(5):443-463.
[23] Vardar-Ünlü G, Silici S, Ünlü M: Composition and in vitro antimicrobial activity of Populus buds and poplar-type propolis. World. J. Microbiol. Biotechnol., 2008, 24(7):1011-1017.
[24] Silici S, Kutluca S: Chemical composition and antibacterial activity of propolis collected by three different races of honeybees in the same region. J. Ethnopharmacol., 2005, 99(1):69-73.
How to cite this article:
Rebiai A, Belfar ML, Mesbahi MA, Nani S, Tliba A, Ghamem amara D and Chouikh A. Fatty acid composition of Algerian propolis. J. Fundam. Appl. Sci., 2017, 9(3), 1656-1671.


![Table 5. Results of previous studies Cameroon [11] Canada [19] Yemen [16] Turkey [9, 20, 23, 24] Caprinic acid 0.02 Lauric acid 0.33 Myristic Acid 0.001-0.13 Palmitic Acid 0.6 + 0.1-4.67 0.33-2.39 Stearic Acid 0.2 0.1 0.013 0.11](https://thumb-eu.123doks.com/thumbv2/123doknet/11614719.303598/12.892.141.750.470.815/results-previous-studies-cameroon-caprinic-myristic-palmitic-stearic.webp)