HAL Id: hal-02639285
https://hal.archives-ouvertes.fr/hal-02639285
Submitted on 30 Jun 2020
HAL is a multi-disciplinary open access
archive for the deposit and dissemination of
sci-entific research documents, whether they are
pub-lished or not. The documents may come from
teaching and research institutions in France or
abroad, or from public or private research centers.
L’archive ouverte pluridisciplinaire HAL, est
destinée au dépôt et à la diffusion de documents
scientifiques de niveau recherche, publiés ou non,
émanant des établissements d’enseignement et de
recherche français ou étrangers, des laboratoires
publics ou privés.
In-situ localized pH, pNa and dissolved O2
measurements during charge-discharge of mixed Ni–Co
hydroxide electrodes
Alberto Adán-Más, Maryna Taryba, Teresa Silva, Liliane
Guerlou-Demourgues, Maria Montemor
To cite this version:
Alberto Adán-Más, Maryna Taryba, Teresa Silva, Liliane Guerlou-Demourgues, Maria Montemor.
In-situ localized pH, pNa and dissolved O2 measurements during charge-discharge of mixed Ni–Co
hydroxide electrodes. Journal of The Electrochemical Society, Electrochemical Society, 2020, 167 (8),
pp.080511. �10.1149/1945-7111/ab8924�. �hal-02639285�
Society
OPEN ACCESS
In-Situ Localized pH, pNa and Dissolved O
2
Measurements During
Charge-Discharge of Mixed Ni–Co Hydroxide Electrodes
To cite this article: Alberto Adán-Más et al 2020 J. Electrochem. Soc. 167 080511
View the article online for updates and enhancements.
In-Situ Localized pH, pNa and Dissolved O
2Measurements During
Charge-Discharge of Mixed Ni
–Co Hydroxide Electrodes
Alberto Adán-Más,
1,2,zMaryna G. Taryba,
1Teresa M. Silva,
1,3Liliane
Guerlou-Demourgues,
2,4and M. F. Montemor
11
Centro de Química Estrutural-CQE, Departamento de Engenharia Química, Instituto Superior Técnico, Universidade de Lisboa, 1049-001, Lisboa, Portugal
2
CNRS, University of Bordeaux, Bordeaux INP, ICMCB UMR 5026, 33600 Pessac, France
3ADEM, GI-MOSM, ISEL-Instituto Superior de Engenharia de Lisboa, Instituto Politécnico de Lisboa, Lisboa, Portugal 4
RS2E, Réseau Français sur le Stockage Electrochimique de l’Energie, FR CNRS 3459, France
This work reports, for thefirst time, the use of ion-selective localized electrochemical techniques to elucidate the charge-discharge mechanism of nickel-cobalt hydroxide electrodes for electrochemical energy storage. The charge-discharge mechanism of electrodeposited nickel-cobalt hydroxide electrodes was studied in Na2SO40.05 M by localized in situ measurements of pH, pNa
and dissolved O2during cyclic voltammetry. Local pH and pNa distributions were recorded using micro-potentiometric sensors
with liquid membrane, while dissolved O2was monitored using afiber-optic microsensor. These original results highlight how
localized potentiometry can provide new insights to better understand the charge mechanism of metal (hydr)oxide electrodes by directly measuring the concentrations/activities of relevant species at the electrode-electrolyte interface during charge-discharge. © 2020 The Author(s). Published on behalf of The Electrochemical Society by IOP Publishing Limited. This is an open access article distributed under the terms of the Creative Commons Attribution Non-Commercial No Derivatives 4.0 License (CC BY-NC-ND,http://creativecommons.org/licenses/by-nc-nd/4.0/), which permits non-commercial reuse, distribution, and reproduction in any medium, provided the original work is not changed in any way and is properly cited. For permission for commercial reuse, please email:oa@electrochem.org. [DOI:10.1149/1945-7111/ab8924]
Manuscript submitted February 4, 2020; revised manuscript received April 13, 2020. Published April 23, 2020. Supplementary material for this article is availableonline
Progress in nanostructured materials has enabled a wide range of novel solutions for electrochemical energy storage, with a multitude of electrode materials displaying various responses varying from purely capacitive to faradaic controlled charge-discharge processes.1 It is consensual that the next-generation of energy storage devices will rely on differentfit-for-purpose materials with tailored proper-ties. Rapid advancements, however, led to a bewildering range of electrochemical responses and, in some cases, misinterpretations thereof, an issue that has been extensively discussed in several reports.1–3Thus, it is agreed that is necessary to develop and adopt dedicated tools to further understand the mechanisms associated to the various electrochemical processes during charge-discharge of the electrodes in an electrochemical energy storage device.
Among different materials, nickel-cobalt hydroxides and oxides have been intensively used in electrochemical energy storage applications such as nickel batteries4 due to its high theoretical capacity, low cost, accessibility and simple synthesis.5–9Studies to understand the oxidation-reduction mechanism of nickel hydroxide-based materials and the different phases involved in the charge storage process have been performed since 1966, when Bode et al. proposed a diagram elucidating the possible phase transformations occurring in the material.10Recently, this material has resurged as an important contributor to the next-generation of electrochemical energy storage devices,11–15 with renewed interest on its charge storage mechanism to better tailor the electrode response.
Although the final phases are well known, and the relatively simple charge storage mechanism of nickel hydroxide-based mate-rials has been widely discussed, the exact mechanisms of charge storage are not completely understood yet, leading to several contradicting models proposed in literature.16,17In general, literature reports either solid-state H+ transport mechanism18–20 or OH− transport model.18,21–23 On the one hand, when H+ transport is considered, different sub-models have been proposed, depending on the contribution of cations from the solution, the hydration of metal ions and the extent of hydration of reactants and reaction products.18–20 Additionally, if cobalt (III) ion contributions are included, the typical theoretical mechanism depicted in Eq. 1has
been proposed: y Ni Co OH 2NO , CO H O 0.5 y Na , K Ni Co OO H Na , K H O 2 H 1 x 2 2NO , CO 0.5 x e 1 x 1 x 2 3 32 1 x 2 2 0.5 x 1 x y 0.5 y 2 0.5 3 32 ( ) ( ) ( ) ( )( ) ( ) ( ) ( ) ( ) ( ) ( ) ( ) [ ] ( ) ( ) / / a g -+ - « -´ + -+ - + + - - - -+ + - + + + - + - -
-When cobalt (II) is considered, Eq.2can be adopted:
x x
Ni Cox 1 xO H2 1 x Ni Cox 1 xOOH H e [ ]2
b- - + «b- - + ++ -On the other hand, the mechanism based on OH− has been supported by oxygen and hydrogen isotopic studies,22 resulting in the commonly reported mechanism for nickel-cobalt hydroxide in energy-storage described by Eqs.3and4:
y y Ni Co OH 2NO , CO H O 0.5 y Na , K 2 OH Ni Co OO H Na , K H O 2 H O 1 x 2 2NO , CO 0.5 x e 3 x 1 x 2 3 32 1 x 2 2 0.5 x 1 x y 0.5 y 2 0.5 2 3 32 ( ) ( ) ( ) ( )( ) ( ) ( ) ( ) ( ) ( ) ( ) ( ) ( ) [ ] ( ) ( ) / / a -+ - + - « -+ - + -+ + - - - -+ + -- + + + -- -x x x Ni Co O H OH Ni Co OOH H O e 4 x 1 x 2 1 x x 1 x 2 [ ] b- + «b -+ + - + -
-There are, however, two additional contributions to consider: the role of cations (which differs in the different models proposed in literature20–22) and the effect of the oxygen evolution reaction (OER). Along the nickel hydroxide oxidation-reduction reactions, OER has been considered a parasitic reaction that induces hysteresis in the electrode response.24,25 However, the extent of this phe-nomena is yet to be determined.26 Pandolfo et al.27 reported that OER on Ni(OH)2occurs at 0.55 V vs Hg/HgO in 1 M KOH and Ta et al.28reported similar results at 0.5 V vs Hg/HgO. In principle, OER appears as a parasitic reaction, being fuelled by the current used during oxidation of the electrode, and produces a slowly and steady decrease of the oxidation state of nickel oxyhydroxide
(self-zE-mail:alberto.mas@tecnico.ulisboa.pt
discharge) at open circuit, as demonstrated by Conway et al.26,28,29 In any case, the effect of the oxygen evolution reaction (OER) as parasitic reaction when charging nickel hydroxide is of relevance when mechanistic studies are considered.
Nickel hydroxide-based materials have been thoroughly investi-gated by different techniques, for instance, electrochemical quartz crystal microbalance (EQCM),21,22,30 X-ray adsorption near edge structure (XANES) combined with extended X-ray absorptionfine structure (EXAFS),31 Raman,32,33 UV,34 or scanning electron microscopy.35Recently, the combination of EQCM with probe laser beam (PLB) was proposed as in situ characterization tool to precisely determine the oxidation-reduction mechanism. EQCM accurately quantifies mass changes,24while PLB allows determina-tion of the direcdetermina-tion of the net ionic flux across the electrode-electrolyte interface.30Despite these important advances, it is still challenging to separate the contribution of cations, anions and solvent molecules and to precisely understand the nature of the charge-compensation processes.17
From the electrochemical point of view, electrochemical im-pedance spectroscopy (EIS) is, probably, the most suitable tech-nique, alongside rotating disk electrode and electrochemical quartz crystal microbalance (EQCM) for mechanistic studies.30,36 Conventional electrochemical methods (e.g. EIS and cyclic voltam-metry) provide important information on the averaged response from the working electrode-electrolyte interaction, but lack detail on the role of individual species involved in the storage mechanisms. Therefore, there is the need to find new tools that can bring additional light on these issues. This role can be discriminated by means of localized electrochemical techniques based on the use of micro-probes, e.g. potentiometric microelectrodes and fiber-optic microsensors.
Local micro-potentiometry, also known as scanning ion-selective electrode technique (SIET), has been widely used in biology, physiology and, over the last years, in corrosion science, advancing significantly knowledge on the electrochemical response of many systems.37–45 It enables in situ measurements of the activity of specific ions at a quasi-constant micro-distance over an active surface in an electrolyte. Furthermore, thefiber-optic fluorescence-based microsensor, also employed in this work, enables in situ detection of dissolved oxygen (DO), complementing SIET informa-tion. These measurements, made locally and quasi simultaneously at the interface between the active electrode material and the electro-lyte, can provide key chemical information during polarization of the electrode material at the vicinity of the electrode-electrolyte inter-face. It means that polarization results can be correlated with the results obtained locally by micro-potentiometry and DO monitoring usingfiber-optic microsensor to better understand the charge-storage process.
It is worth stressing that there are significant differences between measurements of bulk and localized ions’ concentrations/ activities. Measurements in bulk electrolyte provide important insights, how-ever, results always reflect an averaged response related to the concentration of species in solution. Contrarily, in the vicinity of the surface of the electrode, the distribution of some specific ions in solution may change during the oxidation-reduction processes, thus involving species either from the medium or from the active material. Due to mass transfer processes (i.e. diffusion, convection, migration), these changes in ions’ distributions vanish when progressing into bulk solution, and, hence, can only be detected at the vicinity of the active surface. And this is exactly the gap that can befilled by applying spatially-resolved electrochemical tools. Thus, localized techniques (e.g. micro-potentiometry, optic microsensors) can bring complementary information to better understand the charge-discharge mechanisms of materials used for electrochemical energy storage.
The present work introduces for the first time, to the best of author’s knowledge, localized micro-potentiometric and fiber-optic microsensors into the field of electrochemical energy storage. To that end, pH, pNa and dissolved O2 localized measurements were
performed during charge-discharge of electrodeposited nickel-cobalt hydroxide in 0.05 M Na2SO4. Results show how the use of microsensors for localized monitorization of the concentrations of species of interest can serve as a complementary tool to further elucidate the mechanisms governing the charge-discharge processes of materials for electrochemical energy storage.
Experimental
Synthesis of the Ni–Co hydroxide film.—Ni-Co hydroxide was prepared by cathodic electrodeposition on stainless steel using a potentiostat/galvanostat Gamry Interface 5000E. A pulsed potential between−0.9 V and −1.2 V was applied to the working electrode in a three-electrode cell containing 50 ml solution of 0.11 g of Co(NO3)2and 0.21 g of Ni(NO3)2. The duration of each pulse was 10 s, resulting in a total of 400 s electrodeposition. Platinum wire was used as counter electrode, a saturated calomel electrode (SCE) as reference electrode and stainless-steel (AISI 304, Goodfellow) as working electrode. The dimensions of the electrode were 4 mm× 4 mm× 4 mm, as shown in Fig. S1 (Supplementary information) (available online at stacks.iop.org/JES/167/080511/mmedia). Activation and stabilization (later referred as “break-in”) of the electrode material was performed prior to the sample analysis. For that, the sample was cycled between −0.2 V and 0.9 V for an average of 22 cycles at 10 mV·s−1.
Electrodeposited thin-films are used since they are not affected by the influence of binders, carbonaceous additives, current-collector geometry or other components typically utilized in commercially prepared nickel-cobalt hydroxide electrodes.29
Materials characterization.—To study the material’s composi-tion and morphology, field emission scanning electron microscope coupled with EDS was used (FEG-SEM JEOL JSM7001F with Oxford light elements EDS detector INCA 250) and a Hitachi 8100 transmission electron microscope with LaB6filament at a working voltage of 20.0 kV coupled with a ThermoNoran SystemSix EDS detector.
X-Ray Diffraction patterns were obtained using an X’Pert Philips PMD diffractometer with a Panalytical X’celerator detector, using graphite-monochromized Cu Kαradiation (λ = 1.54056 Å).
Raman spectra were collected by means of an i-Raman® spectro-meter from B&W Tek with an excitation laser beam of 532 nm. The spectra were obtained with an acquisition time of 60 s and 2 accumulations.
Electrochemical study.—Cyclic voltammetry was carried out with a potentiostat/galvanostat Gamry Interface 5000E with 2 Pt black electrodes, employed as reference and counter, at 5 mV·s−1in a potential window ranging from −0.2 V to 1.1 V vs Pt black in Na2SO4 0.05 M. Simultaneously, localized pH, pNa and dissolved O2were monitored in situ. All the measurements are recorded during the second cycle at the designated scan rate after the initial conditioning of 22 cycles at 10 mV·s−1, hereafter referred as “break-in.”
To ensure the reliability of Pt as QRE, important precautions were considered: (i) Pt black was deposited on top of the Pt reference wire electrode to increase its surface area, subsequently improving the uniformity of current distribution and reducing the system resistance and increasing the signal/noise ratio. (ii) The reference electrode was located in the bulk solution, at a distance ensuring that the polarization of the active electrode did not affect the solution around the Pt reference. (iii) a circular Pt counter electrode (with Pt black deposited on the top of Pt wire) was used to improve the uniformity of current distribution and to assure that less current reached the reference electrode.
To ensure reliability of SIET measurements, a special experi-mental methodology was used and described in detail in the Supporting Information.
Micro-potentiometry.—Micro-potentiometric pH and pNa (i.e. pNa= −logaNa+) measurements were performed using equipment and corresponding software from Applicable Electronics™ and Science Wares™. pH-selective glass-capillary microelectrodes were employed. Silanized glass micropipettes were back-filled with the innerfilling solution and tip-filled with the corresponding ion-selective membrane. The microelectrodes were prepared based on H+and Na+selective membranes, respectively described in.46,47 Both ion-selective membrane compositions were specially devel-oped for electrochemical studies, allowing for high selectivity concerning the ion of interest, extended pH working range and minimal IR-drop effects. Glass-capillary microelectrodes have a tip orifice with 1.8 ± 0.2 μm diametre and were prepared as described elsewhere.46,48A homemade Ag/AgCl/0.05 M NaCl mini-electrode was used as an external reference electrode for micro-potentiometric measurements. In order to assess possible potential drifts, the ion-selective microelectrodes were calibrated before and after each measurement. The micro-potentiometric probes were positioned (30 ± 5) μm above the electrode surface. Measurements were obtained, at least, in triplicate.
Fiber-optic oxygen microsensor.—The concentration of dis-solved oxygen was measured using a FireStingO2fibre-optic oxygen meter (Pyroscience™). The microsensor (or microoptode) employs an O2-sensitive indicator immobilized on the tip of the sensor. The indicator is excitable with orange-red light at a wavelength of 610–630 nm and exhibits oxygen-dependent luminescence at 760–-790 nm. The measuring principle is based on the sinusoidally modulated red excitation light, that causes a phase-shifted sinusoid-ally modulated emission in the near infrared. A needle-type retractable microsensor OXR50 with 50μm tip diameter was used. The detection limit of the employed microoptode is 0.01 ppm. The microoptode was positioned (70 ± 10)μm over the sample surface. This sensor provides high stability of the signal, response time of less than 1 s and neither produces, nor consumes species from solution. The calibration of the microoptode was performed using N2 (0%DO) and air (20.9% DO) saturated solutions.49
Results and Discussion
Physico-chemical characterization.—Nickel-cobalt hydroxides were deposited on stainless steel collectors, as described and characterized elsewhere,13according to the information depicted in Fig. S2 (Supplementary information). Scanning electron microscopy (SEM) and transmission electron microscopy (TEM) were used to assess the morphology and microstructural characteristics of the electrode material, while X-ray diffraction (XRD), Raman spectro-scopy and energy dispersive spectrospectro-scopy (EDS) were performed to elucidate the chemical composition. As exhibited in Fig.1a, nickel-cobalt hydroxide presented nanosheet-like structure, with nearly vertical alignment that forms percolation networks, in good agree-ment with literature.50TEM images, depicted in Fig.1b, revealed the thin nature and also the random orientation of the electrodeposited nanosheets. The electron diffraction pattern obtained for selected areas (SAED) evidenced the presence of blurred diffraction peaks, as result of the nano-structural nature or low degree of crystallinity of the material.
XRD patterns, depicted in Fig. 1c, exhibit a wide line corre-sponding to the (001) reticular plane family in the usual hexagonal symmetry. At the very beginning, this line is located at 10.32°, indicating an interslab distance of approximately 8.5 Å. However, after a 22-cycle break-in, the line is shifted to 18.70°, which corresponds to an interslab distance of 4.7 Å. Nickel-cobalt hydro-xide materials consist of NixCo1−x(OH)2slabs that may incorporate H2O, NO3−and CO32−into the interlayer distance. Depending on the extent of these intercalated molecules, two different phases can be formed,α or β. For β nickel-cobalt hydroxide materials, there are no intercalated species in the interslab space, except protons linked to the oxygen of the slabs, resulting in an interplanar distance of
approximately 4.8 Å, while this distance is enlarged to 7.5–8.5 Å for theα phase, depending on the intercalated species.51In this work, XRD results evidenced an initial interslab distance of 8.46 Å, a fact that allows to conclude that the pristine electrodeposited phase can be unequivocally classified as α-NixCo1−x(OH)2. Moreover, results obtained by XRD showed that, after break-in, this material is transformed into the β phase due to the poor stability of the α phase.14,52
Raman spectroscopy was performed in the 200–3700 cm−1 range. The single peak at 329.5 cm−1, and the double peak at 445.54 and 522.81 cm−1 are characteristic of Eg mode, O–M–O bending and M–O Ag vibrations modes, respectively. Moreover, there are two main characteristics that can differentiate theα phase from theβ phase by means of Raman spectroscopy: first, the peak at 1048.35 cm−1is associated to NO3−ions intercalated in the interslab space; secondly, Raman spectra present a shoulder at 3658 cm−1that disappears in theβ structure. Besides these, β structures also display a relatively intense peak at around 3580 cm−1.53Therefore, Raman spectra confirm, initially, the presence of α nickel-cobalt phase.
Energy dispersive spectroscopy and mapping were performed to evaluate the nickel-cobalt ratio and to study the homogeneity and dispersion of nickel and cobalt in the electrodeposited material and representative results are shown in Fig. S3 (Supplementary informa-tion). The Ni:Co atomic ratio obtained was 1.8, which is close to the electrolyte composition used in the synthesis process and is in good accordance with previous work.13
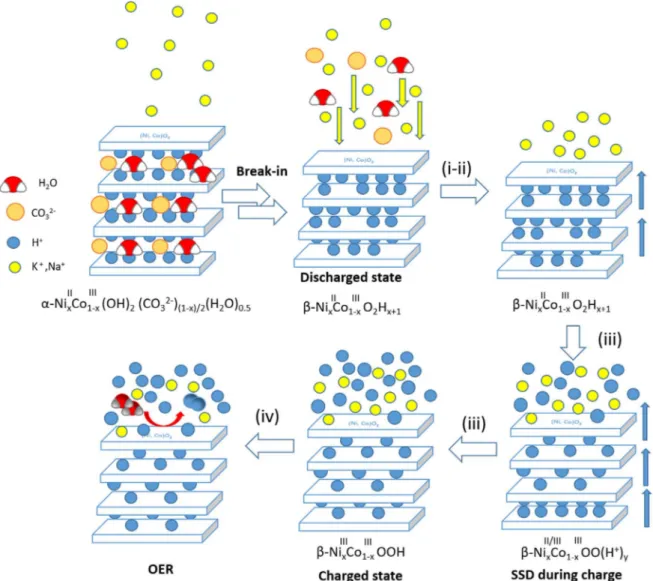
Localized electrochemical studies.—To evaluate accurately the results obtained by localized electrochemical techniques, it is important to consider experimental evidences observed during the charge-discharge of nickel hydroxide, which have been obtained by means of different techniques. Therefore, certain assumptions, based on published work, have been considered in the discussion of the charge-discharge mechanism of nickel-cobalt hydroxide:
1) Weidner et al.24 reported that EQCM studies show a mass increase during charge of α-Ni(OH)2 a result that has been generally assigned to cation insertion. Solid-state chemistry would therefore evidence sodium and potassium ions in ɣ-NixCo1−xOOH, but not in the α structure, whose interslab presents water molecules and anions such as carbonates and nitrates. Thus, cations shall be intercalated in some prismatic sites of theγ phases25during charge and de-intercalated during discharge.19,21,54–56Since electroneutrality shall be maintained, the transport of electrons and ions has to proceed at the same rate.57
2) Weidner et al.24 developed a non-stoichiometric model advo-cating for a continuous change in the composition of the material between Ni(OH)2 and NiOOH,
58
this is, they do not exist as separate solid phases but rather as one non-stoichio-metric solid phase.29According to this model, during oxidation, protons are removed from vacancies (and from the interslab space) and diffuse to the electrode-electrolyte interface59where they react with OH− to form water,16,28 with the consequent oxidation of Ni2+into Ni3+. Thus, these evidences support the proton transport model. Charge-discharge ofβ phase does not involve insertion or expulsion of cations.
3) Eventually, the mass variation reverses as consequence of the unstableα phase, which is transformed into a β phase.60This is known as “break-in,” which occurs during the first cycles. Cations and/or water molecules get de-intercalated and the species trapped in the interlayer space of α-Ni(OH)2 are expelled, typically, carbonate and nitrate anions.60–62
4) Studies by means of probe beam deflection (PBD) in combina-tion with EQCM suggested that α-films are characterized by hydroxyl ion transfers that dominate over proton and water movements, whileβ-Ni(OH)2films have an increased participa-tion of water and protons in the exchange dynamics. Some authors16,54also postulated that hydroxyl ions are driven into Journal of The Electrochemical Society, 2020 167 080511
thefilm during oxidation, while water molecules are driven out by the associated internal pressure. There was little direct evidence of significant transfer of cations across the interface. Thus, based on the PBD evidences it was proposed that cations are expulsed from thefilm material at a more negative potential than the peak potential (Ep) and, once the material is polarized above Ep, either hydroxyl insertion or de-intercalation of protons (producing water, which would not be detected by EPB since they would rapidly recombine with hydroxyl ions) would occur.16,54Results are interpreted differently, depending on authors support of either hydroxyl transport or proton-based mechanism.
5) It was reported that there is a variation of the water content with cycling, with water expulsion during charge and incorporation during discharge,18,55 regardless the counter-ion.17,20 Such increase can be explained differently depending on the model used. In agreement with a solid-state proton diffusion model, proton transport and expulsion during charge would ultimately recombine to form water at the electrode-electrolyte interface. On the other hand, assuming a hydroxyl transport model, OH− ions are inserted during oxidation, with the consequent increase in mass.16,62Moreover, the rigid nature of the nickel hydroxide lattice imposes volume constraints, thus, while hydroxyl ions enter the structure, water molecules must leave at the same rate during charge.18,56,63This results in H2O moving on the same time scale as ionic hydroxide and is not controlled by diffusion.54
Finally, OER may affect the entire charge-discharge reaction and is affected by the presence of cobalt, raising the oxygen overpotential.64,65
pH and dissolved oxygen.—The NixCo1−x(OH)2electrode was studied by cyclic voltammetry as presented in Fig.2. The discharge curve of the material can be found in Fig. S4 (Supplementary information) and the results evidence that this material displays a battery-like response in 0.05 M Na2SO4 with a plateau located at approximately 0.1 V (vs Pt black). Due to the limited time-response of the ion-selective electrode (2–3 s), cyclic voltammetry was performed at the scan rate of 5 mV·s−1in a potential range from −0.2 V to 1.1 V (vs Pt black). Results for pH and dissolved oxygen alongside the current response obtained by cyclic voltammetry extended over the time are presented in Fig.2b.
It is worth mentioning that in sulphate electrolytes, like Na2SO4, nickel hydroxide displays an extended potential window compared to KOH, as already reported.66,67Analogous phase transformation and faradaic reaction described by Eqs.1to4are expected also in this electrolyte.
Anodic scan.—When the sample was anodically polarized in the potential window from −0.2 V to 1.1 V, after twenty two cycles required to ensure stabilization, a peak at ∼0.9 V was clearly observed in the voltammetric profiles (Figs. 2a, 2b). Based on previous reports and on XRD results, these cycles were sufficient to ensure that the“break-in” occurs. During this period, anions initially intercalated in the interlayer space during electrodeposition are expelled, and the initialα phase is transformed into the β phase. This “break-in” process generated a pH value of 10–11 at the beginning of the cycle.
According to the pH variations determined, the potential window can be divided in three main regions: (1) in the range from−0.2 V to 0.8 V: progressive decrease of pH; (2) Scan throughout the anodic
Figure 1. Physico-chemical characterization of the surfacefilm: (a) Scanning Electron Microscopy image. (b) Transmission Electron Microscopy image with diffraction rings inset. (c) XRD Spectra and (d) Raman Spectra of NixCo1−x(OH)2.
peak: notorious diminution of pH; (3) Polarizations over 1 V: further pH decrease with OER.
Regarding the first region, −0.2 V to 0.8 V, it was possible to note a progressive pH decrease from 10 to 7.44, evidencing local acidification of the electrolyte.
If the cyclic voltammetry signal in the potential range from 0.4 V to 0.9 V is isolated, as shown in Fig. S5 (Supplementary informa-tion), a quasi-squared response is observed until 0.7 V. The absence of anodic peaks in this region indicates mainly pseudocapacitive phenomena. This is a consequence of the neutral aqueous medium used, Na2SO4, as compared to the commonly used alkali medium, KOH, which induces the faradaic transition along the entire active potential window.
If faradaic reactions are absent, the pseudocapacitive response would result mainly from adsorption phenomena at the interface with the electrolyte or surface-confined reactions. Indeed, the progressive pH decrease profile in this potential range probably accounts for electrolyte diffusion-controlled processes. Surface positive polarization is neutralized by SO42− which attracts posi-tively charged ions, namely H+, thus decreasing pH.
Nonetheless, in this electrode material, faradaic reactions cannot be completely discarded. Assuming that the faradaic reaction starts at 0.3 V and evolves until the main anodic peak, the progressive decay in the pH would be associated to an increase of proton concentration caused by proton de-intercalation, which would be in accordance to solid-state proton diffusion model. Alternatively, it could also be caused by hydroxyl injection if a hydroxyl transport
model is considered. This would locally decrease OH− concentra-tion, leading to a decrease in pH. However, it would imply generation of water inside the material that would be expelled, due to volume constrains imposed by the structural nature of theβ-phase. In any case, the extent of the faradaic reaction would be rather limited.
In the potential range from 0.8 V to 1.05 V, region 2, the faradaic reactions occur, as evidenced by the peak in the cyclic voltammo-gram and in this range, an abrupt decrease of pH from 7.76 to 2.32 is noticed. Thus, within this potential range a much sharper pH decrease occurred comparatively to the previous potential range. This abrupt acidification, occurring simultaneously with a faradaic process, allows to exclude diffusion-controlled processes in the electrolyte, which would induce a lower slope in the variation of pH. The pH drop can be consequence of either hydroxyl intercalation (in accordance with a hydroxyl transport model, which would locally reduce its concentration at the interface), or proton transport and proton release during the charging process (supporting a solid-state diffusion of protons). However, while the latter is only limited by the mobility of the protons within the electrode material (solid state diffusion) and its response would not be limited by diffusion in the electrolyte, hydroxide intercalation would be dominated by hydroxyl ions diffusion from the electrolyte to the electrode surface and by the solid-state hydroxyl mobility in nickel-cobalt hydroxide. Therefore, the abrupt pH decrease observed indicates that the process is not hydroxyl diffusion-limited in the electrolyte, but mainly controlled by the inner transformation of the material. Thus, according to the experimental evidence, solid-state transport of protons is pin pointed as the most likely mechanism.
Thefinal step in the anodic scan is the oxygen evolution reaction (region 3, 1.05 V to 1.1 V). Once the oxygen evolution reaction potential is reached, there was a substantial increase of the DO signal and an extra decrease of the pH that corresponds to the production of protons during OER, according to the reaction proposed in Eq.5:
2H O2 4 H++4e-+½O2 [ ]5
The variation of O2 in solution during the redox reaction was negligible and its concentration was maintained around 8.5 ppm (Fig.2), which is slightly higher than the normal range for dissolved oxygen in aqueous electrolytes (7–8 ppm). This evidences the production of oxygen during the charging of the electrode, this is, a continuous effect of OER along the entire active potential window, as previously suggested in literature.64,65
Cathodic scan.—Once the polarization is reversed, four different regions can be noticed: (4) Oxygen reduction reaction (1.1 V–1.0 V), with the consequent increase in pH and decrease in dissolved oxygen; (5) progressive pH raise (1.0 V–0.2 V); (6) sharp increase of pH, coincident with the cathodic peak (0.2 V to 0.0 V) and (7) pH stabilization around values of 10 after the reaction from 0.0 V to −0.2 V.
In the potential range from 1.0 V to 0.20 V, region 5, pH increased almost linearly from 2.9 to 5.4 at 5 mV·s−1. No peaks were detected in the voltammetric profile for this potential range and a diffusion-controlled regime (progressive increase) in the pH response was observed. Again, there are two possible explanations. On the one hand, considering a pseudocapacitive response based on adsorption/desorption of species, an equilibration between the interface and bulk electrolyte would be expected progressively raising the pH. On the other hand, it is possible that the reaction begins at this potential and intercalation of protons inside the active material would occur. Again, this process is controlled by both diffusion in the electrolyte and solid-state proton transport and is probably caused by the neutral nature of the electrolyte. Nonetheless, given the fact that local pH at the beginning of this process was acid, if de-intercalation of hydroxyl ions were considered, a more drastic change in pH would be expected and it is, therefore, unfeasible. For
Figure 2. (a) Cyclic voltammetry at 5 mV·s−1and its expanded version in time (b) with the corresponding in situ measurements of pH and dissolved O2
content variation within a potential range from−0.2 V to 1.1 V vs Pt black in Na2SO40.05 M.
that reason, only a solid-state diffusion of protons is proposed as discharge mechanism for nickel-cobalt hydroxide.
Finally, during the cathodic peak (region 6), there was an abrupt increase of pH to 9.0. The 3-unit pH variation indicates a reaction-controlled mechanism that likely occurs in the same manner as during anodic polarization. Protons, which are provided by the solvent, intercalate and proceed to a solid-state proton transport to neutralize the change in oxidation state of nickel ions. Solvent can be assumed to be easily accessible by the surface of the active material, being de-protonated to generate OH− and is not considered as a diffusion-limiting factor.
pNa results.—pNa results, shown in Fig.3, evidence sodium ions mobility during the reaction and indicate that they mainly play the role of maintaining surface electroneutrality with limited contribu-tion, as expected forβ nickel-cobalt hydroxide. Alkali ions are not likely to be inserted/de-intercalated during charge-discharge. However, they may accumulate at the interface during charge. After “break-in,” pNa levels were raised to 1.5. Based on pNa variations (pNa≈ −log[Na+]), the potential window during anodic polarization can be divided in four regions: (1) Potential range from −0.2 V to 0.0 V: decreasing pNa from 1.5 to 1.25. This initial decrease can be assigned to stabilization after previous cycles, as a significant variation is caused prior to change of polarization (as seen in the 0.0 V to−0.2 V range during cathodic scan). (2) Potential range from 0.0 V to 0.8 V with a stable pNa around 1.2, where sodium ions are apparently not involved. (3) Scan throughout the anodic peak with a large diminution of pNa from 1.25 to 0.5. (4) Increase of pNa during OER.
Once the anodic peak starts, there is an accumulation of sodium ions at the vicinity of the interface, with a decrease in pNa until 0.5. Given the solid-state structural limitations, sodium ions may be intercalated in the interslab ofβ (III) phases as shown by Delmas et al.68Nonetheless, this phenomenon is not fully understood yet and further investigations are required to better discriminate it. Other possible explanations are that sodium ions may accumulate to either maintain surface electroneutrality, as a result of sulphate migration, as a consequence of the change in conductivity of the active material in its transformation from (Ni–Co)OOH to Ni–Co(OH)2or,finally to account for electrolytefluxes or surface polarization.
During the oxygen evolution reaction, there was an increase of pNa, which can be associated to a decrease in the concentration of sodium ions. This has been previously explained by Lamaka et al.48 as a consequence of excess of positive charge due to the proton production that generates a localized repulsion of sodium ions resulting in Na+depletion.
Once the polarization is reversed, there is a constant pNa value during the re-stabilization after OER in the potential range from 1.1 V to 1.0 V, followed by a sharp change of pNa to∼1.75 in the 1.0 V to 0.8 V potential range and posterior stabilization to 1.5 in the 1 V to 0.2 V range. At this point, accumulated sodium ions at the interface caused by the anodic peak re-stablish their bulk levels, resulting in the drastic increase of pNa. It is observed that, in this case, pNa is slightly higher than during anodic polarization, which may be associated to different surface neutralization phenomena. An analogous interpretation to the anodic peak can be assumed for the increase in pNa during the cathodic peak. Once the reaction is finished, after complete transformation to Ni(OH)2, there is no need for further charge compensation and pNa returns to bulk levels.
In conclusion, the application of localized potentiometry enables the measurement of pH, dissolved oxygen and pNa at the electrode-electrolyte interface for nickel-cobalt hydroxides films used as charge storage electrodes. pH evolution suggests two main stages during the oxidation reaction, dominated by different processes. The first one is characterized by a steady decrease of pH that may correspond to ion adsorption processes, in which electrolyte diffu-sion plays the most important role, considering its neutral nature. This stage is followed by a drastic decrease of pH during the anodic peak, related to a solid-state transport of protons as charge
mechanism, as opposed to hydroxyl intercalation, which was also considered. The effect of OER as a parasitic reaction has been confirmed along the entire charge-discharge mechanism and clear oxygen evolution has been observed at overcharging potentials. Nonetheless, further studies shall be performed to establish the effect of OER in the self-discharge of the material. The entire process is exemplified in Fig.4.
As Mousty et al. indicated,17the understanding of the ion motion in the electron transport mechanism and surface reaction is very challenging. Conventional electrochemical techniques, even when coupled with in situ characterization techniques, are not always sufficient. The use of localized electrochemical techniques has enabled to obtain more information on the charge-discharge reac-tion, which has been intensively discussed for many years. These techniques are applied, for thefirst time, to understand the energy storage mechanism in nickel-cobalt hydroxides and may be extre-mely useful, in combination with other tools, to elucidate materials’ reactivity, oxidation mechanism of LDH materials and other energy storage materials, especially those involving intercalation phe-nomena. The participation of alkali ions in surface charge neutra-lization and the appearance of OER close to anodic peak potential have been confirmed. Nonetheless, further studies regarding the oxidation and cycling behavior, the role of cobalt in the nickel-hydroxide structure, the effect of the solvent and the self-discharge of the material shall be done by means of these techniques to achieve a more complete understanding of the oxidation-reduction reactions of nickel-cobalt hydroxide as charge storage materials.
Conclusions
For the first time, in situ localized measurements employing potentiometric (SIET) pH and pNa microelectrodes and dissolved oxygen fiber-optic microsensor were performed, at the micro-resolved scale, at the vicinity of the electrode-electrolyte interface. Such measurements allowed for direct in situ monitoring of concentrations of particular species involved in charge storage mechanism of nickel-cobalt hydroxide. Correlation of the results of localized electrochemical and O2microoptode measurements (i.e. pH, pNa and dissolved O2) and cyclic voltammetry provided relevant information concerning the charge-discharge reaction me-chanism. Results reinforce the solid-state proton diffusion model and confirms the effect of oxygen evolution reaction as parasitic reaction. Consequently, this works exemplifies, for the first time, how spatially-resolved electrochemical techniques employing sensi-tive microprobes, help to better understand the charge storage
Figure 3. Cyclic voltammetry at 5 mV·s−1 expanded in time with the corresponding measurement of pNa measured in situ within a potential range from−0.2 V to 1.1 V vs Pt black in Na2SO40.05 M.
mechanisms, revealing novel information on the chemical and electrochemical processes at electrode-electrolyte interface. Undoubtedly, these localized techniques may be extended into studying the charge storage mechanism of other materials, poten-tially bringing key insights to develop new electrodes for electro-chemical energy storage.
Acknowledgments
This work has been performed in scope of International Doctoral Program in Functional Materials (IDS-FunMat, Erasmus Mundus) and funded by the European Union. We would like to express our gratitude to the Fundação para a Ciência e Tecnologia (FCT) for the funding under the contracts M-ERA.NET/0004/2014 and UID/QUI/ 00100/2013, UID/QUI/00100/2019 and UIDB/00100/2020. We would like to acknowledge Tuyen Nguyen, Sonia Eugénio and Isabel Dias Nogueira for their assistance during characterization.
ORCID
Alberto Adán-Más https://orcid.org/0000-0003-0790-3467 Maryna G. Taryba https://orcid.org/0000-0001-5668-2213 Teresa M. Silva https://orcid.org/0000-0001-8402-6600
Liliane Guerlou-Demourgues https://orcid.org/0000-0002-0653-2572
M. F. Montemor https://orcid.org/0000-0001-7835-6814
References
1. Y. Gogotsi and R. M. Penner,ACS Nano, 12, 2081 (2018).
2. T. Brousse, D. Belanger, and J. W. Long,J. Electrochem. Soc., 162, A5185 (2015). 3. P. Simon, Y. Gogotsi, and B. Dunn,Science, 343, 1210 (2014).
4. A. Taniguchi, N. Fujioka, M. Ikoma, and A. Ohta,J. Power Sources, 100, 117 (2001).
5. G. Wang, L. Zhang, and J. Zhang,Chem. Soc. Rev., 41, 797 (2012).
6. Y. Chuminjak, S. Daothong, and A. Kuntarug,Electrochim. Acta, 238, 298 (2017). 7. P. Sirisinudomkit, P. Iamprasertkun, A. Krittayavathananon, T. Pettong, P. Dittanet,
P. Kidkhunthod, and M. Sawangphruk,Sustain. Energy Fuels, 1, 275 (2017). 8. H. Chen, L. Hu, M. Chen, Y. Yan, and L. Wu,Adv. Funct. Mater., 24, 934 (2014). 9. X. Cai, X. Shen, L. Ma, Z. Ji, C. Xu, and A. Yuan,Chem. Eng. J., 268, 251 (2015). 10. H. Bode, J. Witte, and K. Dehmelt,Electrochim. Acta, 11, 1079 (1966). 11. H. Chen, L. Hu, Y. Yan, R. Che, M. Chen, and L. Wu,Adv. Energy Mater., 3, 1636
(2013).
12. L. G. Beka, X. Li, and W. Liu,Sci. Rep., 7, 1 (2017).
13. A. Adán-Más, R. G. Duarte, T. M. Silva, L. Guerlou-Demourgues, and M. F. Montemor,Electrochim. Acta, 240, 323 (2017).
14. C. Delmas, C. Faure, and Y. Borthomieu,Mater. Sci. Eng. B, 13, 89 (1992). 15. R. D. Armstrong and E. A. Charles,J. Power Sources, 27, 15 (1989).
16. H. M. French, M. J. Henderson, A. R. Hillman, and E. Vieil,J. Electroanal. Chem., 500, 192 (2001).
17. C. Taviot-Guého et al.,Chem. Mater., 28, 7793 (2016).
18. M. Wehrens-Dijksma and P. H. L. Notten,Electrochim. Acta, 51, 3609 (2006). 19. P. Bernard, C. Gabrielli, M. Keddam, and H. Takenouti,Electrochim. Acta, 36, 743
(1991).
20. G. T. Cheek and W. E. O’Grady,J. Electroanal. Chem., 421, 173 (1997). 21. Y. Mo, E. Hwang, and D. A. Scherson,J. Electrochem. Soc., 143, 5 (1996). 22. S. I. Cordoba-Torresi, A. A. Hugot-Le Gaff, and S. Joiret,J. Electrochem. Soc.,
138, 1554 (1991).
23. G. Feuillade and R. Jacoud,Electrochim. Acta, 14, 1297 (1969).
Figure 4. Schematic representation of the processes occurring during oxidation of NixCo1−x(OH)2in Na2SO40.05 M.
24. V. Srinivasan, B. C. Cornilsen, and J. W. Weidner,J. Solid State Electrochem., 9, 61 (2005).
25. V. Srinivasan, J. W. Weidner, and R. E. White,J. Solid State Electrochem., 4, 367 (2000).
26. P. L. Bourgault and B. E. Conway,Can. J. Chem., 38, 1557 (1960).
27. G. A. Snook, N. W. Duffy, and A. G. Pandolfo,J. Electrochem. Soc., 155, A262 (2008).
28. K. P. Ta,J. Electrochem. Soc., 145, 3860 (1998). 29. K. P. Ta,J. Electrochem. Soc., 146, 2769 (1999).
30. K.-W. Nam and K.-B. Kim,J. Electrochem. Soc., 149, A346 (2002).
31. W. O’Grady, K. Pandya, K. Swider, and D. Corrigan,J. Electrochem. Soc., 143, 1613 (1996).
32. J. Desilvestro, D. A. Corrigan, and M. J. Weaver,J. Electrochem. Soc., 135, 885 (1988).
33. R. Kostecki and F. McLarnon,J. Electrochem. Soc., 144, 485 (1997). 34. D. A. Corrigan and S. L. Knight,J. Electrochem. Soc., 136, 613 (1989). 35. Y. Zhang, X. Cao, H. Yuan, W. Zhang, and Z. Zhou,Int. J. Hydrogen Energy, 24,
529 (1999).
36. P. Kurzweil and M. Shamonin,Batteries, 4, 35 (2018). 37. I. A. Newman,Plant, Cell Environ., 24, 1 (2001).
38. M. Marenzana, A. M. Shipley, P. Squitiero, J. G. Kunkel, and A. Rubinacci,Bone, 37, 545 (2005).
39. A. Alvarez-Pampliega, M. G. Taryba, K. V. D. Bergh, J. D. Strycker, S. V. Lamaka, and H. Terryn,Electrochim. Acta, 102, 319 (2013).
40. M. Taryba, S. V. Lamaka, D. Snihirova, M. G. S. Ferreira, M. F. Montemor, W. K. Wijting, S. Toews, and G. Grundmeier,Electrochim. Acta, 56, 4475 (2011). 41. A. C. Bastos, O. V. Karavai, M. L. Zheludkevich, K. A. Yasakau, and M. G.
S. Ferreira,Electroanalysis, 22, 2009 (2010).
42. K. Ogle, S. Morel, and D. Jacquet,J. Electrochem. Soc., 153, B1 (2006). 43. J. Izquierdo, L. Nagy, A. Varga, J. J. Santanta, G. Nagy, R. M. Souto, and
P. Tudományegyetem,Electrochim. Acta, 56, 8846 (2011). 44. M. F. Montemor et al.,Electrochim. Acta, 60, 31 (2012). 45. H. Ding and L. H. Hihara,J. Electrochem. Soc., 152, B161 (2005).
46. E. A. Zdrachek, A. G. Karotkaya, V. A. Nazarov, K. A. Andronchyk, L. S. Stanishevskii, V. V. Egorov, M. G. Taryba, D. Snihirova, M. Kopylovich, and S. V. Lamaka,Sensors Actuators, B Chem., 207, 967 (2015).
47. V. A. Nazarov, M. G. Taryba, E. A. Zdrachek, K. A. Andronchyk, V. V. Egorov, and S. V. Lamaka,J. Electroanal. Chem., 706, 13 (2013).
48. S. V. Lamaka, R. M. Souto, and M. G. S. Ferreira, In-Situ Visualization of Local Corrosion by Scanning Ion-Selective Electrode Technique (SIET)—Chapter in Microscopy: Science, Technology, Applications and Education., ed. A. Méndez-Vilas and J. Díaz (Formatex Research Centre, Spain) p. 2162 (2010).
49. S. V. Lamaka, M. Taryba, M. F. Montemor, H. S. Isaacs, and M. G. S. Ferreira, Electrochem. Commun., 13, 20 (2011).
50. T. Nguyen, M. Boudard, M. J. Carmezim, and M. F. Montemor,Sci. Rep., 7, 39980 (2017).
51. C. Delmas and Y. Borthomieu,J. Solid State Chem., 104, 345 (1993). 52. P. Oliva, J. Leonardi, J. F. Laurent, C. Delmas, J. J. Braconnier, M. Fligarz,
F. Fievet, and A.d. Guilbert,J. Power Sources, 8, 229 (1982).
53. M. C. Bernard, P. Bernard, M. Keddam, S. Senyarich, and H. Takenouti, Electrochim. Acta, 41, 91 (1996).
54. H. M. French, M. J. Henderson, A. R. Hillman, and E. Vieil,Solid State Ionics, 150, 27 (2002).
55. S. Il Pyun, K. H. Kim, and J. N. Han,J. Power Sources, 91, 92 (2000). 56. Min-Seuk Kim and K.-B. Kim,J. Electrochem. Soc., 144, 1537 (1997). 57. U. Schröder, K. B. Oldham, J. C. Myland, P. J. Mahon, and F. Scholz,J. Solid State
Electrochem., 4, 314 (2000).
58. P. J. Tsai and S. L. I. Chan,Nickel-Based Batteries: Materials and Chemistry (Woodhead Publishing Limited, United Kingdom) p. 309 (2013)978-1-84569-784-6.
59. S. Motupally,J. Electrochem. Soc., 142, 1401 (1995).
60. R. Etchenique and E. J. Calvo,J. Electrochem. Soc., 148, A361 (2001). 61. J. W. Lee, J. N. Han, M. Seo, and S. Il Pyun,J. Solid State Electrochem., 5, 459
(2001).
62. M. Gonsalves and A. R. Hillman,J. Electroanal. Chem., 454, 183 (1998). 63. M. Aia,J. Electrochem. Soc., 114, 418 (1967).
64. B. C. Cornilsen, X. Shan, and P. L. Loyselle,J. Power Sources, 29, 453 (1990). 65. R. D. Armstrong, G. W. D. Briggs, and E. A. Charles,J. Appl. Ele, 18, 215 (1988). 66. C.-C. Hu, K.-H. Chang, and T.-Y. Hsu,J. Electrochem. Soc., 155, F196 (2008). 67. P. K. Nayak and N. Munichandraiah,J. Electrochem. Soc., 155, A855 (2008). 68. M. Butel, L. Gautier, and C. Delmas,Solid State Ionics, 122, 271 (1999).