HAL Id: hal-02144444
https://hal.archives-ouvertes.fr/hal-02144444
Submitted on 9 Nov 2020HAL is a multi-disciplinary open access archive for the deposit and dissemination of sci-entific research documents, whether they are pub-lished or not. The documents may come from teaching and research institutions in France or abroad, or from public or private research centers.
L’archive ouverte pluridisciplinaire HAL, est destinée au dépôt et à la diffusion de documents scientifiques de niveau recherche, publiés ou non, émanant des établissements d’enseignement et de recherche français ou étrangers, des laboratoires publics ou privés.
Zn 0.35 Co 0.65 O – A Stable and Highly Active Oxygen
Evolution Catalyst Formed by Zinc Leaching and
Tetrahedral Coordinated Cobalt in Wurtzite Structure
Sebastian Wahl, Sayed El-refaei, Ana Guilherme Buzanich, Patrick Amsalem,
Kug-seung Lee, Norbert Koch, Marie-Liesse Doublet, Nicola Pinna
To cite this version:
Sebastian Wahl, Sayed El-refaei, Ana Guilherme Buzanich, Patrick Amsalem, Kug-seung Lee, et al.. Zn 0.35 Co 0.65 O – A Stable and Highly Active Oxygen Evolution Catalyst Formed by Zinc Leaching and Tetrahedral Coordinated Cobalt in Wurtzite Structure. Advanced Energy Materials, Wiley-VCH Verlag, 2019, 9 (20), pp.1900328. �10.1002/aenm.201900328�. �hal-02144444�
1
Zn0.35Co0.65O - A Stable and Highly Active Oxygen Evolution Catalyst Formed by Zinc Leaching and
Tetrahedral Coordinated Cobalt in Wurtzite Structure
Sebastian Wahl,a Sayed M. El-Refaei,a Ana Guilherme Buzanich,b Patrick Amsalem,c Kug-Seung Lee,d Norbert, Koch,c Marie-Liesse Doublete,f, Nicola Pinnaa,*
Affiliation a
Institut für Chemie and IRIS Adlershof, Humboldt-Universität zu Berlin, Brook-Taylor-Strasse
2, 12489 Berlin, Germany
b
Bundesanstalt für Materialforschung und -prüfung (BAM), Richard-Willstätter-Straße 11,
12489 Berlin, Germany
c
Institut für Physik and IRIS Adlershof, Humboldt-Universität zu Berlin, Brook-Taylor-Strasse
6, 12489 Berlin, Germany
d
Beamline Department, Pohang Accelerator Laboratory, Republic of Korea
e
Institut Charles Gerhardt, CNRS UMR5253, Université Montpellier, Place Eugène Bataillon,
34095 Montpellier, France
f
Réseau Français sur le Stockage Electrochimique de l’Energie-RS2E, FR3459 Amiens, France
* Corresponding author email address: nicola.pinna@hu-berlin.de
Keywords
2
Abstract
To arrive to sustainable hydrogen-based energy solutions, the understanding of water-splitting
catalysts plays the most crucial role. Herein, we combined state-of-the-art hypotheses on
electrocatalytic active metal sites towards the oxygen evolution reaction (OER) to develop a
highly efficient catalyst based on earth-abundant cobalt and zinc oxides. The precursor catalyst
Zn0.35Co0.65O was synthesized via a fast microwave-assisted approach at low temperatures.
Subsequent, it transformed in situ from the Wurtzite structure to the layered γ-Co(O)OH, while
most of its zinc leaches out. This material shows outstanding catalytic performance and stability
towards the OER in 1 M KOH (overpotential at 10 mA cm-2 ηinitial = 306 mV, η98 h = 318 mV). By
comparing the electrochemical results and ex situ analyses to today’s literature, we were able to
identify clear structure-activity correlations. Our findings suggest that coordinately unsaturated
cobalt octahedra on the surface are indeed the active centers for the OER.
1. Introduction
In 2015, the United Nations (UN) set 17 sustainable development goals (SDGs) to be reached by
2030. Goal 7, affordable and clean energy, wants to “Ensure access to affordable, reliable,
sustainable and modern energy for all.” One target is to “increase substantially the share of renewable energy in the global energy mix”.[1]
One approach to reach this target, is the storage of
excess solar and wind energy in chemical bonding, especially in the hydrogen-hydrogen bond.[2,
3]
The water splitting reaction, forming 2 H2 and O2 from 2 H2O, is based on a 4 electron transfer
mechanism from oxygen to hydrogen. The reaction is hindered by the half-cell reaction at the
anode, the OER, which takes place at a theoretical potential of 1.23 V at standard conditions.[4]
Benchmarking papers as the ones by Jaramillo et al. show periodically the best oxygen evolution
catalysts (OEC).[5-7] Among those, scarce and rare ruthenium and iridium oxides are still the best
3
elements are registered in those benchmarks. By focusing on developing efficient water oxidation
catalysts based on available metals like cobalt, nickel, manganese and iron, we come step by step
closer to a large-scale realization of a circular energy economy based on hydrogen.[8]
For cobalt-based systems, it is now proven that the active site involved in the OER is based on
two or more redox-active cobalt atoms changing their oxidation states from +II to +IV and back.
Those are connected by µ-OH or µ-O bridges.[9, 10] A structure widely known to provide those
motifs is cobalt oxyhydroxide Co(O)OH.[11-13] Pfrommer et al. have shown, that a crystalline
cobalt substituted zinc oxide can yield a stable OEC in alkaline electrolyte with enhanced
activity, which is on the one hand based on the amorphization of the surface and the formation of
Co(O)OH.[14] On the other hand, they agreed to the findings of others, that the presence of
redox-inert Zn2+ is “rendering structural support and/or providing cooperative effects” for the
catalytically active cobalt.[15, 16] Though, what was not yet discussed there, was the
dissolution/leaching of zinc from the solid materials to the solution, which is expected at the
elevated pH values in those studies.[17-19] Correlating the leaching of Zn2+ into the electrolyte with
an enhanced OER activity was done first, to our knowledge, by Menezes et al.[13] They examined
cobalt containing spinels towards their OER activities and showed that partly leaching of Zn2+
from the tetrahedral sites leads to defective sites and thus increases the activity of the remaining
cobalt in the octahedral sites of the spinel. Contrary to the hypothesis formed by the latter, Wang
et al. studied the same system and stated, that Co2+ in tetrahedral sites can be easily oxidized and
form Co(O)OH, which then acts as the active phase, whilst Co3+ in the octahedral sites is rather
inactive towards the OER as it might be blocked by OH-groups.[20]
From this two opposing yet properly elaborated works, we got inspired to craft a material that
4
tetrahedral coordinated cobalt, preferably in oxidation state +II, and in addition hold a sufficient
amount of Zn2+ to be leached into the solution, leaving highly defective structures. In addition to
the increase of the intrinsic activity, the material also should have a large number of accessible active sites. Inspired by Huang et al., who showed, that γ-Co(O)OH nanosheets outperform the
bulk oxyhydroxide catalyst manifold and even overcome the IrO2 catalyst, our material should
exhibit also an exfoliated layered morphology.[21]
Based on our expertise on the nonhydrolytic sol-gel synthesis of transition metal oxides,
particularly cobalt and zinc based, in this work we focus on the synthesis of hexagonal
Zn-stabilized CoIIO in the Wurtzite structure. This combines all of the aforementioned properties.
[22-26]
The synthesis involves a fast microwave-assisted solvothermal reaction of cobalt(III)
acetylacetonate and zinc(II) acetate in benzyl alcohol. We analyzed the as-synthesized product
thoroughly by high resolution transmission electron microscopy (HRTEM), powder X-ray
diffraction (pXRD), X-ray photoelectron spectroscopy (XPS) and X-ray absorption spectroscopy
(XAS). We identified the changes the sample underwent by contact with the alkaline medium by
HRTEM and pXRD, and validated the findings against the available literature. Then, we
characterized the catalytic performance of the in situ formed catalyst towards the OER by
electrochemical measurements and finally derived structure/activity correlation from ex
situ-studies.
By following this approach, we are able to provide a comprehensive study of one of the most
active catalysts for the OER. The formed catalyst was able to maintain an overpotential η of less
5
2. Results and Discussion
2.1. Characterization of Zn0.35Co0.65O precatalyst
Zinc doped hexagonal cobalt oxide was synthesized by the microwave-assisted “benzyl alcohol route”. This was achieved by using cobalt(III) acetylacetonate and zinc acetate as metal
precursors and benzyl alcohol as oxygen source, solvent, reducing and surface stabilizing
agent.[24, 27, 28] After 20 min at 210 °C, the sample was washed with ethanol, solid products were
collected by centrifugation and the sample was dried in an oven at 70 °C overnight. A dark green
powdered product, denoted as Zn0.35Co0.65O, was obtained.
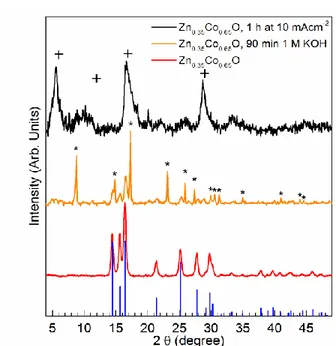
The crystal structure was identified by pXRD. Only typical reflections of the hexagonal Wurtzite
structure (ICSD PDF-number 01-074-0534)[29] were present in the pattern in Figure 1. Shifts in
the positions of the reflections are not expected, since the ionic radii for Co2+ and Zn2+ are very
similar (57 vs. 60 pm) and cobalt replaces the zinc in the structure.[30, 31]
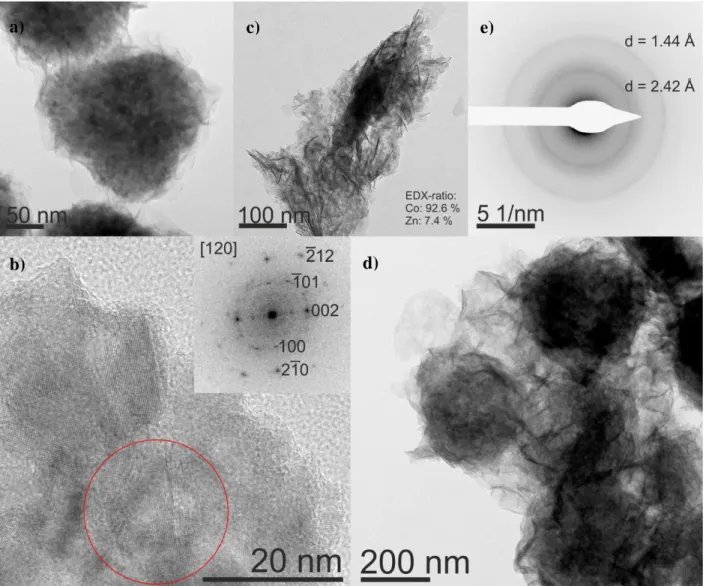
HRTEM analysis shows agglomerates of sheets that form spheres of different sizes (Figure 2 a).
This is in accordance to previous work of our group and proves the trend, that a higher amount of
cobalt directs the formation of spherical agglomerates.[22] Power spectra analysis of the HRTEM
(Figure 2 b) shows the crystallinity of the sample, which proves the hexagonal Wurtzite structure.
Energy dispersive X-ray spectroscopy (EDX) analysis yields a zinc to cobalt ratio of 0.35 to 0.65,
confirming the stoichiometric implementation of both metals in the material. EDX mapping (see
Figure SI-6) shows the uniform distribution of the metals in the assembly.
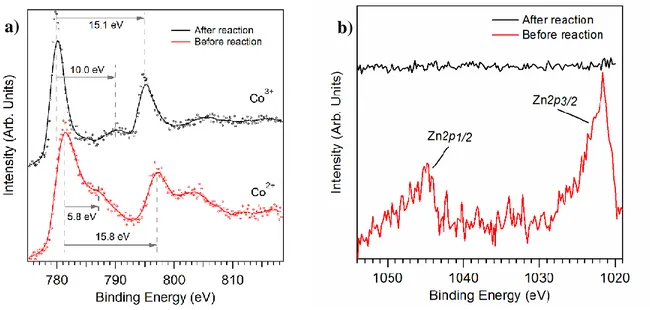
Insight in the oxidation state of the sample were gained by characterizing the chemical surface of
the sample by XPS (Figure 3). The Co2p3/2 peak is at 781 eV, with a shake-up satellite shifted by
6
compounds (see Figure SI-4 a) we can see clear difference to oxidation state +III, and from
similar spectra in literature, we reason the oxidation state of cobalt is +II.[32, 33]
Further information on the oxidation state and the local atomic environment of the cobalt were
provided by diffuse reflectance UV/Vis spectroscopy. The spectrum (Figure SI-3b) shows three
typical absorption features at 579, 623 and 678 nm, which correspond to the transitions 4A2(F) → 2
E(G), 4A2(F) → 4T1(P), and 4A2(F) → 2A1(G), respectively. Those are typical for Co2+ in
tetrahedral environment.[26, 34-36]
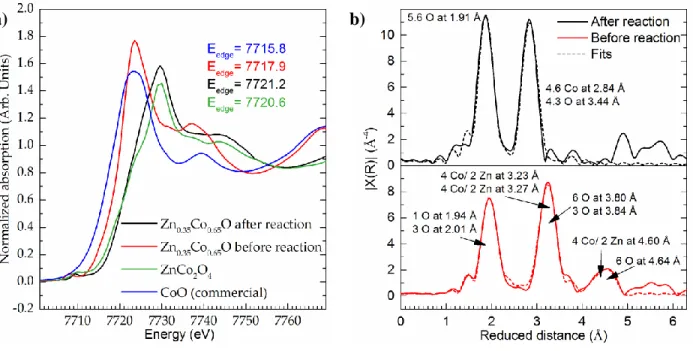
To access the oxidation state and the local atomic environment of cobalt X-ray absorption
spectroscopy (XAS) was used. In the X-ray absorption near-edge structure spectra (XANES,
Figure 4 a), the cobalt edge position in Zn0.35Co0.65O was compared to the references ZnCo2O4
and commercially available CoO in rock salt structure.[37] The predominant cobalt oxidation state
in the first reference is +III, and the edge position is 7720.6 eV (ZnCo2O4). In the second
reference, the predominant oxidation state is +II, and the edge position found is 7715.8 eV. The
edge position of Zn0.35Co0.65O is at 7717.9 eV. This observation leads us to conclude, that the
cobalt oxidation state in the material is less than +III, in comparison to the references. Since the
pre-edge features in the XANES spectra are very prone to changes in crystal field symmetry,
analysis of those also gives hints on the local structure of the absorbing atom. From the distinct
pre-edge peak in the spectrum of Zn0.35Co0.65O we deduce tetrahedral coordination of the central
cobalt atom. [38]
Furthermore, we fitted the Wurtzite crystal system to the extended X-ray absorption fine structure
(EXAFS) spectrum (R-range: 1.3 – 5.0, Figure 4 b), where cationic positions were filled by 65 %
Co2+ and 35 % Zn2+, derived from EDX results. The first shell around the cobalt central atom at a
7
3.2 Å of 6 atoms, which are cobalt and zinc in the ratio 2:1. Overlapping with the second shell,
the third shell at a distance of 3.8 Å holds 9 oxygen atoms. The signal assigned to the forth shell
at 4.5 to 4.6 Å is a summation of the signals of 2 zinc, 4 cobalt and 6 oxygen atoms, as well as a
multi-leg scattering part within the second and third shell. With a R-factor of 0.0086 for this fit,
we could further confirm the tetrahedral oxygen coordination of cobalt.[39, 40] From the above
mentioned analyses of the experimental data, we can safely conclude that in Zn0.35Co0.65O cobalt
is tetrahedrally coordinated and in oxidation state +II.
The homogeneity of the pre-catalyst material can be derived from the following considerations:
The pXRD (Figure 1) shows only one crystalline phase, and the HRTEM micrographs exhibited
only one morphology (Figure 2a). The EDX mapping (Figure SI-6) showed a uniform
distribution of Zn and Co over the whole sample, and the EXAFS fit (Figure 4b) shows that the
second shell consists of Zn and Co in the ratio of 1:2. Thus, the material can be described as a
one phase solid solution of Wurtzite (Co/Zn)O.
2.2. Characterization of the electrochemically active structure
When Zn0.35Co0.65O gets in contact with 1MKOH (pH =13.8), it instantaneously changes color
to a light brown. To figure out the origin of color change, we added some Zn0.35Co0.65O powder
to 1 M KOH and stirred the dispersion at room temperature for 90 min. Then, we washed the
sample with ethanol, collected the solid products by centrifugation, and dried it in an oven at
70 °C for 1 h. The pXRD-pattern in Figure 1 shows the typical reflections of hexagonal cobalt
hydroxide Co(OH)2 in Brucite-type layered structure (ICSD PDF-number 01-074-1057)[41] and of
hexagonal Wurtzite structure, leading to the conclusion, that the material is, at least at the surface,
transformed to Co(OH)2. The formation of Co(OH)2 is in agreement with the findings of Jang et
8
hydroxide in contact with water.[42] Though, it is to mention that the incorporated Zn2+ seems to
stabilize the structure and prevents a fast conversion. TEM micrographs of the sample show
platelets of around 50 nm in diameter with a thickness of around 4 nm (Figure 2c). The EDX
element ratio of cobalt to zinc is 92.6 to 7.4 %, respectively. This indicates a loss of Zn from the
structure, which is addressed in detail in the following section.
Electrocatalytic activity towards the OER was examined by rotating disk electrode (RDE)
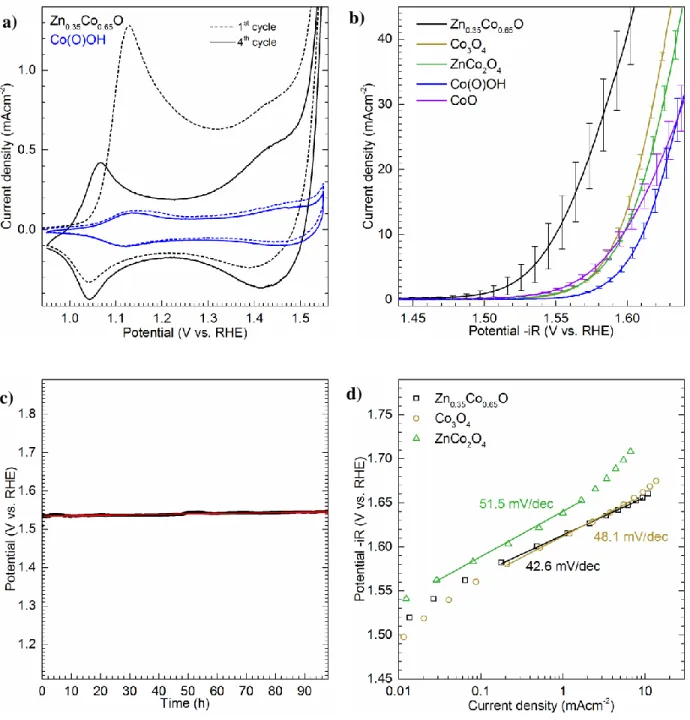
measurements in 1 MKOH at 1600 rpm. Figure 5 a shows the cyclic voltammograms (CV) of
Zn0.35Co0.65O in comparison to the reference Co(O)OH (CVs for other references can be found in
Figure SI-3a). In the first cycle of the CV, an intense oxidation peak at around 1.15 V is visible.
This can be attributed to the oxidation of Co2+ to Co3+, which is a further proof that the
as-prepared material being in oxidation state +II. Since there is no equally sized reduction peak, we
conclude an irreversible oxidation event. From the pXRD results we know that Co(OH)2 is
formed in situ. It has been described for other Co(OH)2 systems, that this peak can be attributed
to the irreversible oxidation of Co(OH)2 to the cobalt oxyhydroxide Co(O)OH.[43-45] In the 4th CV
cycle, 2 oxidation/reduction pairs are visible, slightly above 1.0 V and around 1.4 V. They can be
assigned to the reversible oxidation of Co2+/3+ and Co3+/4+, respectively. From the higher current
density of Zn0.35Co0.65O compared to the references, we conclude there are more accessible cobalt
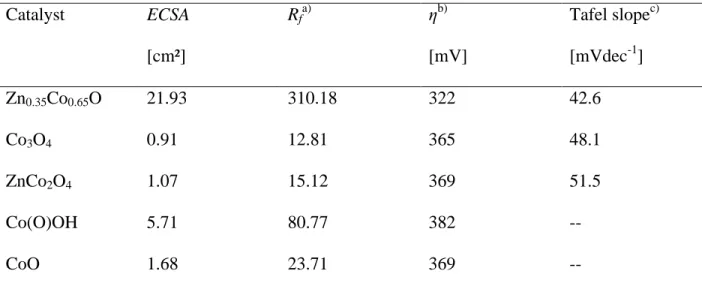
sites. To determine the electrochemically active surface area (ECSA), we used the method
described by McCrory and measured the double-layer capacitance (see Figure SI-2).[7] We found
that the ECSA was around 20-fold larger than for the reference catalysts. This is as well in very
good agreement with the TEM observation of exfoliated layered structures.
Monitoring the electrocatalytic performance of Zn0.35Co0.65O compared to other cobalt containing
9
measurements than the other catalysts. On the other hand, it has a significantly decreased average
overpotential η of 322 mV compared to 365 mV for Co3O4, 369 mV for ZnCo2O4 and CoO,
respectively, and 382 mV for Co(O)OH at a current density of 10 mA cm-2 (Figure 5 d). The high
activity is also reinforced by the low Tafel slope of 42.6 mV dec-1 (Table 1). Comparison of Tafel
slopes shows that all reactions take place in the same kinetic regime around 40 mV dec-1 within a
10 mV dec-1 window. The examined materials have the same rate-determining step in the region
where the Tafel slope was calculated. According to Shinagawa et al., the rate-determining step in
this Tafel region could be either assigned to a high coverage of the low-coordinated surface metal
centers by OH- species or to a high coverage of the surface with *OOH species.[46] Therefore, in
the present article the Tafel slopes are provided for comprehensiveness of the electrochemical
analyses, the in depth analysis of those is beyond the scope of this work.
To evaluate the long-term stability of the catalyst, we tracked the potential response in a
chronopotentiometric measurement at a current density of 10 mA cm-2 on an Au-electrode.
During 98 h, the potential increased linearly from 1.534 to 1.546 V vs. RHE, which corresponds
to an overpotential η of 306 to 318 mV. Linear fitting of the data resulted in a mean potential
increase of 0.12 mVh-1. By this, we were able to prove the long-term stability of our material
(Figure 5 c).
2.3. Characterization of the material after electrolysis
After 1 h electrochemical reaction at a current density of 10 mA cm-2, XPS measurements were
performed directly on the screen printed electrode (Figure 3). The peaks of Co2p3/2 and Co2p1/2
are shifted to lower binding energies of 779.9 eV and 795.0 eV, respectively. Also, the first
shake-up satellite is shifted by 10.0 eV towards lower energies (Figure 3a). From this, we deduce
10
Before the reaction the peaks for zinc were clearly observable, but after the reaction there is no
more signal (Figure 3b). In alkaline media, ZnO first reacts to the insoluble Zn(OH)2. With an
excess of hydroxide, the soluble [Zn(OH)4]2- complex is then formed.[19] This indicates the
leaching of Zn2+ from the surface during the reaction.
In the pXRD pattern (Figure 1), three main reflections are visible. At 2 θ angles of 5.57, 16.7 and
28.76 °, those reflections correspond to d-values of 7.3, 2.44 and 1.43 Å, respectively. Comparing
this values to the ones reported by Bardé et al., we can assign the reflections to the (003), (101) and (110) lattice planes of a slightly distorted γ-Co(O)OH.[48]
From the Bragg reflection
broadening, we derive a poor crystallinity of the oxyhydroxide. The asymmetric reflections of the
(101) and (110) indicate a turbostratic disorder of the basal planes.[49] The d-value of 7.3 Å of the
(003) lattice plane can be directly translated to the interlayer distance of the material.
The TEM micrograph of the sample after electrochemical characterization in Figure 2 (d) shows
the main motifs are still layers, agglomerated to spheres. In contrast to the original sample, those
layers are more exfoliated and the spheres are less separated from each other. Selected area
electron diffraction of a large area (Figure 2 (e) shows weak Debye-Scherrer rings corresponding
to interplanar distances of 2.42 and 1.44 Å, matching well the results of our pXRD analysis as
well as the TEM analysis by Huang et al.[21] Here, it is to mention, that the sample is
beam-sensitive, which is in agreement with the reported recrystallization of Ni(O)OH under an electron
beam (see SI for more information).[50]
In contrast to the XPS measurements, where no zinc was detected on the materials surface, in
EDX measurements 2.6 up to 6.5 atm.-% of zinc were detected (Table 2). Noteworthy, the
11
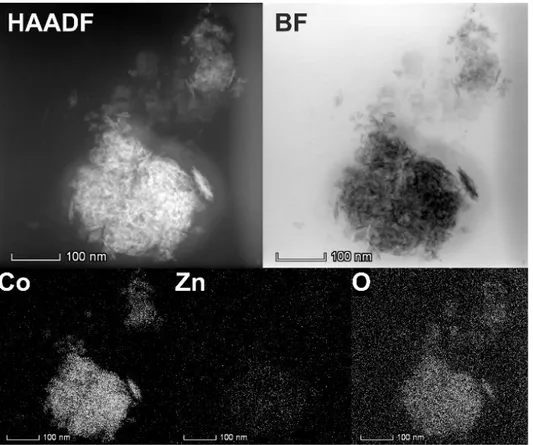
Analyzing the EDX mapping in figure 6, no such trend can be seen. Cobalt and oxygen are well
dispersed over the whole structure. Due to the low abundance of the zinc in the sample, there are
no areas detectable, where a position/zinc concentration correlation could be drawn. Only a
uniform distribution of zinc in the examined structure can be seen. The high angle annular dark
field (HAADF) micrograph in the same figure also shows the layered motifs as the bright field
image. Although the shown agglomerate has a width of around 200 nm, the low phase contrast all
over the agglomerate indicates a material of low density and high surface. A clear attribution of
areas with higher Zn or Co content is not possible in the HAADF, as the electron density of the
two elements is nearly the same.
From the XANES edge position at 7721.2 eV (Figure 4a), we deduce a predominant oxidation
state of +III or slightly above in the sample after the electrochemical reaction. The distinct
pre-edge feature indicates a non-symmetric geometry around the cobalt absorber. The EXAFS
spectrum in Figure 4b clearly differs from the one before the reaction. The spectrum was fitted in
the R-range from 1.0 to 3.5 Å by fixing the amplitude reduction factor S02 to a value determined
prior, as described by Ravel and Kelly.[51] Thus, the degeneracies of the Zn0.35Co0.65O after 1 h
electrochemical reaction could be obtained. For a single-scatterer, the degeneracy equals the
coordination number. The fit of the first three shells of Zn0.35Co0.65O after 1 h of electrochemical
reaction was based on the hexagonal Co(O)OH structure without any dopant. The first shell
around the absorbing Co-atom contains 5.6 O-atoms in a reduced distance of 1.91 Å. The second
shell consists of 4.6 Co-atoms in a distance of 2.84 Å. The third shell holds 4.3 O-atoms in a
distance of 3.44 Å. With an R-factor of 0.012, the fit indicates oxygen vacancies in the first shell
12
2.4. Structure-activity correlations
Detection of Co(OH)2 and Wurtzite crystal structures after 90 min in 1MKOH is in contrast to
the previously reported rapid total conversion of hexagonal CoO and points to a stabilizing
influence of Zn.[42] It further proves that Co(OH)2 is an important intermediate in the
electrochemical formation of γ-Co(O)OH.
To explain the high activity of Zn0.35Co0.65O towards the OER, structure factors can be compared
to reference-samples, thoroughly described in the literature. For all those samples, it is agreed
that the OER activity arises from adjacent Co(III-IV)O(H) groups connected by µ2-O-bridges.[10, 11, 52]
The leaching of Zn2+ in alkaline media leads to increased metal vacancies in the material, as
proven by the EXAFS analysis of the sample after electrochemical reaction. The second
coordination shell consists only of 4.6 metal atoms instead of 6.0. Comparable results were
published by Menezes et al, who analyzed the leaching of Zn2+ from the cubic spinel ZnCo2O4.[13]
They conclude, that by leaching of Zn2+, more octahedral Co3+ sites are accessible compared to
Co3O4, and that tetrahedral voids favor the restructuring of the surface. To compare Zn0.35Co0.65O
to their results, we synthesized ZnCo2O4. We also observed the dissolution of Zn2+ from the
spinel (see SI for detailed description), but in contrast to their work, we found the Zn2+
-containing spinel oxide performed worse than the Co3O4 reference. This finding is supported by
the work of Wang et al, that compared CoAl2O4, Co3O4 and ZnCo2O4 towards their OER
activity.[20] They concluded, that Co3+ fully coordinated by 6 O(H) groups is mostly inaccessible
for taking part in the OER. Our comparison to other cobalt oxides that are constructed of CoO6
building blocks, namely CoO in rock-salt structure and Co(O)OH, shows similar results. Their
activity is decreased compared to Co3O4 and Zn0.35Co0.65O. Further proof of this theory is also
13
than the other references, but the lowest OER activity. Thus, we deduct from our findings, that
solely a higher accessibility of CoO6 is not the reason for a high OER activity.
Instead, when starting from tetrahedral coordinated Co and transforming it to octahedral Co,
O-vacancies and coordinately unsaturated CoO(6-x)-motifs are introduced in the structure.[20] EXAFS
analysis shows, that the oxygen coordination number is decreased to 5.6 instead of 6.0 in the first
coordination shell. By this, as proven by density of states (DOS) studies by others on CoO(6-x)
-motifs on the surface of γ-Co(O)OH, the DOS near the Fermi level is increased. Thus, higher
conductivity is achieved, which favors the electron transport from the active site.[21] Nevertheless,
the extraction of Zn2+ from the surface also contributes to the change of the electronic structure.
Co and O undergo an oxidation process and arrive to a higher valence.[53, 54] Thus, the
electrophilicity of surface-O can increase, which leads to a faster adsorption of OH- to form the
*OOH species, which is the rate determining step, which is also in accordance to the calculated
Tafel slope. In addition to this, it is nowadays accept that a lower overpotential is correlated to a
higher adsorption stabilization energy of *OOH compared to *OH.[55-58] The remaining few
percent of Zn2+ in the structure play also an important role for the conductivity of the sample.
Ling et al. have recently shown, how 4-6 atm.-% of Zn in CoO can greatly enhance the ionic
diffusion and electronic conductivity though the material.[59] Another contribution to higher
conductivity might be also chemical bonding of the active material to the conducting support,
obtained by the in situ formation of the active phase.[16, 42] One more attribution to the increased
OER activity, beside the above mentioned intrinsic factors, is the overall higher number of
accessible cobalt sites.[60, 61] The accessibility of those cobalt sites is further raised by the slightly
14
3. Conclusion
The successful synthesis of Zn0.35Co0.65O can connect this work to previous studies of our group
on the field of cobalt-doped zinc oxides in Wurtzite structure by the non-hydrolytic benzyl
alcohol route.[22] Herein, we report a fast, easy and reproducible one-pot synthesis for a
zinc-stabilized cobalt oxide that, by its exfoliated morphology, acts as an excellent precursor catalyst
for the OER.
In an alkaline solution with an applied anodic potential, the material undergoes structural transformation to γ-Co(O)OH: Edge-sharing octahedra are formed and act as the active site. A
high defect concentration induced by the leaching of Zn2+ and the structural transformation eases
the accessibility of those active centers. Thus, an optimized energetic stabilization of the *OOH
species, whose formation is the rate determining step, is achieved. Furthermore, the number of
active sites is increased by the presence of exfoliated layers which provide a high surface area.
This leads to an exceptional activity for the OER, with an overpotential η of 306 mV at a current
density of 10 mA cm-2. During 98 h at the same current density, the overpotential just increased
by 12 mV, proving the stability of the in situ formed catalyst. Further works should focus on
different leaching agent and the optimal ratio of catalyst/leaching agent.
In summary, we could unify two contradicting hypotheses,[13, 20] and we experimentally derived
structure-activity correlations in a catalyst based solely on earth-abundant zinc and cobalt oxides.
Finally, by showing a high stability besides a high activity, our work possesses high potential to
15
4. Experimental
4.1. Materials
All reagents were used as received. Cobalt(III) acetylacetonate (98%) and cobalt(II) oxide
(99.995%, metal basis; denoted as commercial CoO) were purchased from ABCR GmbH
(Karlsruhe, Germany). 1 N potassium hydroxide solution was purchased from Carl Roth GmbH
(Karlsruhe, Germany). Benzyl alcohol (99%), Nafion perfluorinated resin solution (5 wt-%) and
zinc(II) acetate (99.99%) were purchased from Sigma Aldrich (Munich, Germany). Purified
water with resistivity 18.2 MΩcm−1 was used for sample preparation.
4.2. Syntheses
Co0.65Zn0.35O was synthesized by adding cobalt(III) acetylacetonate (71 mg, 0.2 mmol, 2 eq.) and
zinc acetate (18 mg , 0.1 mmol, 1 eq.) to benzyl alcohol (3 mL) in a 10 mL microwave reaction
vial. The reaction mixture was stirred at room temperature for 2 h, until all precursors were
dissolved. Subsequently, the mixture was heated in a microwave reactor (CEM Discover SP,
Kamp-Lintfort, Germany) at 60 °C for 2 min followed by 210 °C for 20 min, and cooled down
rapidly with compressed air. The solid product was collected by centrifugation, washed three
times with ethanol and dried overnight at 70 °C. Averaged over 6 reaction, the yield was 18.8 mg
of a dark green product (81.5 % yield on precursor’s stoichiometry).
Syntheses of the reference catalysts can be found in the supporting information.
4.3. Characterization
Powder X-Ray diffraction patterns were obtained using a STOE STADI MP (STOE, Darmstadt,
Germany) running at U = 40 kV and I = 40 mA with Mo Kα= 0.70930 Å) monochromatic
radiation (using a Ge(111) monochromator) and a DECTRIS "MYTHEN 1K" detector. The
16
High resolution transmission electron microscopy (HRTEM) images were obtained using a FEI
Talos F200S operated at 200 kV scanning/transmission electron microscope (S/TEM). Energy
dispersive X-ray spectra (EDX) and maps were recorded with build in SuperX EDS detector.
EDX spectra were analyzed using FEI TEM Imaging & Analysis software version 4.17 SP1.
EDX mappings were analyzed using FEI Velox software version 2.6 with the Schreiber-Wims
ionization cross-section model. The errors reported are taken from the reports generated by the
software.
The XANES and EXAFS measurements of the samples before electrochemical reaction were
performed at the BAMline (BESSY-II, Helmholtz Centre Berlin for Materials and Energy Berlin,
Germany). The beam was monochromatized using a double-crystal monochromator (DCM). The
size of the beam was 3 x 1 mm. The measurements were performed at Co-K edge (7709 eV) in
transmission geometry, with two ionization chambers as detectors. The excitation energy was
varied from 7614 eV to 8428 eV, with varying energy steps. For the pre-edge region, the energy
was varied in 10 eV steps; for the region around the edge, energy was tuned in 0.5 eV steps and
in the EXAFS region with a constant step in the k-space of 0.04 Å-1. The associated uncertainty
was experimentally determined by measuring the cobalt metal foil 10 times. A value of ±0.3 eV
was obtained. For the measurement, the samples were mixed with boron nitride and fixed in
plastic sample holders. Before collecting the sample spectra, a cobalt foil was used as a reference
for the cobalt edge. The relative energies of the spectra were calibrated to the first infliction point
of the cobalt metal absorption edge. XANES and EXAFS measurement of the sample after 1 h
electrochemical reaction on a gold screen printed electrode (DropSense 250AT, Metrohm,
Filderstadt, Germany) were measured at 8C nano-probe XAFS beamline (BL8C) of Pohang Light
Source (PLS-II) in the 3.0 GeV storage ring, with a ring current of 400 mA. The X-ray beam was
17
eliminate the higher-order harmonics. The x-ray beam was then delivered to a secondary source
aperture where the beam size was adjusted to be 0.5 mm (v) × 1 mm (h). XAFS spectra were
collected in fluorescence mode. To determine the edge energy, the integral-method was used.[37]
EXAFS data were processed by ATHENA and ARTEMIS from Demeter version 0.9.26.[39] This
GUIs program belongs to the main package IFEFFIT (v. 1.2.12).[62]
X-ray photoelectron spectroscopy (XPS) was performed in an ultrahigh vacuum chamber (base
pressure 5.10-10 mbar) using a JEOL JPS-9030 set-up comprising a hemispherical photoelectron spectrometer and a monochromatic Al Kα (hν = 1486.6 eV) X-ray source. The XPS
measurements were performed with an energy resolution of 0.7 eV as determined on a
polycrystalline Ag 3d core level.
4.4. Electrochemical analyses
Electrochemical analyses were performed using a Bio-Logic VMP3 multichannel potentiostat/
galvanostat with a built-in EIS analyzer. The electrochemical behavior and activity of catalysts
were measured in a three-electrode electrochemical cell using a 3 mm diameter glassy carbon
rotating disc electrode (RDE, Autolab RRDE, Metrohm, Filderstadt, Germany) operated at
1600 rpm at 25 °C. A platinum wire was used as the counter electrode and a reversible hydrogen
electrode (HydroFlex, gaskatel, Kassel, Germany) was used as a reference electrode. The
electrodes were prepared by drop casting 3 µL of a catalyst ink onto glassy carbon. The ink was
prepared by sonicating 1 mg catalyst powder with 490 µL ethanol, 490 µL purified water and
20 µL Nafion for 30 min.
The sample for the TEM and pXRD analyses was prepared by dropcasting an ethanolic
18
density of 10 mA cm-2, rinsing the foil with ethanol and scratching off the material. This was
repeated several times.
Long-term stability tests were performed on screen printed electrodes (DropSense 250AT,
Metrohm, Filderstadt, Germany) consisting of a gold working electrode with a diameter of 4 mm
and a platinum counter electrode. A reversible hydrogen electrode (HydroFlex, gaskatel, Kassel,
Germany) was used as the reference electrode. 2 µL of an ethanolic dispersion (5 mg/mL) of the
catalyst were dropcasted on the gold electrode and dried in an air stream. Then, the electrode was
placed in 150 mL of a 1MKOH solution at room temperature, a current of 1.257mA was applied
for 98 h (1 h for XPS measurement) and the potential was recorded every 0.5 s.
4.5. Electrocatalytically active surface area (ECSA)
The ECSA was determined by double-layer capacitance (Cdl) measurements in 1 M KOH.
Therefor, 5 cyclic voltammograms at each scan rate (10, 20, 30, 40, 50, 60, 80 and 100 mVs-1)
were measured in the non-Faradaic region, which is a 100 mV potential window around the open
circuit voltage of the system. For the last 4 cycles of each scan rate, the anodic and the cathodic
currents at the open circuit voltage were averaged and plotted versus the scan rate. By applying
linear fits to these and averaging the absolute slopes of the fits, Cdl is calculated. The ECSA is Cdl
divided by the general specific capacitance Cs, which is typically reported as 0.040 mFcm-2 in 1
Malkaline media. The origin of this value is discussed in depth in the supplementary information
of the 2013 benchmarking paper of Charles C. L. McCrory.[7] To calculate the roughness Rf, the
ECSA is divided by the geometric area of the electrode.
5. Acknowledgement
19
6. References
[1] United Nations, Resolution adopted by the General Assembly 2015.
[2] J. O. M. Bockris, Int. J. Hydrogen Energy 2002, 27, 731-740.
[3] Z. W. Seh, J. Kibsgaard, C. F. Dickens, I. Chorkendorff, J. K. Nørskov, T. F. Jaramillo,
Science 2017, 355, eaad4998.
[4] H. Dau, C. Limberg, T. Reier, M. Risch, S. Roggan, P. Strasser, ChemCatChem 2010, 2,
724-761.
[5] S. Jung, C. C. McCrory, I. M. Ferrer, J. C. Peters, T. F. Jaramillo, J. Mater. Chem. A 2016, 4,
3068-3076.
[6] C. C. McCrory, S. Jung, I. M. Ferrer, S. M. Chatman, J. C. Peters, T. F. Jaramillo, J. Am.
Chem. Soc. 2015, 137, 4347-4357.
[7] C. C. McCrory, S. Jung, J. C. Peters, T. F. Jaramillo, J. Am. Chem. Soc. 2013, 135,
16977-16987.
[8] L. Han, S. Dong, E. Wang, Adv. Mater. 2016, 28, 9266-9291.
[9] M. Risch, F. Ringleb, M. Kohlhoff, P. Bogdanoff, P. Chernev, I. Zaharieva, H. Dau, Energy
Environ. Sci. 2015, 8, 661-674.
[10] A. Bergmann, T. E. Jones, E. M. Moreno, D. Teschner, P. Chernev, M. Gliech, T. Reier, H.
Dau, P. Strasser, Nat. Catal. 2018, 1, 711.
[11] M. Zhang, M. De Respinis, H. Frei, Nat. Chem. 2014, 6, 362.
[12] L. Trotochaud, J. K. Ranney, K. N. Williams, S. W. Boettcher, J. Am. Chem. Soc. 2012, 134,
17253-17261.
[13] P. W. Menezes, A. Indra, A. Bergmann, P. Chernev, C. Walter, H. Dau, P. Strasser, M.
20
[14] J. Pfrommer, M. Lublow, A. Azarpira, C. Göbel, M. Lücke, A. Steigert, M. Pogrzeba, P. W.
Menezes, A. Fischer, T. Schedel‐Niedrig, Angew. Chem. 2014, 126, 5283-5287.
[15] X. Zou, A. Goswami, T. Asefa, J. Am. Chem. Soc. 2013, 135, 17242-17245.
[16] X. Liu, Z. Chang, L. Luo, T. Xu, X. Lei, J. Liu, X. Sun, Chem. Mater. 2014, 26, 1889-1895.
[17] J. Han, W. Qiu, W. Gao, J. Hazard. Mater. 2010, 178, 115-122.
[18] S.-W. Bian, I. A. Mudunkotuwa, T. Rupasinghe, V. H. Grassian, Langmuir 2011, 27,
6059-6068.
[19] G. Jander, E. Blasius, Lehrbuch der analytischen und praparativen anorganischen Chemie,
14 ed., S. Hirzel, Stuttgart, 1995.
[20] H.-Y. Wang, S.-F. Hung, H.-Y. Chen, T.-S. Chan, H. M. Chen, B. Liu, J. Am. Chem. Soc. 2015,
138, 36-39.
[21] J. Huang, J. Chen, T. Yao, J. He, S. Jiang, Z. Sun, Q. Liu, W. Cheng, F. Hu, Y. Jiang, Angew.
Chem. Int. Ed. 2015, 54, 8722-8727.
[22] X. Han, S. Wahl, P. A. Russo, N. Pinna, Nanomaterials 2018, 8, 249.
[23] N. Pinna, J. Mater. Chem. 2007, 17, 2769-2774.
[24] N. Pinna, M. Niederberger, Angew. Chem. Int. Ed. 2008, 47, 5292-5304.
[25] M. H. Oh, T. Yu, S.-H. Yu, B. Lim, K.-T. Ko, M.-G. Willinger, D.-H. Seo, B. H. Kim, M. G. Cho,
J.-H. Park, K. Kang, Y.-E. Sung, N. Pinna, T. Hyeon, Science 2013, 340, 964-968.
[26] G. Clavel, M.-G. Willinger, D. Zitoun, N. Pinna, Adv. Funct. Mater. 2007, 17, 3159-3169.
[27] I. Bilecka, I. Djerdj, M. Niederberger, Chem. Commun. 2008, 886-888.
[28] K. M. Nam, J. H. Shim, D.-W. Han, H. S. Kwon, Y.-M. Kang, Y. Li, H. Song, W. S. Seo, J. T.
21
[29] S. Abrahams, J. Bernstein, Acta Crystallogr. B 1969, 25, 1233-1236.
[30] R. T. Shannon, C. T. Prewitt, Acta Crystallogr. B 1969, 25, 925-946.
[31] R. t. Shannon, C. Prewitt, Acta Crystallogr. B 1970, 26, 1046-1048.
[32] J. Yang, H. Liu, W. N. Martens, R. L. Frost, J. Phys. Chem. C 2010, 114, 111-119.
[33] M. C. Biesinger, B. P. Payne, A. P. Grosvenor, L. W. M. Lau, A. R. Gerson, R. S. C. Smart,
Appl. Surf. Sci. 2011, 257, 2717-2730.
[34] J. Hays, K. Reddy, N. Graces, M. H. Engelhard, V. Shutthanandan, M. Luo, C. Xu, N. Giles,
C. Wang, S. Thevuthasan, Journal of Physics: Condensed Matter 2007, 19, 266203.
[35] D. A. Schwartz, N. S. Norberg, Q. P. Nguyen, J. M. Parker, D. R. Gamelin, J. Am. Chem.
Soc. 2003, 125, 13205-13218.
[36] H. A. Weakliem, J. Chem. Phys. 1962, 36, 2117-2140.
[37] H. Dau, P. Liebisch, M. Haumann, Analytical and Bioanalytical Chemistry 2003, 376,
562-583.
[38] T. E. Westre, P. Kennepohl, J. G. DeWitt, B. Hedman, K. O. Hodgson, E. I. Solomon, J. Am.
Chem. Soc. 1997, 119, 6297-6314.
[39] B. Ravel, M. Newville, J. Synchrotron Radiat 2005, 12, 537-541.
[40] S. Calvin, XAFS for Everyone, CRC press, 2013.
[41] W. Lotmar, W. Feitknecht, Kristallogr. Cryst. Mater 1936, 93, 368.
[42] K. Y. Jang, G. Park, K. H. Oh, J. H. Seo, K. M. Nam, Chem. Commun. 2017, 53, 4120-4123.
[43] M. S. Burke, M. G. Kast, L. Trotochaud, A. M. Smith, S. W. Boettcher, J. Am. Chem. Soc.
22
[44] R. D. L. Smith, M. S. Prévot, R. D. Fagan, S. Trudel, C. P. Berlinguette, J. Am. Chem. Soc.
2013, 135, 11580-11586.
[45] J. A. Koza, C. M. Hull, Y.-C. Liu, J. A. Switzer, Chem. Mater. 2013, 25, 1922-1926.
[46] T. Shinagawa, A. T. Garcia-Esparza, K. Takanabe, Scientific Reports 2015, 5, 13801.
[47] B. J. Tan, K. J. Klabunde, P. M. Sherwood, J. Am. Chem. Soc. 1991, 113, 855-861.
[48] F. Bardé, M.-R. Palacin, B. Beaudoin, A. Delahaye-Vidal, J.-M. Tarascon, Chem. Mater.
2004, 16, 299-306.
[49] M. Rajamathi, P. V. Kamath, R. Seshadri, Mater. Res. Bull. 2000, 35, 271-278.
[50] K. W. Kwan, D. Xie, R. Zhang, Z. Shan, A. H. Ngan, Phys. Status Solidi A 2018.
[51] B. Ravel, S. Kelly, in AIP Conference Proceedings, Vol. 882, AIP, 2007, pp. 150-152.
[52] M. Favaro, J. Yang, S. Nappini, E. Magnano, F. M. Toma, E. J. Crumlin, J. Yano, I. D. Sharp,
J. Am. Chem. Soc. 2017, 139, 8960-8970.
[53] L. Dahéron, R. Dedryvere, H. Martinez, M. Ménétrier, C. Denage, C. Delmas, D. Gonbeau,
Chem. Mater. 2007, 20, 583-590.
[54] S.-F. Hung, Y.-T. Chan, C.-C. Chang, M.-K. Tsai, Y.-F. Liao, N. Hiraoka, C.-S. Hsu, H. M.
Chen, J. Am. Chem. Soc. 2018, 140, 17263-17270.
[55] Z. Lu, H. Wang, D. Kong, K. Yan, P.-C. Hsu, G. Zheng, H. Yao, Z. Liang, X. Sun, Y. Cui, Nat.
Commun. 2014, 5, 4345.
[56] J. Suntivich, K. J. May, H. A. Gasteiger, J. B. Goodenough, Y. Shao-Horn, Science 2011,
334, 1383-1385.
23
[58] B. Zhang, X. Zheng, O. Voznyy, R. Comin, M. Bajdich, M. García-Melchor, L. Han, J. Xu, M.
Liu, L. Zheng, F. P. García de Arquer, C. T. Dinh, F. Fan, M. Yuan, E. Yassitepe, N. Chen, T.
Regier, P. Liu, Y. Li, P. De Luna, A. Janmohamed, H. L. Xin, H. Yang, A. Vojvodic, E. H.
Sargent, Science 2016, 352, 333-337.
[59] T. Ling, P. Da, X. Zheng, B. Ge, Z. Hu, M. Wu, X.-W. Du, W.-B. Hu, M. Jaroniec, S.-Z. Qiao,
Science Advances 2018, 4, eaau6261.
[60] W. T. Hong, M. Risch, K. A. Stoerzinger, A. Grimaud, J. Suntivich, Y. Shao-Horn, Energy
Environ. Sci. 2015, 8, 1404-1427.
[61] K. A. Stoerzinger, L. Qiao, M. D. Biegalski, Y. Shao-Horn, J. Phys. Chem. Lett. 2014, 5,
1636-1641.
[62] M. Newville, J. Synchrotron Radiat 2001, 8, 322-324.
24
7. Figures
Figure 1. pXRD patterns of as prepared Zn0.35Co0.65O (red), product after 90 min stirring in 1M
KOH (orange) and product collected after 1 h Chronopotentiometry at 10 mA cm-2. References
given are hexagonal Wurtzite structure (blue, ICSD PDF-number 01-074-0534), hexagonal
Co(OH)2 (asterisks, ICSD PDF-number 01-074-1057) and hexagonal γ-Co(O)OH (crosses, Barde
25
Figure 2. HRTEM micrographs of Zn0.35Co0.65O: Sample before the electrochemical reaction (a
and b). The sample consists of layers that agglomerates to form spheres of different sizes (a).
HR-micrograph of the edge of a sphere (b). The inset shows the power spectrum of the area selected
by the red circle. The spots can be assigned to a hexagonal Wurtzite structure aligned along the
[120] zone axis. The sample after 90 min in 1MKOH consists of platelets with a thickness
around 4 nm and a diameter of around 50 nm (c). The sample after 1 h electrochemical reaction at
a current density of 10 mA cm-2 (d and e). The main motifs are still layers agglomerated to
spheres, but more exfoliated and less separated than before (d). The SAED of c shows
diffractions that have d-spaces of 2.42 and 1.44 Å (e).
a) c) e)
d) b)
26
Figure 3. ex situ XPS on cobalt edge of Zn0.35Co0.65O sample before (red) and after (black)
electrochemical reaction: Before the reaction, the peak position and relative energy shifts on the
cobalt edge tend to an oxidation state of +II; after the reaction, the peak positions as well as the
chemical shift of the shake-up satellites lead to the conclusion the materials oxidation state has
changed to +III (a). On the zinc edge, the missing Zn peak after the reaction indicates the
leaching of Zn in the solution (b).
27
Figure 4. XAS on cobalt as absorbing atom; XANES spectra edge positions lie at 7720.6 eV
(ZnCo2O4), 7721.2 eV (Zn0.35Co0.65O after reaction) and 7717.9 eV (Zn0.35Co0.65O before
reaction. Commercially available CoO in rock salt structure was added as a reference for Co2+
(a). EXAFS spectra and fits of Zn0.35Co0.65O before and after 1 h in 1MKOH at a current density
of 10 mA cm-2. The fit of the spectrum before the reaction (R-range: 1.3 – 5.0 Å) is based on
hexagonal Wurtzite crystal structure. The fit of the spectrum after the reaction (R-range: 1.0 –
3.5 Å) is based on hexagonal Co(O)OH in layered Brucite structure.[33, 63] The insets show the
assigned surrounding atoms (b).
28
Figure 5. Cyclic voltammograms in 1MKOH at a scan rate of 20 mVs-1 showing initial and 4th
cycle of Zn0.35Co0.65O and Co(O)OH (a). Averaged LSVs in 1MKOH at a scan rate of 5 mVs-1
with error bars showing standard deviation: averaged overpotentials η towards the OER at 10 mA
cm-2 are 322 mV for Zn0.35Co0.65O, 365 mV for Co3O4, 369 mV for ZnCo2O4, 382 mV for
Co(O)OH and 369 mV for CoO (b). Variation of potential as function of time at a current density
of 10 mA cm-2 in 1MKOH on a gold screen-printed electrode. The potential at the beginning is
a) b)
29
1.534 V vs. RHE, which corresponds to an overpotential η = 306 mV. Fitting the potential
linearly, an increase of 0.12 mVh-1 can be reported (R2 = 0.86) (c). Averaged Tafel plots of
Zn0.35Co0.65O, Co3O4 and ZnCo2O4. The data were acquired in quasi-stationary conditions in 0.1
M KOH. Each potential was hold for 5 min, the current was averaged over this timeframe, and
30
Figure 6. STEM HAADF and bright field micrographs and EDX mapping of cobalt, zinc and
oxygen in Zn0.35Co0.65O after the reaction: The cobalt-zinc ratio after 1 h electrochemical reaction
31
8. Tables
Table 1. Comparison of electrochemical properties of different cobalt oxide based catalysts.
Catalyst ECSA [cm²] Rfa) ηb) [mV] Tafel slopec) [mVdec-1] Zn0.35Co0.65O 21.93 310.18 322 42.6 Co3O4 0.91 12.81 365 48.1 ZnCo2O4 1.07 15.12 369 51.5 Co(O)OH 5.71 80.77 382 -- CoO 1.68 23.71 369 -- a)
Roughness: ECSA divided by geometric area (7.069 mm-2); b)at 10mA cm-2 in 1MKOH;
c)
measured in 0.1MKOH under quasi-stationary conditions
Table 2. EDX Analysis of the Zn0.35Co0.65O before and after electrochemical reaction.
Sample Co atom% Zn atom%
before reaction 64.6 (±0.20) 35.3 (±0.17)
after reaction, bulk 94.5 (±0.14) 5.4 (±0.04)
32
9. TOC
Keyword: Structure-Property Relationships
The precursor catalyst Zn0.35Co0.65O is transformed in situ from
the Wurtzite structure to the layered γ-Co(O)OH, while most of
its zinc leaches out. This material shows outstanding catalytic
performance and stability towards the OER in 1 M KOH
(overpotential at 10 mA cm-2 ηinitial = 306 mV, η98 h = 318 mV),
based on coordinately unsaturated cobalt octahedra on the