Université de Montréal
Performance and health of dairy cows incompletely milked
during the first five days in milk
par Catarina KRUG
Département de pathologie et microbiologie Faculté de médecine vétérinaire
Thèse présentée à la Faculté de médecine vétérinaire en vue de l’obtention du grade de Philosophia Doctor (Ph. D.)
en sciences vétérinaires option épidémiologie
Juin, 2018
ii
RÉSUMÉ
Pendant la période de transition chez les vaches laitières, la demande énergétique pour initier la production de lait est très élevée, tandis que l’apport d’énergie est faible, ce qui crée inévitablement une balance énergétique négative. Ce déséquilibre physiologique constitue l'un des principaux facteurs de risque dans le développement de maladies de transition, et ensemble, ils peuvent influencer les performances reproductrices et augmenter le taux de réforme. De nouvelles stratégies, aidant les vaches laitières à supporter une production intensive, doivent donc être mises en place. Bien que des progrès remarquables aient été réalisés pour garantir un apport énergétique élevé, peu de recherches ont évalué la possibilité de contrôler les dépenses énergétiques. La traite incomplète des vaches en début de lactation pourrait aider à limiter le déséquilibre énergétique chez les vaches laitières.
L'objectif de ce projet était de mesurer l'impact, sur la santé et la production, d'une traite incomplète durant les cinq premiers jours en lait (JEL ; sans changer la fréquence de traite), sur les vaches de fermes laitières commerciales. Plus spécifiquement, les éléments suivants ont été évalués : la production de lait, le taux de réforme, l'incidence de maladies infectieuses, les performances reproductrices et la sensibilité au niveau du pis. Un essai contrôlé randomisé a été réalisé chez les vaches multipares provenant d’un échantillon de convenance de 13 fermes laitières. Dans chaque troupeau, toutes les vaches multipares (n = 878), ayant mis bas entre décembre 2013 et mars 2015, ont été aléatoirement réparties entre un groupe traitement et un groupe témoin, à l'aide d'un générateur de nombres aléatoires. Les vaches du groupe traitement ont été soumises à une traite incomplète durant les cinq premiers JEL, avec une collecte maximale de 10, 10, 10, 12 et 14 litres de lait par jour aux JEL un, deux, trois, quatre et cinq, respectivement. Les vaches du groupe témoin ont été traites de manière conventionnelle.
Le taux de réforme des vaches et la production de lait ne différaient pas entre les deux groupes. Lorsqu'on s'intéresse aux différences de rendement en termes de lait corrigé en énergie, les vaches traites incomplètement produisaient de façon similaire aux vaches traites complètement. La traite incomplète n'affectait pas les cotes de nouvelles infections intramammaires du 11 au 18ème JEL, ni les cotes de maladies du système reproducteur à 35 JEL, ni l'incidence de mammite clinique durant les 90 premiers JEL. Les cotes d'élimination
iii
d’une infection intramammaire du 11 au 18ème JEL chez les vaches traites incomplètement étaient 2,9 fois supérieures à celles des vaches traites complètement (intervalle de confiance à 95% : 1,4-6,0). La traite incomplète n'affectait pas non plus l'activité lutéale ; elle avait, cependant, un impact positif sur le risque de conception chez les vaches en deuxième lactation qui étaient dans des troupeaux avec une période d’attente volontaire inférieure à 55 jours (180/775 vaches). Chez ces vaches, le risque de conception (intervalle de confiance à 95%) pour les vaches traites incomplètement était 576,3 (240,0-1383,7), 36,9 (18,9-72,1), 6,8 (3,3-13,8), 2,5 (1,0-5,9), et 0,13 (0,07-0,26) fois celui des vaches traites normalement à 1-21, 22-43, 44-65, 66-87 et >87 jours respectivement après la période d'attente volontaire.
L'algomètre de pression a été validé pour mesurer des changements de sensibilité dus à une distension du pis. Cet instrument était modérément répétable pour quantifier le seuil nociceptif mécanique sur le pis et de nombreux facteurs externes influençaient également les valeurs obtenues. Par conséquent, son utilisation pour cet usage devrait être considéré avec prudence. Nous avons donc plutôt observé le comportement de repos pour évaluer une douleur éventuelle ressentie au niveau du pis des vaches traites de façon incomplète. Nous n'avons observé aucun effet sur le temps de repos. Cependant, l'impact de la traite incomplète sur la fréquence et la durée moyenne des phases de repos dépendait du nombre de lactations de la vache. Cette stratégie semble légèrement problématique pour les vaches de deuxième parité, mais potentiellement bénéfique pour les vaches plus âgées.
Mots-clés : vaches laitières, traite incomplète, taux de réforme, production de lait, mammite,
maladies du système reproducteur, activité lutéale, conception, nociception, algomètre, comportement de repos, accéléromètre
iv
ABSTRACT
During the transition period in dairy cows, energy demands for milk production are very high, while energy intake is low, leading to a physiologically unavoidable negative energy balance. Physiological imbalance or dysfunction appears to be one of the main factors leading to increased risk for transition diseases, and together, these problems have a great impact on subsequent reproductive performances and culling. This leads to the urgent need for alternative management strategies to help dairy cattle to cope with the intensive systems in which they are raised. Although there has been great improvements in managing the source of energy for the cow, little work has been done in controlling energy expenses to improve energy balance. An incomplete milking in early lactation could help limiting negative energy balance in dairy cattle.
The objective of this project was to measure, in a context of commercial dairy farms, the impact of an incomplete milking (without altering the milk frequency) during the first five days in milk (DIM), on performance and health. Specifically, the aims were to quantify its impact on: culling and milk production; on incidence of infectious diseases; on reproductive performance; and on udder sensitivity. A randomized controlled trial was conducted on multiparous cows from a convenient sample of 13 commercial dairy farms. In each herd, all multiparous cows (n = 878) calving between December 2013 and March 2015 were randomly allocated at the time of dry off to a treatment or a control group using a random number generator. Cows in the treatment group were milked incompletely during the first five DIM, with a maximum of 10, 10, 10, 12, and 14 L/d collected on DIM one, two, three, four and five, respectively. Cows in the control group were milked conventionally.
Culling hazard and milk yield did not differ among treatment groups. When investigating differences in energy corrected milk yield per week throughout the lactation, incompletely milked cows produced as much as conventionally milked cows during most weeks. Incomplete milking did not affect the odds of new intramammary infection from 11 to 18 DIM, the odds of reproductive tract disease at 35 DIM, or clinical mastitis incidence in the first 90 DIM. The odds of eliminating an existing intramammary infection from 11 to 18 DIM for incompletely milked cows were 2.9 (95% confidence interval: 1.4, 6.0) times those of conventionally milked cows. The incomplete milking protocol had no effect on postpartum luteal activity and it had a positive
v
impact on pregnancy hazard in second parity cows from herds with voluntary waiting period lower than 55 days (180/775 cows). The hazards of pregnancy (95% confidence interval) in incompletely milked cows were 576.3 (240.0, 1383.7), 36.9 (18.9, 72.1), 6.8 (3.3, 13.8), 2.5 (1.0, 5.9), and 0.13 (0.07, 0.26) times that of conventionally milked cows at 1-21, 22-43, 44-65, 66-87 and >87 d after voluntary waiting period, respectively in second parity cows from herds with voluntary waiting period lower than 55 days.
The pressure algometer was validated for measuring changes in udder sensitivity due to udder distension. The instrument was shown to be only moderately repeatable for quantifying mechanical nociceptive threshold on the udder and was influenced by extraneous covariates, therefore its use should be considered cautiously or it should be further developed. Consequently, to assess potential increased udder pain due to incomplete milking, we used the resting behavior data of incompletely and conventionally milked animals. There was no effect of incomplete milking on lying time. However, the effect of incomplete milking on frequency of lying bouts and on mean lying bout duration varied by parity level, suggesting that an incomplete milking may be slightly problematic for second parity cows and, possibly, slightly beneficial for older cows.
Keywords : dairy cattle, incomplete milking, culling, milk production, mastitis, reproductive
tract disease, luteal activity, pregnancy, nociception, algometer, resting behavior, accelerometer
vi
TABLE OF CONTENTS
RÉSUMÉ ... ii ABSTRACT ... iv TABLE OF CONTENTS ... vi LIST OF TABLES ... xiLIST OF FIGURES ... xiv
LIST OF ABBREVIATIONS ... xvii
ACKNOWLEDGEMENTS ... xx
CHAPTER 1: INTRODUCTION ... 21
Research objectives ... 23
CHAPTER 2: LITERATURE REVIEW ... 24
The life cycle of a cow ... 24
Physiology of lactation ... 27
Negative energy balance ... 29
Description ... 29
Measuring the negative energy balance ... 30
Consequences of severe negative energy balance ... 33
Increased risk for metabolic diseases ... 33
Increased risk for infectious diseases ... 34
Increased risk for reproductive tract disease ... 35
Increased risk for mastitis ... 38
Reduced reproductive performance ... 41
Reduced milk production, reduced longevity, and higher costs ... 43
Limiting the negative energy balance ... 45
Increasing source of energy ... 45
Reducing energy requirements in early lactation... 46
By temporarily reducing milk production through milk frequency ... 46
By temporarily reducing milk production through incomplete milking ... 49
vii
CHAPTER 3: A RANDOMIZED CONTROLLED TRIAL ON THE EFFECT OF INCOMPLETE MILKING DURING THE FIRST FIVE DAYS IN MILK ON CULLING
HAZARD AND ON MILK PRODUCTION AND COMPOSITION OF DAIRY COWS ... 52
Abstract ... 53
Introduction ... 54
Materials and methods ... 55
Sample size calculations ... 55
Herds and cows ... 55
Milk production and composition data ... 56
Data management and statistical analyses ... 57
Culling hazard ... 57
Milk production and composition ... 58
Results ... 59
Description of study population ... 59
Culling... 60
Milk weight ... 60
Fat and protein concentrations ... 61
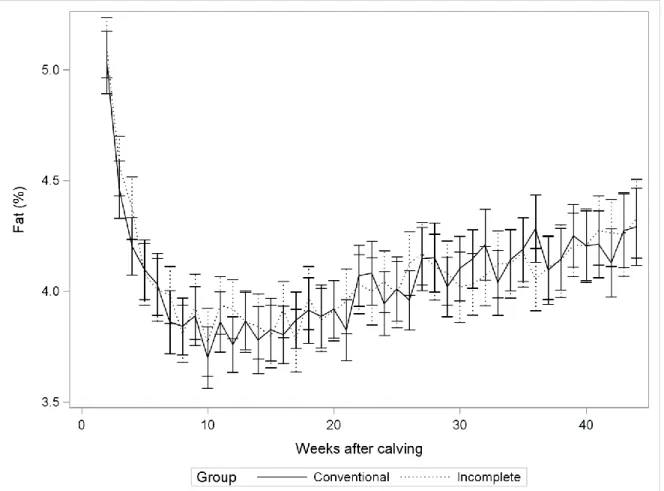
Fat ... 61
Protein ... 62
Energy corrected milk ... 62
Discussion ... 63
Conclusion ... 65
Acknowledgements ... 66
References ... 66
CHAPTER 4: EFFECT OF INCOMPLETE MILKING DURING THE FIRST FIVE DAYS IN MILK ON UDDER AND REPRODUCTIVE TRACT HEALTH: RESULTS FROM A RANDOMIZED CONTROLLED TRIAL ... 77
Abstract ... 78
Introduction ... 79
viii
Sample size calculations ... 80
Herds, animals and experimental design ... 80
Samples and animal measurements ... 81
Udder health ... 81
Reproductive tract health ... 82
Data management and statistical analyses ... 83
Udder health ... 83
Reproductive tract health ... 85
Adjustment for misclassification bias ... 86
Udder health bias adjustment ... 86
Reproductive tract health bias adjustment ... 86
Results ... 87
Description of study population ... 87
Udder health ... 87
Reproductive tract health ... 88
Adjustment for misclassification bias ... 88
Discussion ... 89
Conclusion ... 92
Acknowledgements ... 92
References ... 92
CHAPTER 5: A RANDOMIZED CONTROLLED TRIAL ON THE EFFECT OF INCOMPLETE MILKING DURING THE FIRST FIVE DAYS IN MILK ON REPRODUCTIVE PERFORMANCE OF DAIRY COWS ... 106
Abstract ... 107
Introduction ... 108
Materials and methods ... 109
Sample size calculations ... 109
Herds, animals and experimental design ... 110
Samples and data collection ... 111
ix
Luteal activity ... 111
Time to pregnancy ... 112
Potential effect modifiers ... 112
Data management and statistical analyses ... 113
The impact of incomplete milking on reproductive performance ... 113
The impact of early lactation hyperketonemia on reproductive performance ... 115
Results ... 115
The impact of incomplete milking on reproductive performance ... 116
Luteal activity ... 116
Time to pregnancy ... 116
The impact of early lactation hyperketonemia on reproductive performance ... 117
Discussion ... 117
Conclusion ... 120
Acknowledgements ... 120
References ... 121
CHAPTER 6: ALGOMETER PRECISION FOR QUANTIFYING MECHANICAL NOCICEPTIVE THRESHOLD WHEN APPLIED TO THE UDDER OF LACTATING DAIRY COWS 133 Abstract ... 134
Introduction ... 134
Materials and methods ... 135
Algometer measurements... 135
Definition of terms ... 137
Statistical analyses ... 137
Reliability ... 137
Relationship between algometer measure and covariates ... 139
Sample size calculation ... 140
Results ... 140
Reliability ... 140
x
Discussion ... 142
Acknowledgements ... 146
Author contributions statement ... 146
Conflict of interest ... 146
References ... 146
CHAPTER 7: INCOMPLETE MILKING IN EARLY LACTATION DOES NOT AFFECT DAIRY COWS RESTING BEHAVIORS: RESULTS FROM A RANDOMIZED CONTROLLED TRIAL ... 157
Abstract ... 158
Introduction ... 158
Materials and methods ... 159
Sample size estimation/Power ... 159
Animals and treatments... 160
Animal-based measures ... 161
Data management and statistical analyses ... 161
Results ... 163 Discussion ... 164 Ethics statement ... 166 Author contributions ... 166 Acknowledgements ... 167 References ... 167
CHAPTER 8: GENERAL DISCUSSION ... 179
Main findings ... 179
Study limitations ... 186
Suggestions for future research ... 190
CHAPTER 9: GENERAL CONCLUSIONS ... 194
xi
LIST OF TABLES
Table I. The impact of hyperketonemia on clinical mastitis and on high somatic cell counts ………41
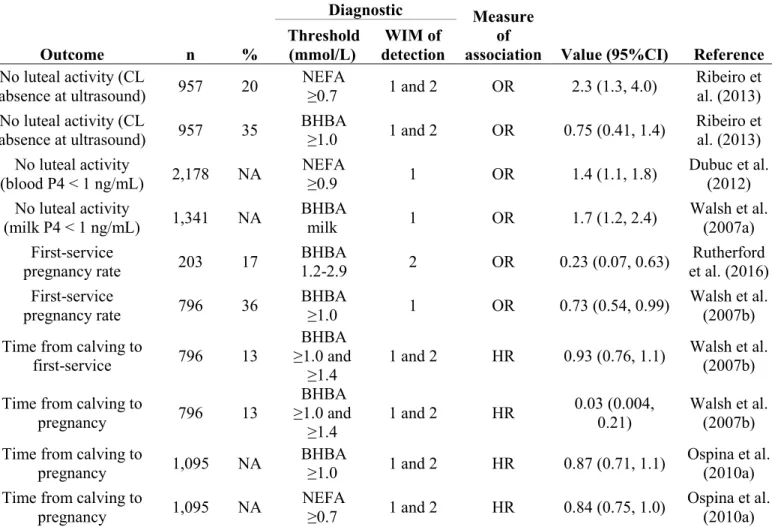
Table II. The impact of high non-esterified fatty acids and of hyperketonemia on reproductive performance ... 43
Table III. Comparison between serum metabolites and milk yield and composition obtained in different studies interested in altering milking frequency in early lactation as a strategy to limit negative energy balance ... 48
Table IV. Structure of the dataset used for investigating the effect of incomplete milking during the early lactation on milk weight. Data obtained from a randomized controlled trial conducted on 846 cow-lactations from 13 commercial dairies ... 69
Table V. Structure of the dataset used for investigating the effect of incomplete milking during the early lactation on milk protein and fat concentrations. Data obtained from a randomized controlled trial conducted on 846 cow-lactations from 13 commercial dairies .... 70
Table VI. Structure of the dataset used for investigating the effect of incomplete milking during the early lactation on energy corrected milk. Data obtained from a randomized controlled trial conducted on 846 cow-lactations from 13 commercial dairies ... 71
Table VII. Sample size/power calculations for evaluating the impact of an incomplete milking during the first five days in milk on udder and reproductive tract health using a 95% confidence level and 80% power ... 98
Table VIII. Structure of the dataset for evaluating the impact of an incomplete milking during the first five days in milk on intramammary infection incidence and eliminationa ... 99
Table IX. Results obtained from a randomized controlled trial (853 cows, 13 herds) on the association between an incomplete milking during the first five days in milk and udder and reproductive tract health ... 100
Table X. Description of the 13 participating farms regarding udder health ... 101
Table XI. Cross-classified test results for reproductive tract health from purulent vaginal discharge, leukocyte esterase test, and endometrial cytology ... 102
xii
Table XII. Mean and 95% credibility interval for the sensitivity and specificity of three tests for detection of reproductive tract disease in dairy cows, obtained using a Bayesian latent class model comparing three tests in one population ... 103
Table XIII. Median time between end of voluntary waiting period and pregnancy (in days) by breeding cycle and by treatment, parity levels and herd’s voluntary waiting period. Values were calculated using data from 853 multiparous Holstein cows from 13 herds participating in a randomized controlled trial evaluating the effects of an incomplete milking during the first five days in milk compared to conventional milking... 127
Table XIV. Results from the final Cox proportional hazard model on the effect of an incomplete milking during the first five days in milk on time from the end of the herd’s voluntary waiting period to pregnancya ... 128
Table XV. Estimated pregnancy hazard ratios (95% confidence interval) between incompletely milked cows and conventionally milked cows stratified by voluntary waiting period, parity and by breeding cycle perioda ... 129
Table XVI. Number of cows, proportion of cows presenting luteal activity, proportion of pregnant cows and median days from calving to pregnancy by early lactation hyperketonemia levels. Values were calculated using data from 638 multiparous Holstein cows from 13 herds participating in a randomized controlled trial evaluating the effects of an incomplete milking during the first five days in milk compared to conventional milking ... 130
Table XVII. Unconditional associations between predictors and odds of reacting to the algometer (reaction vs. no reaction) and between predictors and mechanical nociceptive threshold (in kg; for cows reacting to the algometer). Data generated from an observational study conducted on 36 dairy cows from a teaching farm. Estimates were obtained using logistic (n = 860 observations) and linear (n = 420 observations) mixed regression models accounting for clustering by day and by cow... 155
Table XVIII. Conditional association between predictors and daily duration of lying down (h/d) from 32 dairy cows (two commercial herds) enrolled in a randomized controlled trial; estimates were obtained using linear mixed regression models ... 170
Table XIX. Conditional association between predictors and lying bout frequency (bouts / d) from 32 dairy cows (two commercial herds) enrolled in a randomized controlled trial; estimates were obtained using linear mixed regression models ... 172
xiii
Table XX. Conditional association between predictors and mean lying bout duration (min/bout) from 32 dairy cows (two commercial herds) enrolled in a randomized controlled trial; estimates were obtained using linear mixed regression models ... 174
xiv
LIST OF FIGURES
Figure 1. Phases of the lactation cycle with corresponding changes in milk yield, dry matter intake and body weight ... 25
Figure 2. Average milk yield (kg; image in the top, A) and daily energy balance (MJ; image in the bottom, B) per by days of lactation for cows in first parity (left), second (middle), and third (right) ………26
Figure 3. Metabolic pathways of ketogenesis in the blood circulation, the liver and the udder ………30
Figure 4. Goals, minimum, and maximum mean herd body condition scores for dairy cattle throughout the lactation cycle, based on a scoring system ranking cows from (emaciated) to 5 (obese)…… ………31
Figure 5. Incidence of new intramammary infection during the dry period and lactation ... 39
Figure 6. Distribution of incidence rate of clinical mastitis per week after calving ... 39
Figure 7. Kaplan-Meier survival curves illustrating survival probability for 732 multiparous cow-lactations from 13 commercial herds enrolled in a randomized controlled trial (dash line represents cows incompletely milked; full line represents cows conventionnally milked)………...72
Figure 8. Square root of milk weight least square means (in kg/d) in conventionally milked cows (dash line) and cows incompletely milked during the first five days in milk (full line) . 73
Figure 9. Milk fat concentration least square means (in %) in conventionally milked cows (dash line) and cows incompletely milked during the first five days in milk (full line) ... 74
Figure 10. Milk protein concentration least square means (in %) in conventionally milked cows (dash line) and cows incompletely milked during the first five days in milk (full line) . 75
Figure 11. Energy corrected milk least square means (in kg/d) in conventionally milked cows (dash line) and cows incompletely milked during the first five days in milk (full line) . 76
Figure 12. Flow of cows in a randomized control trials conducted on 13 commercial dairies and evaluating impact of incomplete milking during the first five days in milk (I) compared to conventionnal milking (C) on udder and reproductive tract health ... 104
xv
Figure 13. Kaplan-Meier survival curves illustrating clinical mastitis hazard for 769 multiparous cows from 13 commercial herds enrolled in a randomized controlled trial comparing conventionally and incompletely milked cows ... 105
Figure 14. Diagram illustrating flow of cows and missing observations for cows from 13 commercial herds enrolled in a randomized controlled trial comparing conventionally (C) and incompletely (I) milked cows ... 131
Figure 15. Survival curves of time to pregnancy for 596 lactating Holstein cows classified in different early lactation hyperketonemia levels based on serum β-hydroxybutyrate concentration determined in first to third weeks in milk ... 132
Figure 16. Illustration of the placement of a pressure algometer for quantifying mechanical nociceptive threshold in dairy cows. ... 150
Figure 17. Distribution of the mechanical nociceptive threshold (in kg) measured using a handheld pressure algometer. Data obtained using one measure per day for five consecutive days on 36 milking cows... 151
Figure 18. Distribution of the amount of pressure applied using a handheld pressure algometer in cases where cows did not react (in kg; maximum pressure). Data obtained using one measure per day for five consecutive days on 36 milking cows. ... 152
Figure 19. Concordance correlation plot comparing inter-rater reliability for mechanical nociceptive threshold quantified using the algometer. Data obtained using one measure per day for five consecutive days on 36 milking cows. The full line represents the line of perfect concordance and dashed line represents reduced major axis. ... 153
Figure 20. Concordance correlation plot comparing test-retest reliability for mechanical nociceptive threshold quantified using the algometer. Data obtained using two consecutive measures per day for two raters and for five consecutive days on 36 milking cows. The full line represents the line of perfect concordance and dashed line represents reduced major axis. .. 154
Figure 21. Non adjusted least square means for lying time (h/d) in incompletely milked (Treated) cows and control cows (Control) in a randomized controlled trial conducted on 32 dairy cows from two commercial herds ... 176
Figure 22. Non adjusted least square means for lying bout frequency (bouts/d) in incompletely milked (Treated) cows and control cows (Control) in a randomized controlled trial conducted on 32 dairy cows from two commercial herds ... 177
xvi
Figure 23. Non adjusted least square means for mean lying bout duration (min/bout) in incompletely milked (Treated) cows and control cows (Control) in a randomized controlled trial conducted on 32 dairy cows from two commercial herds ... 178
Figure 24. Distribution of milk production on days in milk one (n = 30), two (n = 107), three (n = 178), four (n = 236) and five (n = 286) in conventionally milked cows (i.e. complete milking) compared to incomplete milking (red line) ... 186
xvii
LIST OF ABBREVIATIONS
AI Artificial insemination AMS Automatic milking system BCS Body condition scoring BHBA β-hydroxybutyrate
CCC Concordance correlation coefficient CI Confidence interval
CMT California mastitis test
CRC Controlled-release intraruminal capsule DHI Dairy Herd Improvement
DIM Days in milk
ECM Energy corrected milk
FAO Food and Agriculture Organization FSH Follicle-stimulating hormone HR Hazard ratio
IFN-ƴ Interferon gamma
IGF Insulin-like growth factor IL Interleukins
IMI Intramammary infection IQR Interquartile range LE Leukocyte esterase LH Luteinizing hormone
MNT Mechanical nociceptive threshold NEFA Non-esterified fatty acids
OR Odds ratio
PBMC Peripheral blood mononuclear cells (agranulocytes such as lymphocytes and monocytes) PCR Polymerase chain reaction
PMNL Polymorphonuclear leukocytes (granulocytes such as neutrophils, eosinophils, basophils) PVD Purulent vaginal discharge
P4 Progesterone
xviii
REFLECT Randomized control trials in livestock and food safety statement ROS Reactive oxygen species
RR Risk ratio
SCC Somatic cell counts SD Standard deviation Se Sensitivity
Sp Specificity
TCA Tricarboxylic cycle TMR Total mixed ration
TNF-α Tumor necrosis factor alpha VLDL Very low density lipoproteins VWP Voluntary waiting period WIM Weeks in milk
xix
“Valeu a pena? Tudo vale a pena se a alma não é pequena.” (In: Mensagem. Fernando Pessoa, 1934)
xx
ACKNOWLEDGEMENTS
I came to Saint-Hyacinthe in the summer of 2014 without the smallest idea of what this experience was going to be like, and without knowing a single person in the whole province. This experience could not have been better, and I owe that mostly to my wonderful advisor Simon Dufour. Thank you for being always so present, and for giving me so much encouragement and guidance throughout the entire course of this project. I am forever grateful for having you as an advisor. I also want to thank my co-advisors Jocelyn Dubuc and Jean-Philippe Roy for allowing me to have this opportunity and for their invaluable advices.
I am grateful to my committee members Trevor DeVries and Julie Arsenault, and to the collaborators Pierre Lacasse, Younes Chorfi and Débora Santschi.
Throughout the sampling process, I was fortunate to have worked alongside Caroline Bergeron, Ève-Marie Lavallée-Bourget, Josée Lemay-Courchesne, Roxanne Mandeville, Pierre-Alexandre Morin and of course, Jean-Philippe Pelletier. Thank you for these enormously appreciated collaborations and friendships. I would like to extend a thank you to the dairy producers who participated in this study and allowed us access to their farms for months on end. Without them, this research would not have been possible. I am also very grateful to Novalait
Inc, Fonds de recherche du Québec – Nature et technologies (FRQNT) and Ministère de l’Agriculture, des Pêcheries et de l’Alimentation du Québec (MAPAQ) for funding this research.
I am extremely lucky to have had the opportunity to pursue my studies at the faculty of veterinary medicine in Saint-Hyacinthe surrounded by wonderful friends. The number of people that have touched my life during my four years in this faculty is countless, but I have to mention a few: Jasmin Laroche, Coralie Goetz, Mariela Srednik, Corinne Lafrance-Girard, Mahjoob Aghamohammadi, Hossein Jamali, Sabrin Alnahdi, Réda Riahi, Mar Costa Hurtado, Selmane Boubendir, Agustina Lavagna, Camila Valle, Laura Franco, Marêva Bleuzé, Mélodie Schneider.
Finally, I must thank my family. Especially my mother (Helena) and my father (Helder), who encouraged my curiosity and love for research, and have always supported me to pursue my dreams and ambitions.
CHAPTER 1:
INTRODUCTION
Most mammals undergo a state of negative energy balance around parturition, in which energy demands for the fetus or newborn exceed the energy obtained through the diet (Wade and Schneider, 1992). Dairy cows suffer particularly from it, as they were selected to produce as much milk as possible, far exceeding the milk needed for one calf (Jasper and Weary, 2002).
Selection for increased yield became the focus in dairy farming with the increased costs of land and labor, which tripled from 1960-95, compared to the price of milk, that only doubled (Veerkamp et al., 2009). Data from the United Nations Food and Agriculture Organization (FAO) food balance database (FAO, 2015) reveals that there has been a gradual increase in milk consumption per capita in the world from the 1960’s (around 75 kg/capita/yr) until the 2000’s (around 90 kg/capita/yr in 2013), and as the milk demand increases, so does the offer. The same database shows the enormous increase in global milk production from 350 billion liters in the 1960’s to more than the double in 2013 (around 770 billion liters). That has been possible through an increment in the dairy cattle population, but also through genetic selection for increased milk production, through improved nutrition and feeding systems (Lucy, 2001; Vandehaar and St-Pierre, 2006; FAO, 2015). In the USA, at the cow level, milk production increased from 6,700 kg/yr in 1990, to 9,300 kg/yr (FAO, 2015). Nowadays, Holstein cows produce 9,000 to 10,000 kg/yr in most developed countries (CDIC, 2016), and according to Santos et al. (2011), the average North American milking cow will produce 14,000 kg/yr in 2050.
Along with this substantial increase in milk production, reproductive efficiency and longevity of dairy cows have decreased (Lucy, 2001; Oltenacu and Broom, 2010; Bicalho et al., 2014). Even though knowledge on dairy cattle feeding systems has increased considerably in the last decades, with higher levels of concentrate to meet dairy cow’s nutrient requirements more adequately (Eastridge, 2006), the high-production settings have increased the risk for metabolic diseases (Zwald et al., 2004; Koeck et al., 2013; Pryce et al., 2016). These are sometimes called “production diseases”, and they include ketosis, hypocalcemia (or milk fever), rumen acidosis, hepatic lipidosis and abomasal displacement. These production diseases often lead to immune suppression in early lactation, increasing the risk for infectious diseases such as
22
mastitis and metritis (Esposito et al., 2014). As Bauman and Currie (1980) mentioned, pregnancy and milk production are the priority for dairy animals, allowing these biological states to continue sometimes at the expense of other metabolic processes, even if a state of disease is created.
Physiological imbalance or dysfunction appears to be one of the main factors leading to increased risk for transition diseases (i.e. diseases occurring around parturition), and together, these problems have a great impact on subsequent reproductive performances (Walsh et al., 2007b; Wathes et al., 2007b; Ospina et al., 2010a) and culling (i.e. death or removal from herd). This leads to the urgent need of alternative management strategies to help dairy cattle to cope with the intensive systems in which they are raised (Esposito et al., 2014; Lacasse et al., 2017). Although there has been great improvements in managing the source of energy for the cow (e.g. increasing diet density, monensin, managing the transition period to maintain food intake; Eastridge, 2006), little work has been done in controlling energy expenses to improve energy balance.
Incomplete milking during the first five days in milk (DIM) is an innovative approach to limit the negative energy balance and its consequences. This strategy was mentioned for the first time by Carbonneau et al. (2012) in research settings. Carbonneau et al. (2012) showed that reducing the quantity of milk collected during the first five DIM, without reducing the milking frequency, allows to temporarily decrease energy demands in early lactation, thus helping cows to handle the high metabolic demands. Morin (2017) investigated the impact of a very similar milking protocol in a commercial dairy farms context, and showed that incomplete milking led to lower blood β-hydroxybutyrate (BHBA) in early lactation, along with lower odds of hyperketonemia, a commonly used indicator of negative energy balance (Whitaker et al., 1993). The cows enrolled in the randomized controlled trial (RCT) from Morin (2017) continued being followed until the rest of their lactations, allowing for the analyses of several other outcomes, besides BHBA, that will be described in the current thesis. Our hypothesis was that the reduction in hyperketonemia prevalence in early lactation would further improve dairy cows’ performance and health throughout their lactation.
23
Research objectives
To help the reader to understand the problematic and the methodological choices, this thesis starts with a literature review in Chapter 2. The literature review is followed by the reports of a series of experimental epidemiological studies along with an observational study. The underlying objectives of the experimental studies were to quantify the impact of an incomplete milking during the first five DIM on:
1) Culling and milk production, presented in Chapter 3;
2) Incidence of infectious diseases, presented in Chapter 4; and 3) Reproductive performance, presented in Chapter 5.
Another aim of this project was to quantify the impact of an incomplete milking during the first five DIM on ketonemia and prevalence of hyperketonemia. That objective was developed and presented by Morin (2017) as part of a master program.
During the study, the fact that some producers were concerned about the potential discomfort caused by the treatment, led to the addition of two secondary objectives to evaluate pain or discomfort:
4) To quantify the reliability of the algometer for measuring mechanical nociceptive threshold (MNT) when applied to the udder of dairy cows, which led to the observational study described in Chapter 6;
5) To investigate the impact of the incomplete milking on behavior, which is commonly used to evaluate pain, presented in Chapter 7.
24
CHAPTER 2:
LITERATURE REVIEW
In this review, the general life cycle of a cow is described, followed by the physiology of lactation and the negative energy balance. The latter section is further divided in the negative energy balance description, ways of measuring it, its consequences in terms of health and performance, and ways of decreasing its magnitude. This chapter finishes with the description of a novel strategy to improve cows’ energy balance – to limit milk production in early lactation – along with its possible undesired effects.
The life cycle of a cow
The cow, like other mammals, reaches reproductive capacity while still growing. In an intensive dairy farming perspective, shorter times from birth to first calving, bring faster profits. Therefore, under an economic perspective, cows should have their first calf around 24 months of age (Esslemont and Kossaibati, 2000). After calving, the cow starts her lactation and a milk peak is achieved around four to eight weeks in milk (WIM). This peak may be held for several weeks, after which the milk production declines until the cow is dried off. The cow’s ability to reduce or delay that decline in milk production is named persistency (Macciotta et al., 2005). Paradoxically, just at the time when the cow needs the most nutrients for milk production, the voluntary dry matter intake is at its lowest point (see Negative energy balance – Description). Maximum feed intake is only achieved around 8-22 WIM, so until that time the cow relies partialy on her body stores (Akers, 2002; Figure 1).
In primiparous animals (i.e. animals in their first lactation or parity), energy resources for growing will compete against resources for pregnancy and lactation, leading to a slower growing rate (about half of the previous rate). Energy allocation is prioritized for the fetus, followed by the body reserves and growth. After parturition, milk synthesis is prioritized and maternal growth is suspended until the energy balance is restored later in lactation (Whittemore, 2009). Compared to multiparous cows, in primiparous the lactation peak is lower and occurs a bit later (due to mammogenesis, see Physiology of lactation). Another difference is that the decline in milk yield after peak production is not as sharp as that of older cows (i.e., they show a better persistency; Stanton et al., 1992; Rekik et al., 2003; Coffey et al., 2004). These
25
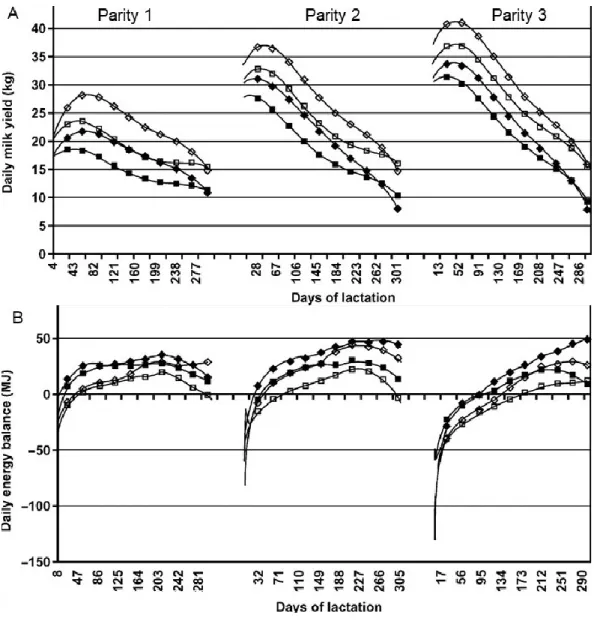
differences in the lactation curve of primiparous animals, along with a shorter lag between peaks for milk yield and food intake, lead to better energy balance at the beginning of the lactation in this group of animals (see Figure 2). Cows in their second lactation are still growing, but almost reaching maturity. Full maturity is generally reached around the third lactation (Coffey et al., 2004; Van Hoeij et al., 2017).
After calving, producers allow for a period of around 50 DIM (voluntary waiting period,
VWP) before first breeding, generally through artificial insemination (AI; Radostits et al.,
2007). There might be several inseminations until the cow becomes pregnant again, but ideally, she becomes pregnant after one AI, and she will be calving again in one year (calving to calving interval of 341 to 403 d; Inchaisri et al., 2010). Approximately two months before calving, the cow has a pause, the dry period, in which she prepares for her next lactation, by maintaining and maybe slightly increasing her body reserves (Radostits et al., 2007).
Figure 1. Phases of the lactation cycle with corresponding changes in milk yield, dry matter intake and body weight
(Source: NRC, 1989. Nutrient Requirements of Dairy Cattle. Washington, DC.) © Reproduced from NRC (1989).
26
Figure 2. Average milk yield (kg; image in the top, A) and daily energy balance (MJ; image in the bottom, B) per by days of lactation for cows in first parity (left), second (middle), and third (right)
Symbols refer to different diets: low-concentrate control ■, low-concentrate selected for maximum production □, high-concentrate control ♦, and high-concentrate selected for maximum production ◊.
(Source: Coffey et al., 2004. Genotype and diet effects on energy balance in the first three lactations of dairy cows. J Dairy Sci. 87(12):4318-26.)
27
Physiology of lactation
Homeorhesis is, as defined by Bauman and Currie (1980), “the orchestrated or coordinated changes in metabolism of body tissues necessary to support a physiological state”. The physiological state of lactation is an example of homeorhesis in which several physiological adaptations involving most of the body tissues (i.e. mammary tissue, digestive tract, liver, adipose tissue, etc) occur. These adaptations are related to the various hormonal changes that take place during mammogenesis (i.e. the development of the mammary gland), lactogenesis (i.e. the onset of milk secretion) and galactopoesis (maintenance of milk secretion). Most mammary growth occurs during pregnancy, but it lasts until the peak of lactation. Lactogenesis is divided in two phases, a first one (lactogenesis 1) that happens in midpregnancy, in which genes coding for proteins are activated in the mammary epithelial cells, allowing these to differentiate into active secretory cells; and a second one (lactogenesis 2), led by prolactin, that leads to secretion of colostrum and milk. After calving, prolactin and oxytocin maintain lactation, acting on milk secretion and ejection, respectively (Neville et al., 2002; Sjaastad et al., 2010).
Sexual hormones such as progesterone (P4) and estrogen are of primary importance for lactogenesis. Progesterone stimulates udder development during pregnancy, and it is a key hormone for lactogenesis. Its concentration falls around calving, allowing the mammary gland to respond to the presence of prolactin (Sjaastad et al., 2010).
On the other hand, blood estrogen concentration increases as calving approaches (Grummer et al., 1990; Ingvartsen, 2006). Estrogen stimulates insulin-like growth factor (IGF) I secretion from the udder, leading to growth of mammary epithelial cells (Svennersten-Sjaunja and Olsson, 2005). However, estrogen also has the capacity to increase the brain sensitivity to satiety hormones, more specifically to cholecystokinin (Geary, 2001) and to leptin (Ainslie et al., 2001), decreasing voluntary feed intake (Wade and Schneider, 1992). Leptin is a powerful regulator of appetite, being modulated not only by estrogen but also by insulin, glucocorticoids and thyroid hormones. It is secreted by the adipocytes and it remains low during the postpartum period (Vernon and Houseknecht, 1999; Wathes et al., 2007a).
28
Milk production is mainly controlled by prolactin and somatotropin (growth hormone), which are both lactogenic hormones. In early lactation, the presence of these two hormones leads to high rate of milk production despite the relatively low dry matter intake (Clarenburg, 1992). Somatotropin stimulates IGF-I production by the liver (but also in other organs such as the hypothalamus, ovaries, oviducts and uterus; Clarenburg, 1992). However, during early lactation, insulin concentrations remain low, which prevents an increase in receptors for somatotropin in the liver, therefore reducing IGF-I secretion and increasing somatotropin concentrations (Lucy, 2008). The rapid decline in IGF-I levels after parturition, is followed by a progressive increase as lactation persists and as energy balance improves (Baumrucker, 1999). This polypeptide has been positively correlated with dry matter intake (Francisco et al., 2002), and it is essential for normal follicular development (Zulu et al., 2002; Van Den Hurk and Zhao, 2005).
Somatotropin and insulin are primarily metabolic hormones and they consequently ensure adequate supplies of nutrients to the mammary gland. Somatotropin is a lypolitic agent, leading to utilization of protein and lipid stores for milk production, and it stimulates hepatic gluconeogenesis and decreases insulin receptors in the muscle, so that more glucose is available for milk production (Sjaastad et al., 2010). Low insulin levels reduce glucose utilization by non-mammary tissues (i.e. adipose and muscle) and facilitate greater uptake of glucose by the mammary gland. Cows have low capacity to absorb glucose directly from their diet, therefore gluconeogenesis is their main source to produce lactose (Herdt and Emery, 1992). If glucose supply fails to meet the needs associated to lactation, then several metabolic disorders occur, resulting in metabolic disease, ketosis and compromising the cow’s well-being (Bauman, 1999). Insulin also affects reproduction by promoting follicular response to gonadotropins (i.e. follicle-stimulating hormone, FSH and luteinizing hormone, LH; Frajblat and Butler, 2000).
Glucocorticoids (e.g. cortisol and corticosterone) are adrenal hormones that are released in response to metabolic challenges (e.g. generalized stress, food deprivation) and have the capacity to increase the availability of endogenous glucogenic precursors depending on insulin status (Umpleby and Russell-Jones, 1996). Cortisol, particularly, is a primary hormone in lactogenesis, being essential for the effect of prolactin initiating lactation (Sjaastad et al., 2010). Its concentration starts to increase around three days before calving, and decreases around three
29
to five DIM (Patel et al., 1996). Similarly to cortisol, triiodothyronine (thyroid hormone) is required to maintain milk secretion, as in its absence the intensity and duration of milk secretion is reduced (Rose and Obara, 2000; Sjaastad et al., 2010).
Negative energy balance
Description
During the transition period (i.e. from three weeks before until three weeks after calving), the dry matter intake is at its lowest point while the energy requirements for fetal development (pre-calving period) and then for galactopoesis (post-calving period) are high (Grummer et al., 2004). The lower dry matter intake is a result of several factors such as fetal growth (based on the idea that the fetus restricts rumen volume) and body condition (i.e. lipid stores). For instance, high levels of concentrate in the diet appear to have a negative impact on voluntary intake when compared to diets with more fiber (Allen, 2000; Akers, 2002). Metabolism also plays an important role on food intake, through levels of estrogen, blood metabolites, corticosteroids, leptin, insulin, gut peptides, and cytokines (Grummer et al., 1990; Ingvartsen and Andersen, 2000; Ingvartsen, 2006). Therefore, the lag between peak yield and the increase in feed intake leads to a physiologically unavoidable negative energy balance, in which insulin-antagonist hormones (e.g. glucagon, glucocorticoids, epinephrine, and norepinephrine) are released, leading to proteolysis and lipolysis (Bauman and Currie, 1980; Clarenburg, 1992). Hence, cows rely partially on body reserves during early lactation, resulting in a 50–75 kg loss of body weight in early lactation (Roche, 2006).
Lipolysis leads to extensive mobilization of lipids from the adipose tissue, in the form of non-esterified fatty acids (NEFA). In the liver, NEFA are oxidized to form acetyl-CoA. In turn, acetyl-CoA can be further oxidized for energy in the Kreb’s tricarboxylic cycle (TCA; complete oxidation; Ingvartsen, 2006). However, when there is an excess of NEFA to be oxidized by the liver, acetyl-CoA is instead partially oxidized into ketone bodies, which may be used as energy source by the heart, kidney, skeletal muscles, mammary gland and gastrointestinal tract (Whitaker et al., 1993; Figure 3). There are three ketone bodies, acetate, acetoacetate and BHBA, the latter being the predominant circulating ketone body. When liver’s
30
capacity to oxidize NEFA is exceeded, NEFA are then re-esterified to form triglycerides that can be exported as very low density lipoproteins (VLDL) or stored in the liver. Ruminants ability to export VLDL is limited, therefore triglycerides liver storage is the main outcome (Grummer et al., 2004). Therefore, when lipid uptake by the liver is greater than its ability to oxidize NEFA’s and to export VLDL’s, hepatic lipidosis (or fatty liver) might develop, with consequent liver dysfunction (Bobe et al., 2004; Mulligan and Doherty, 2008).
Figure 3. Metabolic pathways of ketogenesis in the blood circulation, the liver and the udder
NEFA: Non-esterified fatty acid; TCA: Kreb’s tricarboxylic cycle.
(Source: Suriyasathaporn et al., 2000. Hyperketonemia and the impairment of udder defense: a review. Vet. Res. 31:397–412.)
© Addapted from Suriyasathaporn et al. (2000).
Measuring the negative energy balance
Energy balance can be calculated by subtracting the energy utilization (e.g. for maintenance, growth, activity and milk yield) to the energy intake (the energy content in the diet; Emmans, 1994). Energy used for fetus and growth, along with the exact food intake by individual cow can be difficult to determine in practice, limiting the use of this method to measure energy balance on farm.
31
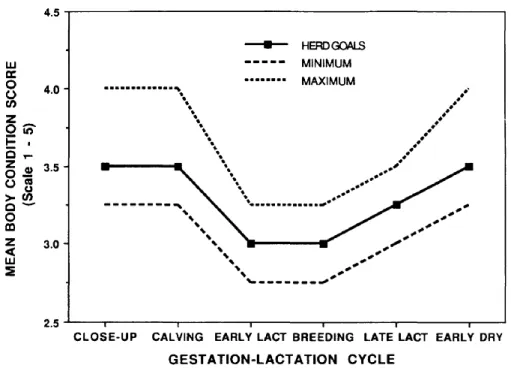
Another way to measure the level of negative energy balance, is to measure changes in cows’ body condition during early lactation (Coffey et al., 2003). Body condition scoring (BCS) is a subjective evaluation of cows’ body reserves made through observation of specific body regions such as the spinous and transverse processes of the lumber vertebrae, or the tail head regions (Edmonson et al., 1989; Ferguson et al., 1994). The 5-point scale method developed by Ferguson et al. (1994) is the most commonly used scale, in which 1 is thin and 5 is obese and increments are generally done by 0.25 or 0.5 units. According to Contreras et al. (2004), the ideal BCS at dry-off is 3.0. A BCS > 3.5 at calving, might lead to excessive fat mobilization in the early lactation (Clarenburg, 1992; Figure 4), which in turn can reduce cows’ performance (Domecq et al., 1997). Since BCS is negatively associated with dry matter intake (through leptin production by the adipocytes), the higher the BCS at calving, the higher the negative energy balance and BCS loss (Roche et al., 2007). The problem with BCS is that within and between observers agreement might vary considerably (Ferguson et al., 1994; Morin et al., 2017).
Figure 4. Goals, minimum, and maximum mean herd body condition scores for dairy cattle throughout the lactation cycle, based on a scoring system ranking cows from
(emaciated) to 5 (obese) LACT: Lactation; DRY: Dry period.
(Source: Data from Braun, et. al. 1986. Body condition scoring dairy cows as a herd management tool. Compend Contin Educ Pract Vet 8:62; and Ferguson and Otto 1988. Managing body condition in dairy cows. Page 75 in the Cornell Nutrition Conference for Feed Manufacturers Proceedings, Syracuse, NY.)
32
Blood NEFA concentration is a good indicator of lipid mobilization, and mirrors dry matter intake (Adewuyi et al., 2005; Ospina et al., 2010b; Seifi et al., 2011). A NEFA blood concentration ≥ 0.3 mmol/L detected 35 to 3 days before calving (Cameron et al., 1998) or ≥ 1.0mmol/L detected between 1 and 7 DIM (LeBlanc et al., 2005) have been associated with increased risk for left displaced abomasum. Concentrations ≥ 0.6 mmol/L during 3 to 14 DIM have also been associated with increased risk for clinical ketosis, retained placenta and metritis (Ospina et al., 2010b). However, no cow-side test is available to measure NEFA yet, therefore to quantify it, samples have to be sent to a laboratory, making it less practical and more expensive to use.
Detection of ketone bodies in the blood, urine or milk can also be used as an indicator of the level of negative energy balance. As mentioned above, they reflect the completeness of oxidation of fat in the liver, thus they are only indirectly related to lipid mobilization. Compared to other ketone bodies, BHBA is the one with higher stability in serum, being therefore the most commonly measuring ketone body to diagnose ketosis (Oetzel, 2004; Iwersen et al., 2009). Although tests that detect ketone bodies in urine can reach good levels of sensitivity (Se) and specificity (Sp) to detect ketosis (Carrier et al., 2004), blood and milk samples are more easily obtained and therefore they are generally favored for ketosis diagnosis (Carrier et al., 2004; LeBlanc, 2010). Some examples of cow-side tests frequently used for ketone bodies measurement are Precision Xtra (for measurement of BHBA in blood, urine and milk; Abbott Laboratories, Abbott Park, IL), Ketostix Strip (for measurement of acetoacetate in urine; Bayer Corporation, Elkhart, IN) and KetoTest (for measurement of BHBA in milk; Sanwa Kagaku Kenkyusho Co. Ltd., Nagoya, Japan).
Hyperketonemia is frequently defined as blood BHBA concentrations ≥ 1.4 mmol/L during WIM one (Duffield et al., 2009) or ≥ 1.2 during the first two WIM (Suthar et al., 2013), because both thresholds have been associated with increased risk of left abomasal displacement and lower milk production. Hyperketonemia generally occurs during the first two WIM, with a peak incidence at DIM five (McArt et al., 2012) and its prevalence is generally between 16 and 25% (Duffield et al., 2009; Chapinal et al., 2012b). Some authors prefer to use the terminology
subclinical or clinical ketosis, when hyperketonemia is presented without or with signs of
33
(Oetzel, 2007; Radostits et al., 2007). The term hyperketonemia will be used throughout the current document because clinical cases were not excluded.
Consequences of severe negative energy balance
Numerous studies have demonstrated an association between negative energy balance and its indicators (hyperketonemia) and several transition diseases. These diseases are inter-related, and most of them, along with negative energy balance, increase the risk of poor reproductive performance and culling (Mulligan and Doherty, 2008). It is therefore very difficult to determine the level of causality between all these variables. Those relationships will be described in detail in the following sections.
Increased risk for metabolic diseases
Besides ketosis, another condition that occurs due to high demands for fetal maturation and milk production is peripartum hypocalcemia. It results from the increased requirement for calcium combined with a poorer response of osteocytes to the hormones responsible for triggering bone resorption and calcium homeostasis (Radostits et al., 2007) and it is more common in multiparous animals (Reinhardt et al., 2011). Hypocalcemia can be subdivided in clinical (also known as milk fever) or subclinical, depending on presence of clinical signs. Incidence rate of clinical hypocalcemia varies between 3.5 and 7% (DeGaris and Lean, 2008) while that of subclinical hypocalcemia (blood calcium concentration < 2.0 mmol/L) may vary between 25 and 54% (Reinhardt et al., 2011). Hypocalcemia can put an important toll on the cow ability to survive. It is not only positively associated with development of ketosis, but also with several other conditions such as dystocia, uterine prolapse, retained placenta, displacement of the abomasum, downer cow syndrome, immunosuppression, infectious diseases (mastitis and endometritis) and infertility (Goff and Horst, 1997; Houe et al., 2001).
Displacement of the abomasum is a multifactorial syndrome occurring mostly in high yielding cows, during the first month after parturition. Gastrointestinal stasis, due to hypocalcemia, is a prerequisite for its development. Other risk factors are hyperinsulinemia and ketosis (Fecteau and Guard, 2015). Several studies have shown an association between ketosis and development of left abomasal displacement (Duffield et al., 2009; Ospina et al., 2010b;
34
McArt et al., 2012). In Duffield et al. (2009) study, BHBA blood concentration ≥ 1.4 mmol/L detected during the first WIM increased the odds of abomasal displacement by 2.8 times (95% confidence interval, CI, for the odds ratio, OR: 1.3, 6.0). Ospina et al. (2010b) found an increased risk by 6.9 (95% CI for the risk ratio, RR: 3.7, 12.9) in cattle presenting BHBA blood concentration ≥ 1.7 mmol/L around 3 to 14 DIM. Finally, McArt et al. (2012) found that BHBA blood concentration between 1.2 and 2.9 mmol/L detected around 3 to 16 DIM increased the risk of abomasal displacement by 1.1 times (95% CI for the RR: 1.0, 1.2). Left displaced abomasum is the most common form of the disease, with an incidence ranging from 5 to 7% (LeBlanc et al., 2005).
Increased risk for infectious diseases
The transition period is accompanied by some degree of immunosuppression in most dairy cows (Goff, 2008). The etiology of this immunosuppression is not completely understood, but it seems to be caused by an association of factors that include negative energy balance and increased cortisol (Preisler et al., 2000). Cortisol, estrogen and P4 have negative effects on the immune system, while somatotropin, prolactin, insulin and IGF-I have positive effects (Ingvartsen et al., 2003). The low levels of IGF-I during early lactation, particularly, decrease the immune defenses, due to the IGF-I role in modulating the pro-inflammatory response. Moreover, during the periparturient period, as a result of stresses associated to calving (injuries during calving, mammary gland edema and uterus involution), there is often release of pro-inflammatory cytokines (tumor necrosis factor alpha, TNF-α; interleukins, IL 1 and 6; Trevisi et al., 2011) and of reactive oxygen species (ROS; Abuelo et al., 2014). Release of pro-inflammatory cytokines leads to an increase of some acute-phase proteins and a decrease in other liver proteins such as albumins, lipoproteins and retinol binding protein (Trevisi and Bertoni, 2008). Reactive oxygen species play an important role in the host immune response, being involved in expression of immunoregulatory substances and inflammatory response optimization. But when produced in excess, ROS can lead to tissue damage (through oxidation of DNA, cellular proteins and lipids) and impairment of cell functions (Valko et al., 2007). Cow’s homeostasis plays, therefore, a major role in modulating the immune system.
35
Another reason for the immunessupression observed during the transition period is hypocalcemia. Essentially, a key feature in peripheral blood mononuclear cells (PBMC) activation is an increase in intracellular ionized calcium concentration ([Ca2+]i). This increase in [Ca2+]i after an activation signal is an indicator of PBMC responsiveness and function (Baus et al., 1996; Grafton and Thwaite, 2001; Kimura et al., 2006). Therefore, hypocalcemic cows have generally decreased immune defenses (Ducusin et al., 2003; Bréchard and Tschirhart, 2008; Martinez et al., 2012).
Cows with elevated blood concentration of NEFA and BHBA (indicators of negative energy balance), have impaired polymorphonuclear leukocytes (PMNL) function (Suriyasathaporn et al., 1999; Suriyasathaporn et al., 2000; Hammon et al., 2006; Scalia et al., 2006; Ster et al., 2012). These functions include cell adhesion, molecules expression, chemotaxis and oxidative burst. Also, NEFA seem to decrease in vitro cytokine production by lymphocytes (examples of cytokines: interferon gamma, IFN-ƴ; TNF-α; IL-4; Lacetera et al., 2004; Ster et al., 2012) and to decrease PBMC proliferation (Ster et al., 2012). The cytokine IFN-ƴ produced by lymphocytes is responsible for the activation of macrophages and it is important for an effective cell-mediated immune response, therefore its shortage leads to immunosuppression (Loiselle et al., 2009). The action of BHBA on IFN-ƴ production and in PBMC proliferation is less pronounced than NEFA’s, and it might be caused by the close association between NEFA and BHBA (Ster et al., 2012). Nevertheless, it is not only the innate immune system that is affected during the transition period, the acquired immune responses are also negatively affected (Mallard et al., 1997). As consequence, the periparturient dairy cow becomes more susceptible to infectious diseases (e.g. metritis and mastitis).
Increased risk for reproductive tract disease
Development of infectious diseases is dependent on the balance between host immunity and the bacteria. Therefore, although contamination of the uterus during calving or in early postcalving is very common, development of uterine disease, however, depends heavily on type and number of microorganisms and on the immunological status of the cow (Sheldon et al., 2006). Conditions that lead to low immune defenses such as those related to negative energy
36
balance are important factors to development of reproductive tract diseases. Other risk factors are retained placenta, twins, dystocia, parity, season and BCS (LeBlanc et al., 2002).
Uterine diseases in dairy cattle can be classified as metritis or endometritis. Metritis is an acute inflammation of the uterus, occurring < 21 DIM and being often accompanied by fetid brown-red watery vaginal discharge and systemic signs (i.e. fever, lower milk yield, lower feed intake). Endometritis occurs later (≥ 21 DIM) and does not include systemic signs (Sheldon et al., 2006). Reproductive tract diseases also include purulent vaginal discharge (PVD), which is sometimes referred to as clinical endometritis (LeBlanc et al., 2002; Kaufmann, 2010).
Cytological endometritis is diagnosed by endometrial cytobrush (Kasimanickam et al., 2004), endometrial flush (Sheldon et al., 2006; Galvão et al., 2009) or endometrial biopsy (Bonnett et al., 1993; Chapwanya et al., 2010) and it is defined as an increased proportion of PMNL in the endometrium. When testing (with endometrial cytobrush) animals without clinical signs from 20-33 DIM, PMNL count > 18% was associated with reduced subsequent reproductive performance (Kasimanickam et al., 2004). When testing all animals from 28-42 DIM, regardless of presence of clinical signs, PMNL count ≥ 6% had the highest Se (42%) and Sp (80%) to predict non-pregnancy status at first AI (Denis-Robichaud and Dubuc, 2015). These tests generally involve microscopic PMNL count, unless when used along with leukocyte esterase (LE), which is performed with a colorimetric semi-quantitative strip that becomes violet in presence of PMNL (Cheong et al., 2012). This dye occurs through the oxidation of diazonium salt in presence of leukocyte esterase released from the neutrophilic cells, thus darker colors are correlated to higher levels of leukocytes and recorded as: 0, negative, 0.5, trace of leukocytes, 1, small amount of leukocytes, 2, moderate amount of leukocytes, 3, large amount of leukocytes (Couto et al., 2013). The LE test is highly correlated to endometrial cytology according to Santos (2006; kappa = 0.60), but moderately correlated according to Denis-Robichaud and Dubuc (2015; kappa = 0.43). According to Denis-Denis-Robichaud and Dubuc (2015), when testing all animals from 28-42 DIM, regardless of presence of clinical signs, LE ≥ 1 had the highest Se (52%) and Sp (60%) to predict non-pregnancy status at first AI. Cheong et al. (2012), tested cows from 40-60 DIM and concluded that only LE ≥ 3 had an association with decreased hazard of pregnancy (increased calving to conception interval), presenting a good Se (34%) and Sp (90%). In Dubuc and Denis-Robichaud (2017), the median herd-level prevalence
37
(126 herds) of cytological endometritis between 30 and 43 DIM diagnosed by PMNL count (≥ 6%) or by LE (≥ 1) was 29.4% (range: 5.3, 80.0%) and 43.8% (range: 0, 77.8%), respectively. In summary, several definitions of cytological endometritis are present in the literature and various tools including cytobrush and leukocyte esterase are available to evaluate its presence.
Purulent vaginal discharge can be diagnosed by visual examination (Miller et al., 1980), manual examination (Sheldon et al., 2002), vaginoscopy (Barlund et al., 2008) or by Metricheck (McDougall et al., 2007). The Metricheck test (Simcro, Hamilton, New Zealand) has six levels from 0 to 5 depending on vaginal secretion’s appearance (McDougall et al., 2007): 0, no discharge; 1, clear mucus; 2, mucus with flecks of pus; 3, mucopurulent discharge; 4, purulent discharge; or 5, foul smelling discharge. When using Metricheck, Dubuc et al. (2010a) found that the threshold ≥ 3 was the best to predict non-pregnancy status during the first 120 DIM, showing a Se and Sp of respectively, 18% and 90% when used at 32-38 DIM, and of 15% and 92%, when used at 53-59 DIM. On the other hand, Denis-Robichaud and Dubuc (2015) found that a Metricheck score ≥ 4 around 28-42 DIM had the highest Se (20%) and Sp (91%) to predict non-pregnancy status at first AI. There is only a slight agreement between endometrial cytology and presence of PVD (kappa = 0.20; Denis-Robichaud, 2013). Furthermore, both disorders have a cumulative impact on reproductive performance (Dubuc et al., 2010a), which shows that they have additive detrimental impacts, and that therefore they should not be considered as different levels of the same disease (endometritis). In Dubuc and Denis-Robichaud (2017), the median herd-level prevalence of PVD (≥ 4) between 30 and 43 DIM was 5.0% (range: 0, 45.0%).
Several studies have showed an association between reproductive tract diseases and negative energy balance. In Hammon et al. (2006), cows with metritis and cows with endometritis had significantly higher NEFA and higher BHBA blood concentrations from one to four WIM, compared to unaffected cows. Similarly, in Dubuc et al. (2010b), a blood BHBA concentration ≥ 1.1 mmol/L from one to seven DIM increased the odds of cytological endometritis and of PVD by 1.4 times (95% CI for the OR: 1.1, 2.0 and 1.0, 1.8, respectively), but it did not affect metritis risk.
38
Increased risk for mastitis
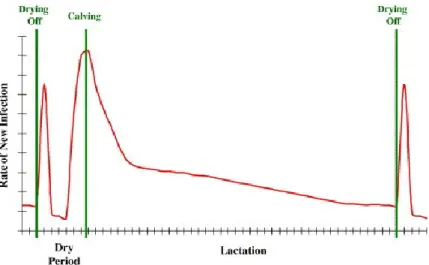
Mastitis is an inflammation of the mammary gland that is generally caused by bacterial pathogens. Clinical mastitis is characterized by local clinical signs such as abnormal secretion (clots or serum in milk), size, consistency or temperature of the mammary gland (one or more quarters). Systemic clinical signs might be present, depending on severity of mastitis (Ruegg et al., 2009). In Canada, similarly to other countries, the bacteria most commonly associated to clinical mastitis are Staphylococcus aureus streptococci, and coliforms (Reyher et al., 2011; Ruegg et al., 2015). To monitor clinical mastitis, besides the observation of local clinical signs, farmers frequently make a visual observation of foremilk stripping against a black-colored strip plate (George et al., 2008). The susceptibility of the mammary gland to an intramammary infection (IMI) is the result of several factors (i.e. parity, stage of lactation, season; Rodriguez-Zas et al., 1997). For instance, there is generally higher rate of new infection just after drying off and around calving (Figure 5). Similarly, a peak in clinical mastitis incidence rate generally occurs just after calving (WIM one), followed by a declining toward the end of the lactation (Riekerink et al., 2008; Figure 6). The reasons for the higher susceptibility to IMI and clinical mastitis at the beginning of the lactation include dilution of the protective factors (e.g. lactoferrin) in milk, along with keratin plug break down and negative energy balance (Bradley and Green, 2004). In Riekerink et al. (2008) study, conducted in 106 herds from 10 Canadian provinces, the median herd-level incidence rate of clinical mastitis was 16.7 (range: 0.7, 97.4) cases per 100 cow-years.
39
Figure 5. Incidence of new intramammary infection during the dry period and lactation
The peak in new infection rate, after drying off, is considerably higher in cows not receiving any form of dry cow therapy.
(Source: Bradley and Green, 2004. The importance of the nonlactating period in the epidemiology of intramammary infection and strategies for prevention. Veterinary Clinics: Food Animal Practice. 20(3):547-68.)
© Reproduced from Bradley and Green (2004).
Figure 6. Distribution of incidence rate of clinical mastitis per week after calving The participating producers recorded clinical mastitis cases, defined as udders/quarters with visible signs of inflammation. IRCM: Incidence rate of clinical mastitis; ● primiparous, ■ multiparous.
(Source: Riekerink et al., 2008. Incidence rate of clinical mastitis on Canadian dairy farms. J Dairy Sci. 91(4):1366-77.)
40
In subclinical mastitis, milk appearance is normal even though an IMI is usually present. This form of mastitis is accompanied by increased milk somatic cell counts (SCC; i.e. inflammatory cells), which are mainly composed by phagocytes (macrophages and PMNL) and are essential for pathogen removal from the udder (Suriyasathaporn et al., 2000; Ruegg et al., 2009). Generally, IMI diagnosis would be made by milk bacteriological culture or polymerase chain reaction (PCR), but SCC is often used as a proxy for IMI. Using individual quarter milk samples, Schepers et al. (1997) concluded that a SCC of ≥ 200,000 cells/mL could be used to diagnose an IMI (defined using bacteriological milk analyses) with a Se and a Sp of 75% and 90%, respectively. The SCC should be measured using milk collected from individual quarters, since composite milk samples might impede ability to identify infected quarters’ due to dilution of inflammatory cells with milk from healthy quarters (Schepers et al., 1997). There are several other factors, besides IMI, affecting SCC: stage of lactation (late lactation), parity (older cows), season (summer) or time of the day (high just after milking up to four hours afterwards; Sharma et al., 2011). For instance, SCC from morning or from evening milking can vary considerably within the same quarter (Eisenberg et al., 2016). Another way to detect subclinical mastitis is to perform a California Mastitis Test (CMT), which makes a qualitative estimate of the amount of DNA present in milk (i.e. CMT disrupts the cell membrane of milk cells, allowing the DNA to react with the reagent, resulting in the formation of a gel), and correlates to the quantity of SCC in milk. It scores in five levels: negative, trace, +1, +2 and +3 (George et al., 2008). However, the CMT is not very sensitive in detecting infected quarters (Se = 0.27 and Sp = 0.80 using threshold ≥ +1) from cows without clinical mastitis (Kandeel et al., 2018). The bacteria most commonly associated to subclinical mastitis are coagulase-negative staphylococci (Reyher et al., 2011; Ruegg et al., 2015). In Haine (2016) study, the median herd-level prevalence of cows with SCC ≥ 200,000 cells/mL was 20.1% (range: 10.4, 33.3%).
Since the negative energy balance affects many of the functions exerted by phagocytes (the main factors for a successful udder defense), it leads to inefficient pathogen removal and, consequently, to an increased risk for mastitis. Table I summarizes the results obtained in some studies evaluating the relationship between hyperketonemia and mastitis. Collectively, these studies suggest that hyperketonemia is associated with increased odds of mastitis.