HAL Id: hal-01531268
https://hal-mines-paristech.archives-ouvertes.fr/hal-01531268
Submitted on 1 Jun 2017HAL is a multi-disciplinary open access archive for the deposit and dissemination of sci-entific research documents, whether they are pub-lished or not. The documents may come from teaching and research institutions in France or abroad, or from public or private research centers.
L’archive ouverte pluridisciplinaire HAL, est destinée au dépôt et à la diffusion de documents scientifiques de niveau recherche, publiés ou non, émanant des établissements d’enseignement et de recherche français ou étrangers, des laboratoires publics ou privés.
Vapor Liquid Equilibrium Data for the Furan-Toluene
Binary System between 313.02 and 352.99 K
Pascal Théveneau, Alain Valtz, Christophe Coquelet
To cite this version:
Pascal Théveneau, Alain Valtz, Christophe Coquelet. Vapor Liquid Equilibrium Data for the Furan-Toluene Binary System between 313.02 and 352.99 K. Journal of Chemical and Engineering Data, American Chemical Society, 2017, 62, pp.1168-1172. �10.1021/acs.jced.6b00424�. �hal-01531268�
Vapor liquid equilibrium data for the Furan - Toluene binary
system between 313.02 and 352.99 K
Pascal Théveneau, Alain Valtz, Christophe Coquelet*
Mines ParisTech, PSL Research University, CTP - Centre of Thermodynamics of Processes, 35 Rue Saint Honoré, 77305 Fontainebleau, France
Short communication
Abstract
The study presents p-T-x-y phase equilibria measurements of an oxygenated compound (furan) and one of its potential solvent of extraction (toluene). The experimental technique of the equipment recently developed is based on a “static analytic” method. Measurements were done at three temperatures (313.02, 333.02 and 352.99 K) and pressures from 13 up to 375 kPa. The experimental data measured were successfully correlated, using a “gamma phi” approach, with the NRTL activity coefficient model.
Keywords: furan, toluene, static analytic method, low pressure, NRTL
*Corresponding author: Pr. Christophe Coquelet E-mail: [email protected]
Graphical TOC JCED January 2017 0 50 100 150 200 250 300 350 400 450 500 0 0.1 0.2 0.3 0.4 0.5 0.6 0.7 0.8 0.9 1 P / kP a x1, y1
1. Introduction
Chemical and processes engineering require fluid thermodynamic models and accurate knowledge of phase diagrams. In effect, their knowledge is important for the design of efficient separation units like distillation and extraction1. A thermodynamic model allows prediction of thermophysical properties like densities, speed of sound and evaluation of phase diagrams. For example, phase diagrams can be used to predict distillation lines or residue curves for process separation. This step is very important for the design of separation units and to evaluate the difficulty of the separation. Successful design and simulation of separation units by process simulation software rely on accurate phase equilibrium computations using various thermodynamic models (equations of state and/or model of solution) that generally contain several empirical parameters. In the common engineering practice, the values of these parameters are adjusted, if possible, on different sets of experimental data such as limiting activity coefficient, heat of mixing, vapor–liquid or liquid–liquid equilibria (VLE, LLE, etc.), of the systems of interest. Measurements of accurate experimental data require efficient equipment. Recently, Zhang et al.2 have developed a new equipment for data acquisition of equilibrium properties at low pressure from 50 mbar to 10 bar using a “static-analytic method”. In their paper, it has been applied to investigate vapour liquid equilibrium properties of systems containing organic sulfur compounds. New sampling mechanisms were combined with ROLSI® capillary samplers3 to achieve on-line sampling for both vapor and liquid phases. Phase samples were directly sent to a gas chromatograph (GC) for composition analysis.
In this paper, new experimental data of the Furan + Toluene binary system are presented. Furan is an interesting molecule. It can be used as an intermediate in order to produce new molecules for pharmaceutical applications, for example. Also, it is possible to extract furan from bio-oil, produced from wood pyrolysis. Toluene can be a suitable extraction solvent. NRTL activity coefficient model4, based on a “gamma-phi” approach, is used to correlate experimental data. This system was previously studied by Nala et al.5 at atmospheric pressure using an ebulliometer. In this paper, we also propose to compare the results obtained using both techniques.
2. Experimental
2.1. Materials
The sources and the qualities of the used chemicals, as certified by the manufacturers, are presented in Table 1. Indices of refraction at the sodium D-line (nD) are also measured and compared with supplier values. Considering the high level of purity of these chemicals, no further purification or pretreatment were performed.
[Table 1]
2.2. Apparatus and Experimental Procedure
The equipment was previously presented and described by Zhang et al.2. The equilibrium cell is immersed in a thermo-regulated liquid bath (LAUDA Proline RP 3530 C). The temperature of the equilibrium cell was measured using two (Pt-100) platinum probes. The two probes were calibrated by comparison with a 25 Ω reference platinum probe (Tinsley, France). The accuracy of two probes was estimated as ± 0.02 K. Also, pressures were measured by three pressure transducers (General Electric, model UNIK 5000) with maximum absolute pressures of 0.35 bar, 1 bar and 10 bar, respectively. These pressure sensors were maintained at a constant temperature (353 K throughout this work) by means of PID regulator (FUJI, model PXE-4). The accuracy of the pressure transducers was estimated as ± 0.2 mbar after calibration. Both temperature and pressure signals were transmitted to a data acquisition unit (Agilent 34972A). Liquid and vapor samples were analyzed by means of a gas chromatograph (Perichrom, model PR-2100). A thermal conductivity detector (TCD) was calibrated and used to determine the molar composition of the two phases. The WINILAB III (Perichrom, France) data acquisition software was used for peak integration.
The calibration of the TCD was made by introducing known pure component volumes with appropriate GC syringes. The accuracies concerning the mole numbers are ±5% for furan and ±2% for toluene. The maximum standard uncertainty on liquid mole fractions was estimated about u(x,y)=0.013. The ZEBRON ZB-5 (5 µm, 30 m × 0.53 mm ID) GC wide bore column is used.
The uncertainty of the mole fraction was determined after calibration of the TCD.
Equation 1 reminds how is calculated the composition of component i (ncomp is the number of component in the mixture).
ncomp i i i i n n x (1)Equation 2 is used for the calculation of the uncertainty of mixture composition of component
i.
ncomp i i i i i cal u n n x x u j i 2 2 (2)Consequently, for a binary system, one can calculate uncertainty on mole fraction x1 by using
equation 3.
2 2 2 2 1 1 1 1 1 1 n n u n n u x x x ucal (3)Equation 4 reminds the combined standard temperature uncertainty on molar composition.
2
2 i rep i calib i u x u x x u (4) 3. CorrelationThe correlation of the experimental measurements was obtained using a “gamma phi” approach. In this work, the vapor phase is considered as an ideal phase. Eq. 5 is the DIPPR type equation used to calculate the pure component vapour pressure.
sat
E i C T DT T B A P ln ln (5)[Table 2]
The NRTL activity coefficient model is considered for the liquid phase. Eq. 6 is the expression of the excess Gibbs energy model based on NRTL model (Eqs. 7 and 8 details the calculation of the different parameters)..
n i n k k ki n j j ji ji i i E x G x G x RT x p T g 1 1 1 , , (6)n is the number of components in the system.
ij ij
ij G exp (7)
RT g gij ii ij (8)gij, gji, gii and gjj are interaction energies between two molecules. It is important to note that
0
and
jj ii jj
ii G
G . In our case, we have considered gij gii Cij CijT
T273.15
,
T ij ij C
C and are the adjustable binary parameters.
B
inary interaction parameters are fitted using the Simulis ThermodynamicsTM software package (from Prosim, Toulouse, France). Eq. 9 is considered as objective function (a Flash type algorithm is also considered for the calculation of equilibrium properties).
N xi xical yi yical N F 1 2 , exp , 2 , exp , 100 (9)N is the number of experimental data points and zi,exp and zi,cal are the experimental and
calculated compositions for each phase, respectively.
4. Results and discussion
The results are presented in Table 3.
We have checked the consistency of the data. For each isotherm we have determined the activity coeffcient of both species using experimental data and used the classical area test (Eq. 10).
i E E i i dP RT v dT RT h d x ln 2 (10)Densities of several mixtures of furan and toluene (Table 4) at 303.15 K were measured by Nala et al.5 using an Anton Paar DM5000 density meter with reported accuracy of ± 0.00001 g/cm3.
[Table 4]
We can notice that excess molar volumes are very low. Consequently, excess molar volume between these two species can be neglected.
As measurements have been done at constant temperature, Eq. 11 can be used for the classical area test.
i i id x ln 0 (11)Finally, after integration of Eq. 10, we obtained the final criteria (Eq. 12) for the classical area test. 0 ln 1 0 2 1 1
x (12)We have determined experimentaly the activity coefficient with Eq. 13.
sat i i i i P x Py (13)
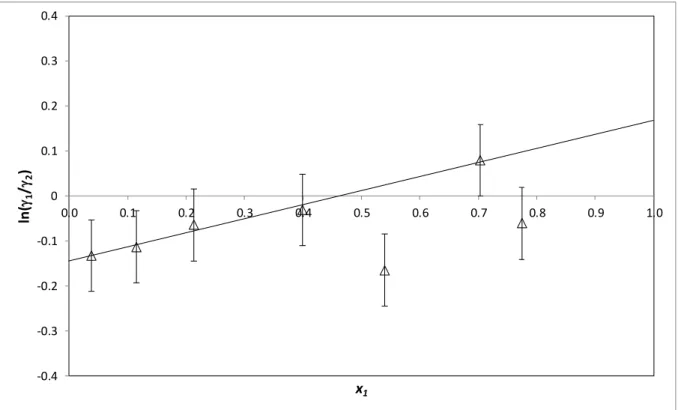
The uncertainty of the activity coefficients is determined considering the uncertainties of vapor and liquid compositions and uncertainty on pressure. The results are presented on Figures 1 to 3 for the different temperatures studied. We can conclude that the test is a success and so consider that the new data are consistent.
Table 5 presents adjusted NRTL activity coefficiant binary interaction parameters. Figure 4 presents the three isotherms and their modelling.
[Table 5] [Figure 1] [Figure 2] [Figure 3]
The performance of the model used to correlate the experimental data was evaluated by means of the following relative deviations, BIASz and AADz which are expressed by Eqs. 14 and 15.
N i cal i i z z N AADz 1 , exp , / 1 (14)
N i cal i i z z N BIASz 1 , exp , / 1 (15)where N is the number of experimental measurements. Results are presented in Table 6. As we can see, the data are well correlated by the model.
[Table 6]
[Figure 4]
Figure 4 reveals that an ideal Raoult’s law behaviour is observed. In order to confirm this observation, limiting activity coefficient of furan in toluene were determined using a gas stripping method. The apparatus is fully described in the recent publication by Zin et al.6. This technique is based on the evolution of vapor phase composition when the highly diluted solute (furan) of the liquid mixture in a dilutor cell is stripped by a constant flow of inert gas (helium). Eq. 16 reminds the expression used to calculate the apparent Henry’s law constant.
(16)
where D is the carrier gas flow rate (m3.s-1); N is the total number of moles of solvent inside the dilutor cell; VG (m3) is the volume of the vapor phase inside the dilutor cell; Si is the
chromatograph solute i peak area; t (s) is the time; T (K) is the temperature inside the cell; P (101 300 Pa) is the pressure inside the cell (around 1 atm); Psatsolv (Pa) is the saturation pressure of the solvent (i.e. toluene, see Eq. 5 and Table 2); and R (J.mol-1.K-1) is the ideal gas constant. Relative uncertainty concerning the apparent Henry’s law constant is estimated to be within ±5 %. The limiting activity coefficient is
sat i i i P H
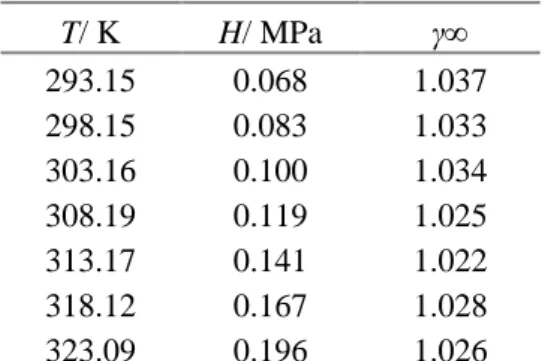
for furan (Pisat is the saturation pressure of the solute, see Eq. 5 and Table 2). Ideal gas law is considered for the gas phase. Results are presented in Table 7 and Figure 5. As we can see the limiting activity coefficient of furan in toluene is close to 1. It confirms the ideal solution behaviour observed.
[Table 7]
[Figure 5]
In the paper published by Nala et al.5 VLE data of the furan + toluene binary system were measured at atmopsheric pressure. We have predicted their experimental data using our developped model. The results are presented in Table 8 and plotted on Figure 6. As we can see, data from Nala et al. are well predicted (AAD x=0.008, BIAS x=0.007, AAD y=0.030 and BIAS y=0.031). Both sets of data (from Nala et al. and the new ones presented here) are in good agreement.
[Table 8]
5. Conclusions
New vapor liquid equilibrium data of the furan + toluene binary system were measured using the new equipment developped in the CTP research group2. This new equipment allows the mesurement of vapor liquid equilibrium properties at low pressure using the “static analytic method”. New data measured were correlated using the NRTL activity coefficient model in a gamma phi approach. Data measured by Nala et al.5 are in good agreement with the ones presented here.
References
[1] Coquelet, C. and Ramjugernath, D. Advances in Chemical Engineering, ISBN: 978-953-51-0392-9, Phase Diagrams in Chemical Engineering: Application to Distillation and Solvent Extraction (2012).
[2] Zhang, F. ; Théveneau, P. ; El-Ahmar, E. ; Canet, X. ; Soo, C.B. ; Coquelet, C. An improved static–analytic apparatus for vapor–liquid equilibrium (PTxy) measurement using modified in-situ samplers Fluid Phase Equilibria 2016, 409, 425-433
[3] ARMINES, Patent n° FR 2 8 53 414, Procédé et dispositif pour prélever des micro échantillons d’un fluide sous pression contenu dans un container (2003)
[4] Renon, H. and Prausnitz, Local composition in thermodynamic excess function for liquid mixtures J.M. AIChE J. 1968, 14, 135-144
[5] Nala, M.; Auger, E.; Gedik, I.; Ferrando, N.; Dicko, M.; Paricaud, P.; Volle, F.; Passarello, J.P.; de Hemptinne, J.C.; Tobaly, P.; Stringari, P.; Coquelet, C.; Ramjugernath, D.; Naidoo, P.; Lugo, R. Vapour–liquid equilibrium (VLE) for the systems furan + n-hexane and furan + toluene. Measurements, data treatment and modeling using molecular models Fluid Phase Equilib. 2013, 337, 234–245
[6] Zin, R.M.; Coquelet ,C.; Valtz, A.; Mutalib, M.I.A.; Sabil, K.M. Measurement of Henry’s Law Constant and Infinite Dilution Activity Coefficient of Isopropyl Mercaptan and Isobutyl Mercaptan in Methyldiethanolamine (1)+ Water (2) with w 1= 0.25 and 0.50 at temperature of 298 to 348K using Inert Gas Stripping Method, 2016 The Journal of Chemical Thermodynamics 2016, 93, 193-199
List of figures
Figure 1 : Classical area test concerning the measurements of VLE of the furan (1) + toluene (2) binary system at 313.02 K. Error bar: ±0.08
Figure 2 : Classical area test concerning the measurements of VLE of the furan (1) + toluene (2) binary system at 333.02 K. Error bar: ±0.08
Figure 3 : Classical area test concerning the measurements of VLE of the furan (1) + toluene (2) at 352.99 K. Error bar: ±0.08
Figure 4: Vapor – Liquid equilibrium isotherms for furan (1) + toluene (2) binary system: Symbols (this work): ■: 313.02 K, ▲, 333.02 K;●: 352.99 K solid lines, calculated results using NRTL activity coefficient model.
Figure 5: Logarithm of limiting activity coefficient of furan in toluene as a function of inverse temperature. Error bar is calculated by considering ur(H)=0.05.
Figure 6: Vapor – Liquid equilibrium isotherm for furan (1) + toluene (2) binary system at atmospheric pressure. Solid line: prediction using our NRTL activity coeffcient model. Symbol: experimental data from Nala et al.
List of Tables
Table 1: Chemical sample.
Table 2: Vapor pressure correlation parameters from Simulis Thermodynamics™, Prosim, France. Range of validity: from triple point to critical point.
Table 3: Vapor liquid equilibrium of furan (1) + toluene (2) binary system at 313.02, 333.02 and 352.99 K.
Table 4: Experimental and calculate excess volume at 303.15 K for the system furan (1) + toluene (2) from Nala et al.5.
Table 5: NRTL binary interaction parameters for furan (1) + toluene (2) binary system Table 6: BIAS and AAD of liquid and vapor compositions for the three isotherms.
Table 7: Temperature dependence of Henry’s Law Constant for furan in toluene at atmospheric pressure.
Table 8: Vapor liquid equilibrium of furan (1) + toluene (2) binary system at atmospheric pressure (p=101.325 kPa) from Nala et al.5.
Table 1: Chemical sample Chemical name CAS number Source Initial purity (weight %)) Purification method Final purity Analysis method Refractive index (nD) Measured* at 20°C and 101.232 kPa Supplier
furan 110-00-09 Acros ≥99 None -- GC 1.4218 1.4197
1.4217
toluene 108-88-3 Acros 99.85 None -- GC 1.4966 1.4968
GC: Gas Chromatograph, * with Anton Paar Abbemat 300 Refractometer (standard uncertainty: refractive index
Table 2: Vapor pressure correlation parameters from Simulis Thermodynamics™, Prosim, France. Range of validity: from triple point to critical point.
Parameter Furan Toluene
A 74.738 76.945
B -5417 -6729.8
C -8.0636 -8.179
D 7.47 10-6 5.3017 10-6
Table 3: Vapor liquid equilibrium of furan (1) + toluene (2) binary system at 313.02, 333.02 and 352.99 K.
Experimental data
Calculated data using NRTL activity coefficient model
T/K= 313.02
P / kPa x1 u(x1) y1 u(y1) x1 y1
13.04 0.0381 0.0023 0.4389 0.0153 0.0435 0.4251 22.88 0.1147 0.0063 0.7147 0.0127 0.1245 0.7004 35.31 0.2131 0.0104 0.8329 0.0087 0.2244 0.8284 57.18 0.3990 0.0149 0.9221 0.0045 0.3954 0.9179 75.69 0.5399 0.0154 0.9599 0.0024 0.5367 0.9530 97.56 0.7037 0.0130 0.9743 0.0016 0.7013 0.9768 106.79 0.7744 0.0109 0.9844 0.0010 0.7705 0.9839 T/K= 333.02
P / kPa x1 u(x1) y1 u(y1) x1 y1
25.81 0.0309 0.0019 0.3143 0.0134 0.0333 0.3112 30.30 0.0491 0.0029 0.4316 0.0153 0.0533 0.4254 50.81 0.1455 0.0077 0.6956 0.0132 0.1435 0.6901 86.37 0.2985 0.0130 0.8520 0.0078 0.2956 0.8505 102.86 0.3632 0.0144 0.8851 0.0063 0.3646 0.8871 162.24 0.5942 0.0150 0.9595 0.0024 0.6078 0.9565 214.10 0.8156 0.0094 0.9873 0.0008 0.8170 0.9849 219.48 0.8383 0.0084 0.9872 0.0008 0.8387 0.9871 T/K= 352.99
P / kPa x1 u(x1) y1 u(y1) x1 y1
51.15 0.0303 0.0018 0.2785 0.0125 0.0332 0.2717 60.07 0.0651 0.0038 0.4025 0.0150 0.0564 0.3946 106.52 0.1966 0.0098 0.7069 0.0129 0.1753 0.7016 172.99 0.3568 0.0143 0.8539 0.0078 0.3404 0.8534 249.73 0.5489 0.0154 0.9303 0.0040 0.5256 0.9275 333.19 0.7367 0.0121 0.9729 0.0016 0.7230 0.9687 375.06 0.8342 0.0086 0.9867 0.0008 0.8215 0.9823
Table 4: Experimental and calculate excess volume a at 303.15 K b for the system furan (1) + toluene (2) from Nala et al.5.
x1 c /g.cm-3 /mol.cm-3 v / cm3.mol-1 vE /cm3.mol-1
0 0.8610 0.00934 107.016 0.000 0.100 0.8659 0.00965 103.631 -0.017 0.199 0.8712 0.00997 100.266 -0.047 0.387 0.8815 0.01064 93.962 -0.019 0.507 0.8889 0.01112 89.931 -0.008 0.591 0.8946 0.01148 87.098 -0.011 0.761 0.9075 0.01229 81.352 -0.031 0.89 0.9184 0.01299 77.006 -0.032 1 0.9283 0.01364 73.333 0.000 a
Table 5: NRTL binary interaction parameters for furan (1) + toluene (2) binary system
C12 C21 α12
/ cal.mol-1
Table 6: BIAS and AAD of liquid and vapor compositions for the three isotherms.
Temperature /K BIASx AADx BIASy AADy
313.02 -0.002 0.006 0.006 0.007
333.02 -0.002 0.004 0.002 0.003
Table 7: Temperature dependence of Henry’s Law Constant for furan in toluene at atmospheric pressure.
T/ K H/ MPa γ∞ 293.15 0.068 1.037 298.15 0.083 1.033 303.16 0.100 1.034 308.19 0.119 1.025 313.17 0.141 1.022 318.12 0.167 1.028 323.09 0.196 1.026 U(p, k=2)=0.06kPa, U(T, k=2) = 0.2K, ur(H) = 0.05
Table 8: Vapor liquid equilibrium of furan (1) + toluene (2) binary system at atmospheric pressure (p=101.325 kPa) from Nala et al.5.
Nala et al.5
Calculated data using NRTL activity coefficient model T/K x1 y1 x1 y1 383.78 0 0 0 0 381.66 0.007 0.068 0.008 0.068 381.96 0.010 0.076 0.007 0.058 380.20 0.013 0.111 0.014 0.111 379.11 0.017 0.154 0.019 0.143 377.88 0.029 0.214 0.024 0.178 376.20 0.036 0.283 0.031 0.223 375.47 0.037 0.289 0.034 0.242 372.75 0.045 0.361 0.046 0.311 369.97 0.068 0.441 0.060 0.376 364.81 0.098 0.560 0.087 0.485 363.12 0.106 0.577 0.096 0.517 360.26 0.125 0.637 0.113 0.568 357.97 0.136 0.665 0.128 0.607 352.97 0.168 0.733 0.162 0.681 348.26 0.207 0.792 0.199 0.742 340.60 0.289 0.867 0.270 0.823 336.59 0.326 0.888 0.314 0.857 334.07 0.353 0.901 0.345 0.877 330.13 0.414 0.927 0.397 0.903 324.67 0.481 0.945 0.483 0.934 320.78 0.552 0.958 0.554 0.952 318.02 0.610 0.966 0.610 0.963 312.33 0.758 0.981 0.748 0.982 308.67 0.869 0.989 0.854 0.991 305.98 0.958 0.995 0.944 0.997 305.00 0.995 0.996 0.979 0.999 304.55 1 1 0 1
-0.4 -0.3 -0.2 -0.1 0 0.1 0.2 0.3 0.4 0.0 0.1 0.2 0.3 0.4 0.5 0.6 0.7 0.8 0.9 1.0 ln ( 1 / 2 ) x1
Figure 1 : Classical area test concerning the measurements of VLE of the furan (1) + toluene (2) binary system at 313.02 K. Error bar: ±0.08
-0.5 -0.4 -0.3 -0.2 -0.1 0 0.1 0.2 0.3 0.4 0.5 0.0 0.2 0.4 0.6 0.8 1.0 ln ( 1 / 2 ) x1
Figure 2 : Classical area test concerning the measurements of VLE of the furan (1) + toluene (2) binary system at 333.02 K. Error bar: ±0.08
-0.6 -0.4 -0.2 0 0.2 0.4 0.6 0.0 0.1 0.2 0.3 0.4 0.5 0.6 0.7 0.8 0.9 1.0 ln ( 1 / 2 ) x1
Figure 3 : Classical area test concerning the measurements of VLE of the furan (1) + toluene (2) at 352.99 K. Error bar: ±0.08
0 50 100 150 200 250 300 350 400 450 500 0 0.1 0.2 0.3 0.4 0.5 0.6 0.7 0.8 0.9 1 P / kP a x1, y1
Figure 4: Vapor – Liquid equilibrium isotherms for furan (1) + toluene (2) binary system: Symbols (this work): ■: 313.02 K, ▲, 333.02 K;●: 352.99 K solid lines, calculated results using NRTL activity coefficient model.
-0.04 -0.03 -0.02 -0.01 0 0.01 0.02 0.03 0.04 0.05 0.06 0.003 0.00305 0.0031 0.00315 0.0032 0.00325 0.0033 0.00335 0.0034 0.00345 0.0035 Ln ( γ∞ ) 1/T /K-1
Figure 5: Logarithm of limiting activity coefficient of furan in toluene as a function of inverse temperature. Error bar is calculated by considering ur(H)=0.05.
250 270 290 310 330 350 370 390 0 0.1 0.2 0.3 0.4 0.5 0.6 0.7 0.8 0.9 1 T /K x1, y1
Figure 6: Vapor – Liquid equilibrium isotherm for furan (1) + toluene (2) binary system at atmospheric pressure. Solid line: prediction using our NRTL activity coeffcient model. Symbol: experimental data from Nala et al.5.


![La complexité syntaxique et l'efficacité argumentative dans des textes d'opinion argumentée produits par un élève sourd du 1er cycle du secondaireh[ressource électronique] : étude de cas](data:image/gif;base64,R0lGODlhAQABAIAAAP///wAAACH5BAEAAAAALAAAAAABAAEAAAICRAEAOw==)