Short communication: Genetic variation of saturated fatty
acids in Holsteins in the Walloon region of Belgium
V. M.-R. Arnould ,*1,2 H. Hammami ,* H. Soyeurt ,*† and N. Gengler *†
* University of Liège, Gembloux Agro-Bio Tech, Animal Science Unit, Passage des Déportés 2, B-5030 Gembloux, Belgium † National Fund for Scientific Research (F.N.R.S.), Rue d’Egmont 5, B-1000 Brussels, Belgium
ABSTRACT
Random regression test-day models using Legendre polynomials are commonly used for the estimation of genetic parameters and genetic evaluation for test-day milk production traits. However, some researchers have reported that these models present some undesirable properties such as the overestimation of variances at the edges of lactation. Describing genetic variation of saturated fatty acids expressed in milk fat might require the testing of different models. Therefore, 3 dif-ferent functions were used and compared to take into account the lactation curve: (1) Legendre polynomials with the same order as currently applied for genetic model for production traits; 2) linear splines with 10 knots; and 3) linear splines with the same 10 knots re-duced to 3 parameters. The criteria used were Akaike’s information and Bayesian information criteria, percent-age square biases, and log-likelihood function. These criteria indentified Legendre polynomials and linear splines with 10 knots reduced to 3 parameters models as the most useful. Reducing more complex models using eigenvalues seemed appealing because the result-ing models are less time demandresult-ing and can reduce convergence difficulties, because convergence properties also seemed to be improved. Finally, the results showed that the reduced spline model was very similar to the Legendre polynomials model.
Key words: spline , Legendre polynomials , random regression test-day model
Random regression test-day models (RRTDM) using Legendre polynomials (LP) remain a commonly used methodology for the estimation of genetic parameters and genetic evaluation for daily milk production traits (Misztal, 2006; Bohmanova et al., 2008). The current genetic evaluation model for production traits in the Walloon region of Belgium is a multiple-lactation,
mul-tiple-trait RRTDM using second-order LP (constant, linear, quadratic) for additive genetic and environ-mental effects (herd × year of calving and permanent environmental). Jamrozik and Schaeffer (2002) showed that RRTDM with orthogonal polynomials outperform models using lactation curves based on the Wilmink function (Wilmink, 1987) and the Ali and Schaef-fer function (Ali and SchaefSchaef-fer, 1987), even using the same number of parameters for additive genetic and environmental effects. Nevertheless, Bohmanova et al. (2008) reported that RRTDM using LP have undesir-able properties, mainly the overestimation of variances at the edges of lactation, which could be explained by lack of asymptotes of LP. López-Romero et al. (2004) reported also that LP models resulted in poor perfor-mance of fitting data at the extremes of lactations.
Mathematically speaking, splines are piecewise polynomial functions. They are defined as curves that consist of individual segments themselves connected in “knots.” The simplest case of a spline function is the linear spline where the segments are fitted by linear polynomials. Some previous research established that splines might be less sensitive to the data than LP and have been considered as a good alternative to polyno-mials (Druet et al., 2003; Meyer, 2005; Bohmanova et al., 2008).
For the new fatty acid traits expressed in milk fat (g/100 g of fat), models required are still under scru-tiny. Recently, Soyeurt et al. (2008) estimated genetic parameters for content of saturated and unsaturated fatty acids using a RRTDM with the similar order of LP for genetic and environmental effects. The current study aimed to compare different models to study genetic parameters of the milk saturated fatty acids production. Three functions were tested and compared to take into account the lactation curve: 1) Legendre polynomials with the same order as currently applied for genetic model for production traits, 2) linear splines with 10 knots, and 3) linear splines with the same 10 knots reduced to 3 variables. The comparison will be based on the goodness of models fit.
A total of 57,953 milk samples were collected between March 2005 and December 2007 from 3,140
primipa-doi: 10.3168/jds.2010-3049
© American Dairy Science Association®, 2010 .
4391 Received January 4, 2010.
Accepted May 5, 2010.
1
Corresponding author: valerie.arnould@convis.lu
2 Current address: Convis Zone Artisanale et Commerciale, 4 L-9004
rous Holstein (>84% Holstein blood) cows in 98 herds. Samples were collected during the official Walloon milk recording managed by the Walloon Breeders As-sociation (Ciney, Belgium). The samples were analyzed by mid-infrared spectrometry using a Foss Milkoscan FT600 (Foss, Hillerød, Denmark) by the milk commit-tee (Battice, Belgium). Records collected before 5 or after 365 DIM were discarded. Only test-day records from cows with age at first calving between 640 and 1,500 d were kept.
Test-day saturated fatty acid (SFA) content in fat (g/100 g of milk fat) was estimated from collected mid-infrared spectra using the calibration equation developed by Gembloux Agro-Bio Tech (Animal Sci-ence Unit, University of Liege, Gembloux, Belgium) and Walloon Research Centre (Quality Department, Gembloux, Belgium).
Figure 1 displays the variation of SFA throughout the first lactation. The content of SFA in fat increased until DIM 85 and then decreased with a slight increase at the end of the lactation. A similar trend was observed in reports in the literature (e.g., Soyeurt et al., 2008) for most SFA expressed in bovine milk fat. The mean value of test-day SFA was 64.99 (SD = 5.98; g/100 g of fat). The minimum and maximum values were 33.70 and 81.35 g/100 g of fat, respectively.
The data were analyzed with 3 RRTDM. The general matrix notation for these models was
y = Xβ + Q(Za + Zp + Wh) + e,
where y was the vector of observations (SFA content in milk, g/100 g of fat), β was the vector of fixed effects (herd × test day, stage of lactation: 20 classes of DIM, age at calving: 20 classes); a was the vector of additive genetic animal effect; p was the vector of permanent environment random effect; h was the vector of herd-year of calving. The Q matrix, which was the matrix of regressors, was different for the 3 models studied containing LP of order 2 (model LP), linear splines with 10 knots (model SP10) or linear splines reduced to 3 transformed variables (model SP3); X, Z, and
W were incidence matrices; and e was the vector of random residual effects.
In the SP10 model, 10 knots were equally spaced on the lactation curve (interval of 40 DIM). The chosen knots [T(i)] were 5, 45, 85, 125, 165, 205, 285, 325, and
365 DIM. Coefficients of linear splines were calculated as the interpolation coefficient between 2 adjacent knots as (Misztal, 2006):
if DIM = T(i), then φ(i) = 1,
if DIM is between T(i) and T(i+1), then φ(i) =
T DIM T T ( ) ( ) ( ) i i i + + − − ⎛ ⎝ ⎜⎜⎜ ⎜⎜ ⎞ ⎠ ⎟⎟⎟ ⎟⎟⎟ 1 1 = α, and φ(i+1) = 1 – α,
where φ(i) was the ith covariate at DIM t, and T(i) was
the ith knot. ARNOULD ET AL.
Figure 1. Saturated fatty acids content in fat (g/100 g of milk fat) from 5 to 365 DIM. The number of observations ranged from 10 to 83 for each DIM and from 301 to 930 for each class of 15 DIM.
With linear spline coefficients, all φ(i) are equal to
zero except when DIM is between T(i) and T(i+1).
There-fore, φ(i) vector had, at most, 2 nonzero elements, and
the sum of all elements was equal to 1.
Computational requirements for the SP10 model were obviously very high. To reduce the complexity of that model, it was reduced toward the SP3 model based on the reduction of the 10 knots applied to only 3 variables. To reduce the number of parameters, the eigenvectors of the obtained covariance matrices were calculated. In preliminary studies, it was shown that the first 3 eigenvectors of the genetic, permanent environment, and herd × year of calving (co)variance components were the 3 most important. This fact is in accordance with results reported by Druet et al. (2003) and Torres and Quaas (2001). The method applied to do the rank reduction was based on the elimination of dimensions with very small eigenvalues. In this study, the 3 retained eigenvalues explained 99.3% of the genetic variability. The different steps were as follows:
Step 1. Let G, H, and P be the 10 × 10 matrix of (co)variance components between the 10 ge-netic, herd × year of calving, and permanent environmental linear splines, respectively. These matrices were summed to a matrix of phenotypic (co)variance components (S) representing the (co)variances among the regressors.
Step 2. Create a 10 × 10 matrix R containing φ(i)
values for DIM included between DIM 5 and DIM 365. The dimensions of this matrix were (361, 10).
Step 3. Compute the (co)variance matrix V among the 361 test-days:
V = RSR’.
Step 4. Compute the eigenvalues and eigenvectors of
V matrix. Let the matrix of eigenvectors be
Vsp and that of the eigenvalues Dsp; Vsp is a
10-rank matrix.
Step 5. Create Vsp_red by choosing the 3 dimensions
with highest eigenvalues.
Step 6. Re-estimate new matrices Gred, Hred, and Pred
for these new regressions based on Vsp_red.
These matrices are 3-rank matrices.
For the 3 models, the genetic parameters for SFA were estimated by REML (Misztal, 2007). Average heritability values as the ratio of genetic variance σ
G 2
( )
to the sum of variances obtained for the genetic effect
σG2
( )
, the herd × year of calving σ( )
H2 , the permanent environment( )
σP2 , and the residual effect σ(
residuals2)
for DIM for SFA were defined as follows:Heritability G 2 G 2 H 2 P 2 residuals 2 = + + + σ σ σ σ σ .
The choice of optimal RRTDM was based on statisti-cal criteria. Akaike’s information criterion (AIC), de-veloped by Akaike (1973), is a measure of the goodness of fit of an estimated statistical model. This criterion is widely used in statistics for comparing models (e.g., Druet et al. 2003). Akaike proposed a simple and useful criterion for selecting the best-fit model among alterna-tive model. In the general case, the AIC presents the following form:
AIC = 2k − 2ln(L),
where k is the number of parameters in the statistical model, and L is the maximized value of the likelihood function for the estimated model. The model with the lower AIC, and thus with the highest value [ln(L)] for the number of parameters corrected log-likelihood, is considered as the best. The models were also compared by Bayesian information criterion (BIC) values. Sev-eral competing models may be ranked according to their BIC values, with the one having the lowest BIC being the best. In statistics, BIC is very closely related to AIC. However, the penalty for additional parameters is stronger than that of the AIC. The BIC is a criterion for model selection among a class of parametric models with different numbers of parameters. It was calculated as
BIC = −2ln(L) + k ln(λ),
where L is the maximized value of the likelihood function for the estimated model, k is the number of variance components estimated, and λ is the number of samples. The interpretation of BIC is analogous to AIC. Both correct for the number of parameters, but BIC also corrects for samples. Despite this correction, the basis of minus twice the logarithm of the likelihood (−2logL) is another useful measure to evaluate the fitness of models. In statistics, the likelihood function is a function of the parameters of a statistical model that plays a key role in statistical inference:
Log-likelihood function = −2log (L),
where L is the maximized value of the likelihood func-tion for the estimated model. Models with the lowest Log-likelihood function and therefore the highest log (L) are the best.
The last criterion is for the analysis of residuals. The percentage square biases (PSB; Ali and Schaeffer, 1987) was computed as PSB y x y r r r n r r n = − ⎛ ⎝ ⎜⎜⎜ ⎜⎜ ⎞ ⎠ ⎟⎟⎟ ⎟⎟
( )
× = =∑
∑
2 1 2 1 100,where yr was the rth observed record, xr was the rth predicted record, and n was the number of records. The model with the lowest PSB is the best one.
The models were also compared according to EBV. Sires with more than 10 daughters were ranked accord-ing to their EBV. Spearman rank correlation coefficients were computed for all models to assess the similarity (or lack thereof) between sire rankings obtained with the different applied models.
Table 1 reports model selection criteria. The AIC of the SP10 model was 23 and 28% higher than that for the SP3 and the LP models, respectively. The BIC of that model was also 28% higher than the BIC of LP model. In general, the AIC and the BIC values of SP3 model were closer to the values of LP model (AIC and BIC of LP were only 7 and 3% lower, respectively, than their corresponding values for the SP3 model). This was expected because the SP3 model had the same number of parameters as the LP model. The third criterion was the basis of −2logL. Similar observations were realized for the log-likelihood function. The obtained value for the SP10 model was approximately 28% higher than those obtained for the SP3 and LP models. These last 2 models were very close (less than 1% of difference). The PSB criterion evaluated the 3 models differently. Indeed, the lowest value of PSB was obtained for the SP10 model. This was expected because fitting 10 knots created a better fit, but at the expense of many more parameters. In general, the comparison of models based on AIC, BIC, and log-likelihood function favored the LP model.
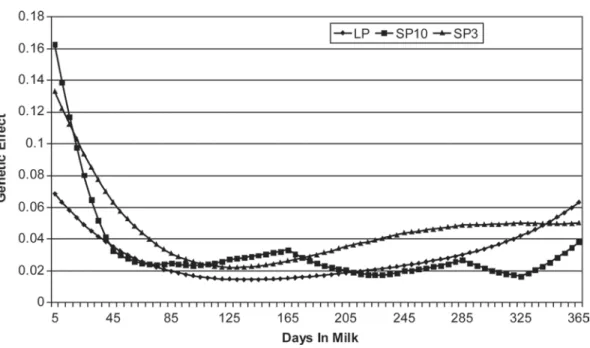
Trends of estimated genetic (co)variances among the first lactation for SP3, SP10, and LP models are shown in Figure 2. The overall obtained shape of the variance functions was similar among models with higher variances at the beginning. The model SP10 and, to a lesser extent, model SP3 showed very high
variances at the beginning of the lactation. All models showed a tendency to increase at the end of the lacta-tion, with LP reaching levels comparable to those at the beginning. As expected from the way linear splines are defined for the SP10 model, some parabolic shapes were observed in the genetic variance function. Accord-ing to Bohmanova et al. (2008), this parabolic shape is specific to linear splines and does not translate to a biological mechanism. Results for SP10 were most likely influenced by the way knots were distributed throughout the lactation. In this study, knots were equally spaced on the lactation curve (intervals of 40 DIM) and no efforts were made to optimize their loca-tion. As shown in the literature, the general shape of a spline variance function is usually influenced by the number of knots (e.g., Bohmanova et al., 2008). It can be also noticed that the SP3 shape is smoother than the SP10 shape. This seems to be logical because the SP3 model was obtained by reducing 10 knots (SP10 model) to 3 regressions. As reported earlier, the genetic variance for LP model showed a U shape, despite the fact that a herd × year of calving effect was introduced in the model. For production traits, Gengler and Wig-gans (2001) had shown that the inclusion of this effect could better catch variance at the beginning and at the end of the lactation. Unreasonably high variances at the beginning of the lactation were also reported in several studies, such as by Bohmanova et al. (2008) for production traits and by Soyeurt et al. (2008) for milk quality traits.
Figure 3 depicts the change of heritability values throughout the lactation. Large changes of heritability values for SFA in fat were observed throughout the first lactation. The SP10 model on one hand and the LP and SP3 models on the other hand showed different patterns throughout the first lactation. The shape fol-lowed by the SP10 model was very different from the shape obtained for the 2 remaining models. The trend of genetic variance obtained for the SP10 model was much smoother than the obtained trend of heritability. The irregularity of the trend of heritability could be ARNOULD ET AL.
Table 1. Estimates of Akaike’s information criterion (AIC), Bayesian information criterion (BIC), −2 log-likelihood, and percentage of squared bias (PSB)1 Item SP10 SP3 LP AIC 87.415 67.463 62.916 BIC 88.339 80.228 63.139 −2Log(L) 87.083 62.878 62.836 PSB 423.76 642.39 619.83 1
SP10 = splines with 10 knots; SP3 = linear splines with the same 10 knots reduced to 3 parameters; LP = Legendre polynomials.
explained by the permanent environmental component (not shown).
For LP and SP3 models, the highest value of heri-tability was observed at the beginning of the lactation (0.33). The minimum was close to 0.12 and was found around 140 DIM for the LP model. For the SP3 model, the lowest value was observed at the end and around 140 DIM of lactation and was close to 0.11. This
ob-servation could be due to the changes of energy status of the cow throughout the lactation. Energy balance is known to be negative at the beginning of the lactation, causing mobilization of adipose fatty acids. This could explain why the genetic part is higher in the early stage of lactation (Stoop et al., 2009). At the end of lacta-tion, the LP and SP3 models present different shapes. Heritability estimates by the LP model increased at the Figure 2. Variation of estimated genetic (co)variance over the first lactation. LP = Legendre polynomials; SP10 = splines with 10 knots; and SP3 = linear splines with the same 10 knots reduced to 3 parameters.
Figure 3. Variation of heritability values over the first lactation. LP = Legendre polynomials; SP10 = splines with 10 knots; and SP3 = linear splines with the same 10 knots reduced to 3 parameters.
end of the first lactation compared with estimates by SP3 model, which decreased.
Average heritability estimates throughout the lacta-tion were 0.12, 0.16, and 0.20 for LP, SP3, and SP10 models respectively. Heritability for SFA obtained in this study was similar to the value of 0.24 reported by Soyeurt et al. (2008), who used LP with the same polynomials as in the current study. According to a literature review done by Arnould and Soyeurt (2009), the estimates of heritability for milk quality traits differ very much among the studies. Also, few authors have reported heritability values of the milk quality trait defined here (SFA expressed in fat, g/100 g of fat). The ranking of animals for EBV using SP10, SP3, and LP did not change very much, which supports the use of simpler models such as SP3 and LP with reduced number of parameters.
This study aimed to compare different models to study genetic parameters of milk SFA production. The presented models gave similar overall shape of the ge-netic variance function. However, the trend of heritabil-ity was very different between models. The AIC, BIC, and log-likelihood function identified the LP and SP3 models as the most useful models. Model SP10 was the worst model for each function. Indeed, all function estimates were less favorable for this model. Using 10 splines (regressions) was also very computationally de-manding. Indeed, LP and SP3 models needed the least time to converge (2 h 50 min and 17 h 10 min, respec-tively) and had the lowest number of rounds (1,153 and 978). Convergence rate of SP10 model was much slower (more than 1 mo and more than 5,000 rounds).
Finally, SP10, SP3, and LP did not differ in the rank-ing of sires with respect to Spearman rank correlation. Hence, the 3 methods showed the same ability to rank sires based on their EBV.
Based on results from this study, the reduced SP3 model was very similar to the LP model. Except for the PSB value that was lowest for SP10 model (indicating that this model had the best fit), the AIC, BIC and, −2log(L) ranked the models in the same way. How-ever, SP3 was not found to be superior to LP. These 2 models require the same limited number of parameters. Results of this study indicated, therefore, that LP was the best among the compared models. Therefore, it can be expected that LP-based models could be used to model production of SFA in fat. However, our results for SP10 were most likely influenced by the way knots were distributed throughout the lactation. Recently, Jamrozik et al. (2010) studied the selection of locations of knots for linear splines in RRTDM. They concluded that optimal locations of knots (for linear splines) could vary according to the studied population, lactation, and
trait and according to the random effects. As work with new traits is in progress, additional research on this topic is required.
ACKNOWLEDGMENTS
The authors acknowledge the financial support pro-vided by the Walloon Regional Ministry of Agriculture (Ministère de la Région Wallonne, Direction Générale de l’Agriculture, Namur, Belgium) (D31-1178/S1 and D31-1224/S1). The authors acknowledge the Walloon Breeding Association (AWE) for its support. The first author is presently recipient of an AFR/FNR (Aide à la Formation Recherche/Fonds National de la Recherche Luxembourg) PhD grant (AFR PHD-09-119-RE). Ni-colas Gengler (research associate) and Hélène Soyeurt (postdoctoral researcher) acknowledge their support by the FNRS (National Fund for Scientific Research, Brussels, Belgium). Additional support of the, FNRS was provided by grants F.4552.05, 2.4507.02 F (2) and 2.4623.08. Helpful comments by J. Bohmanova (Center of Genetic Improvement of Livestock, University of Guelph, Ontario, Canada) are acknowledged.
REFERENCES
Akaike, H. 1973. Information theory and an extension of the maximum likelihood principle. Pages 267–281 in 2nd Int. Symp. Information Theory. B. N. Petrov and F. Csaki, ed. Akademiai Kiado, Budapest, Hungary.
Ali, T. E., and L. R. Schaeffer. 1987. Accounting for covariances among test day milk yields in dairy cows. Can. J. Anim. Sci. 67:637–644.
Arnould, V. M.-R., and H. Soyeurt. 2009. Genetic variability of milk fatty acids. J. Appl. Genet. 50:29–39.
Bohmanova, J., F. Miglior, J. Jamrozik, I. Misztal, and P. G. Sullivan. 2008. Comparison of random regression models with Legendre polynomials and linear splines for production traits and somatic cell score of Canadian Holstein cows. J. Dairy Sci. 91:3627– 3638.
Druet, T., F. Jaffrezic, D. Boichard, and V. Ducrocq. 2003. Modeling lactation curves and estimation of genetic parameters for first lactation test-day records of French Holstein cows. J. Dairy Sci. 86:2480–2490.
Gengler, N., and G. Wiggans. 2001. Heterogeneity in (co)variances structures of test-day yields. Interbull Bull. 27:179–184.
Jamrozik, J., J. Bohmanova, and L. R. Schaeffer. 2010. Selection of locations of knots for linear splines in random regression test-day models. J. Anim. Breed. Genet. 127:87–92.
Jamrozik, J., and L. R. Schaeffer. 2002. Bayesian comparison of random regression models for test-days yield in dairy cattle; Session 01, Breeding ruminants for milk production. Commun. No. 01–03 in 7th World Congress on Genetics Applied to Livestock Production, Montpellier, France.
López-Romero, P., R. Rekaya, and M. J. Carabano. 2004. Bayesian comparison of test-day models under different assumptions of heterogeneity for the residual variance: The change point technique versus arbitrary intervals. J. Anim. Breed. Genet. 121:14–25. Meyer, K. 2005. Random regression analyses using B-splines to model
growth of Australian Angus cattle. Genet. Sel. Evol. 37:473– 500.
Misztal, I. 2006. Properties of random regression models using linear splines. J. Anim. Breed. Genet. 123:74–80.
Misztal, I. 2007. BLUPF90 family of programs. University of Georgia. http://nce.ads.uga.edu/~ignacy/numpub/blupf90/ Accessed Jan. 2, 2007.
Soyeurt, H., P. Dardenne, F. Dehareng, C. Bastin, and N. Gengler. 2008. Genetic parameters of saturated and monounsaturated fatty acid content and the ratio of saturated to unsaturated fatty acids in bovine milk. J. Dairy Sci. 91:3611–3626.
Stoop, W. M., H. Bovenhuis, J. M. L. Heck, and J. A. M. van Arendonk. 2009. Effect of lactation stage and energy status on
milk fat composition of Holstein-Friesian cows. J. Dairy Sci. 92:1469–1478.
Torres, R. A. A., and R. L. Quaas. 2001. Determination of covariance functions for lactation traits on dairy cattle using random-coefficient regressions on B-splines. J. Anim. Sci. 79(Suppl. 1):112. (Abstr.)
Wilmink, J. B. M. 1987. Adjustment of test-day milk, fat and protein yields for age, season and stage of lactation. Livest. Prod. Sci. 16:335–348.