Material and Methods
• The surveillance plan was designed to detect a contamination rate of 2% in the sample population, with a probability of 95%.
• Several matrixes of pork and poultry were sampled and all samples were investigated two times (sample itself and a dilution of it, see Table 1)
• The analytical method used was a preenrichment in buffered peptone water (18h, 37°C), enrichment on Diassalm plate (24h, 42°C), isolation on xylose-lysine-desoxycholate agar (24h, 37°C), followed by biochemical characterisations (Api 20E).
• Isolates were then serotyped and tested for antimicrobial resistance by MIC method, some of them (S. Typhimurium, S. Enteritidis, S. Hadar and S. Virchow) were also lysotyped.
Introduction
• Salmonella is among the most important meat pathogen worldwide. The prevalence and the level of contamination are essential for an efficient risk assessment program but all the different serovars have not the same virulence potentiality. In 1998, the Belgian zoonosis surveillance program has assessed the contamination with Salmonella in a panel of meat.
Results and discussion
This study was financially supported by the Institute of Veterinary Expertise (Public Health).
Salmonella prevalence in foods from animal origin in Belgium
G. Daube1, Y. Ghafir1, JM. Dumont2,C. Godard4, H. Goossens5, JY. Francois1, M. Cornelis5, M. Jouret5,ML. Libotte-Chasseur2and L. De Zutter3
1 Food Microbiology, Faculty of Veterinary Medicine, University of Liege, Liege, Belgium 2Public Health Institute - Louis Pasteur, Brussels, Belgium
3Food Microbiology, Faculty of Veterinary Medicine, University of Gent, Gent, Belgium 4Pasteur Institute, Brussels, Belgium
5Medical microbiology, University of Antwerp, Belgium
6Institute of Veterinary Expertise (Public Health), Brussels, Belgium
Salmonella is frequently isolated from pork and poultry even in a little
quantity of matrix (Figure 1 and 2).
In pork, S. Typhimurium (with 17,5% of DT104, Table 2) and S. Derby represents more than the half of the isolates (Figure 3). In Layers (Figure 4),
S. Enteritidis (with 49,2% of PT4, Table 2) is isolated in at least 50% of the
cases. In broilers (Figure 5), S. Hadar appears as the major serotype just before S. Typhimurium. All isolates of turkeys belonged to S. Enteritidis (6 strains).
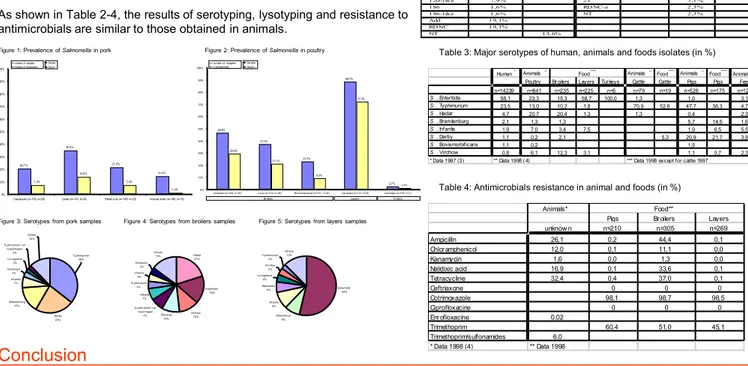
As shown in Table 2-4, the results of serotyping, lysotyping and resistance to antimicrobials are similar to those obtained in animals.
Sample 25-fold dilution
Porks Carcasses (skin) 554 cm2 23 cm2
Liver 646 cm2 27 cm2 Retail cuts 25g 1g Minced meat 25g 1g Broilers Carcasses 25g 1g Liver 25g 1g Boneless breast 25g 1g
Layers Carcasses (skin) 25g 1g
Turkeys Carcasses (skin) 25g 1g
Table 1: Matrixes and quantities tested.
20,7% 35,0% 21,5% 14,4% 7,3% 14,0% 7,4% 1,4% 0% 10% 20% 30% 40% 50% 60% 70% 80% 90% 100%
Carcasses (n=150, b=26) Lever (n=143, b=24) Retail cuts (n=149, b=23) minced meat (n=146, b=16)
Sample Diltuion n= number of samples b= number of enterprises
Human* Animals** Animals**
Food*** Animals**
Food*** Animals**
Poultry Br oilers Layers Tur keys Cattle Cattle Pigs Pigs Feed n=14239 n=841 n=235 n=225 n=6 n=79 n=19 n=526 n=175 n=128 S . Enteritidis 58,1 23,3 15,3 58,7 100,0 1,3 1,0 3,1 S . Typhimurium 23,5 13,0 10,2 1,8 70,9 52,6 47,7 36,3 4,7 S . Hadar 4,7 20,7 20,4 1,3 1,3 0,4 2,3 S . Brandenburg 2,1 1,3 1,3 5,7 14,5 1,6 S . Infantis 1,9 7,0 3,4 7,5 1,9 6,5 5,5 S . Derby 1,1 0,2 2,1 5,3 20,9 21,7 3,9 S . Bovismorbificans 1,1 0,2 1,5 S . Virchow 0,8 6,1 12,3 3,1 1,1 0,7 2,3
* Data 1997 (3) ** Data 1998 ( 4) *** Data 1998 except for cattle 1997 Food***
Table 3: Major serotypes of human, animals and foods isolates (in %)
Table 4: Antimicrobials resistance in animal and foods (in %)
S. Typhimurium S. Enteritidis
Pigs Br oilers Br oilers Layers Turkeys
n= 63 22 n= 36 130 6 1 18, 2% 1 5,3% 11, 5% 83, 3% 3 1,6% 4-like 72, 2% 49, 2% 16, 7% 4 1,6% 4a 0,8% 12 7,9% 5 2,3% 12- like 3,2% 6a-like 2,8% 3,8% 17 1,6% 6a 3,8% 40 1,6% 7-like 0,8% 66 4,5% 7 0,8% 104 17, 5% 40, 9% 8-like 11, 1% 2,3% 104-like 1,6% 12 9,2% 119 1,6% 20 2,8% 120 22, 7% 21- like 2,8% 10, 8% 120-like 7,9% 21 3,1% 186 1,6% RDNC-z 2,3% 186-like 1,6% NT 2,3% Add 19, 1% RDNC 19, 1% NT 13, 6%
Table 2: Results of lysotyping for S.Typhimurium and S. Enteritidis
Conclusion
•Salmonella is a common pathogen found in pork and poultry.
•Isolated strains belong to same serotypes, lysotypes and have similar antibiotic resistance profiles that those isolated in human and animals.
•An advanced analyze of results is needed in order to precise the sources of human salmonellosis. •The rate and the level, and thus the risk, is very higher in poultry than in pork.
•These results should be used to take preventive measures in order to lower the contamination rate and the resistance to antibiomicrobials of Salmonella.
•These results should be compared with those of others European countries (1). Derby 23% Brandenburg 15% Inf ant is 7% Goldcoast 3% Ty phimurium var Copenhagen 2% Ot hers 12% Ty phimurium 36% Liv ingstone 2% Hadar 21% Enteritidis 16% Virchow 12% Blockley 10% ty phim urium v ar copenhagen 7% Indiana 7% Ty phimurium 4% Inf ant is 4% Kentucky 4% Ot hers 15% Enteritidis 54% Braenderup 8% Inf ant is 9% Mbandaka 6% Liv ingstone 4% Virchow 3% Ty phimurium 3% Ot hers 13%
Figure 3: Serotypes from pork samples Figure 4: Serotypes from broilers samples Figure 5: Serotypes from layers samples
Bibliography
•(1) Trends and sources of zoonotic agents in animals, feeding stuff, food and man in the European Union in 1996. An evaluation of the trends reports provided for the year 1996 by the Member States to the European Commission according to Art. 5 of the Directive 92/117/EEC.
•(2) Annual report on Zoonoses in Denmark 1998, Ministry of Food, Agriculture and Fisheries, Denmark.
•(3) Surveillance des maladies infectieuses par un réseau de laboratoires de microbiologie (1997), Public Health Institute, Belgium.
•(4) Salmonella serotypes analysed at the VAR in 1998, Ministry of small enterprises, traders and agriculture, Veterinary and agrochemical research center.
Figure 1: Prevalence of Salmonella in pork Figure 2: Prevalence of Salmonella in poultry
46,6% 37,3% 23,2% 88,7% 2,7% 29,5% 21,1% 9,3% 72,3% 1,3% 0% 10% 20% 30% 40% 50% 60% 70% 80% 90% 100%
Carcasses (n=146, b=25) Lever (n=142, b=26) Boneless breast (n=151, n=22) Carcasses (n=141, b=6) Carcasses (n=150, b=1) Sample
Dilution n= number of samples b= n entreprises
Br oilers Layers Tur keys
Animals*
Pigs Br oilers Layers
unknow n n=210 n=305 n=269 Ampicillin 26,1 0,2 44,4 0,1 Chlor amphenicol 12,0 0,1 11,1 0,0 Kanamycin 1,6 0,0 1,3 0,0 Nalidixic acid 16,9 0,1 33,6 0,1 Tetracycline 32,4 0,4 37,0 0,1 Ceftriaxone 0 0 0 Cotrimoxazole 98,1 98,7 98,5 Ciprofloxacine 0 0 0 Enr ofloxacine 0,02 Trimethoprim 60,4 51,0 45,1 Trimethoprim/sulfonamides 6,0 * Data 1998 (4) ** Data 1998 Food**