D
emand for food production is expected to increase as the world’s population rises to 9 billion by 2050 (Wheeler and von Braun, 2013). At the same time, increased climate variability, higher temperatures, and projected frequent droughts and floods will make meeting this demand more difficult (Sundström et al., 2014; FAO, 2016). Understanding the poten-tial impacts and consequences of these climate risks has become a priority for agronomists and policymakers across the globe (Denton et al., 2014; Basso et al., 2015; Basso and Ritchie, 2018).Agronomic inputs can increase yield and, at the same time, mitigate the cli-matic and environmental footprint of agriculture (Basso et al., 2015; Basso and Ritchie, 2018). Higher yields typically return a larger amount of crop residues to the soil. It is important to maintain and increase soil organic carbon (SOC) to improving soil-based ecosystem services and the overall sustainability of agricultural systems (Jarecki et al., 2018). While there is a general agreement on soil management practices that can help farmers achieve greater yields, the interactions between management, soil, and climate remain poorly understood (Godfray et al., 2010).
Process-based crop simulation models are important tools to assess and predict the effect of nonlinear interactions between climate, soil, and manage-ment on crop productivity and environmanage-mental outcomes such as SOC stock, greenhouse gas emissions, and nitrate leaching (Jones et al., 2016). Models have been used extensively to evaluate the effects of rising temperatures and the increased frequency of extreme events on yields, and to design strategies to mitigate and adapt to climate change (Byjesh et al., 2010; Rötter et al., 2011; Donatelli et al., 2012; Asseng et al., 2013, 2014; Moradi et al., 2013; Rosenzweig et al., 2014; Basso et al., 2015; Chenu et al., 2017). There remains, however, a
Soil Organic Carbon and Nitrogen Feedbacks
on Crop Yields under Climate Change
B. Basso,* B. Dumont, B. Maestrini, I. Shcherbak, G. P. Robertson, J. R. Porter, P. Smith, K. Paustian, P. R. Grace, S. Asseng, S. Bassu, C. Biernath, K. J. Boote, D. Cammarano, G. De Sanctis, J.-L. Durand, F. Ewert, S. Gayler, D. W. Hyndman, J. Kent, P. Martre, C. Nendel, E. Priesack, D. Ripoche, A. C. Ruane, J. Sharp, P. J. Thorburn, J. L. Hatfield, J. W. Jones, and C. Rosenzweig
Copyright © American Society of Agronomy, Crop Science Society of America, and Soil Science Society of America. 5585 Guilford Rd., Madison, WI 53711 USA. This is an open access article distributed under the terms of the CC BY license (https://creativecommons. org/licenses/by/4.0/)
Supplemental material is available online for this article. Agric. Environ. Lett. 3:180026 (2018)
doi:10.2134/ael2018.05.0026
Received 27 May 2018.
Accepted 9 July 2018.
*Corresponding author ([email protected]).
Agricultural
&
Environmental
Letters
Research Letter
Abstract: A critical omission from climate change impact studies on crop yield is the interaction between soil organic carbon (SOC), nitrogen (N) availability, and carbon dioxide (CO2). We used a multimodel ensemble to predict the effects of SOC and N under different scenarios of temperatures and CO2 concentrations on maize (Zea mays L.) and wheat (Triticum aestivum L.) yield in eight sites across the world. We found that including feedbacks from SOC and N losses due to increased temperatures would reduce yields by 13% in wheat and 19% in maize for a 3°C rise temperature with no adaptation practices. These losses correspond to an additional 4.5% (+3°C) when compared to crop yield reductions attributed to temperature increase alone. Future CO2 increase to 540 ppm would partially compensate losses by 80% for both maize and wheat at +3°C, and by 35% for wheat and 20% for maize at +6°C, relative to the baseline CO2 scenario.
B. Basso, B. Maestrini, and D.W. Hyndman, Dep. of Earth and Environmental Sciences, Michigan State Univ., East Lansing, MI, USA; B. Dumont, Terra & AgroBioChem Dep., Gembloux Agro-Bio Tech–Univ. of Liege, Gembloux, Belgium; B. Basso, I. Shcherbak, and G.P. Robertson, W.K. Kellogg Biological Station, Michigan State Univ., East Lansing, MI, USA; J.R. Porter, Montpellier Supagro, 2 Place Pierre Viala, 34060 Montpellier Cedex 02, France; P. Smith, Institute of Biological and Environmental Sciences School of Biological Sciences, Univ. of Aberdeen, Scotland, UK; K. Paustian and J. Kent, Dep. of Soil and Crop Sciences, Colorado State Univ., Fort Collins, CO, USA; P.R. Grace, Institute for Future Environments, Queensland Univ. of Technology, Brisbane, Queensland, Australia; S. Asseng and J.W. Jones, Agricultural and Biological Engineering Dep., Univ. of Florida, Gainesville, FL, USA; S. Bassu, JRC, EU, Ispra, Italy; C. Biernath and E. Priesack, Institute of Biochemical Plant Pathology, Helmholtz Zentrum München-German Research Center for Environmental Health, Neuherberg, Germany; K.J. Boote, Dep. of Agronomy, Univ. of Florida, Gainesville, FL, USA; D. Cammarano, The James Hutton Institute, Invergowrie, Scotland, UK; G. De Sanctis, EFSA European Food Safety Authority Parma, Italy; J.-L. Durand, INRA, Unité de recherche pluridisciplinaire sur la prairie et les plantes fourragères (URP3F), Lusignan, France; F. Ewert, Institute of Crop Science and Resource Conservation (INRES), Univ. of Bonn, Bonn, Germany; S. Gayler, Institute of Soil Science and Land Evaluation, Univ. of Hohenheim, Stuttgart, Germany; P. Martre, INRA, UMR759, Lab. d’Ecophysiologie des Plantes sous Stress Environnementaux, Montpellier, France; C. Nendel, Institute of Landscape Systems Analysis, Leibniz-Centre for Agricultural Landscape Research (ZALF), Müncheberg, Germany; D. Ripoche, INRA, US1116-AGROCLIM, Avignon, France; A.C. Ruane and C. Rosenzweig, Climate Impacts Group, NASA Goddard Institute for Space Studies, New York, NY, USA; J. Sharp, The New Zealand Institute for Plant and Food Research, Christchurch, New Zealand; P.J. Thorburn, CSIRO Agriculture, St Lucia, Queensland, Australia; J.L. Hatfield, USDA–ARS National Soil Tilth Lab. for Agriculture and the Environment, Ames, IA, USA.
Core Ideas
• SOC decline, due to increased temperatures, reduces wheat and maize yields globally. • CO2 increase to 540 ppm partially compensates
yield losses due to increased temperatures. • Accounting for soil feedbacks is critical when
evaluating climate change impacts on crop yield.
Abbreviations:AgMIP, Agricultural Model Intercomparison and Improvement Project; SOC, soil organic carbon.
critical omission from all these projections—that changes in SOC occur concurrently with changes in air temperature and CO2 concentration.
Basso et al. (2015) pointed out that most crop models pre-viously used to predict climate change impact on yields did not account for the concomitant changes in SOC and soil nitrogen (N) content over time (Asseng et al., 2013, 2014; Bassu et al., 2014; Basso et al., 2015), as the models were reinitialized every year to same soil water, N, and C levels to evaluate the effects of climate alone.
Given the importance of SOC and N to crop productiv-ity and the potential for climate change to affect SOC stocks, it is important to rectify this omission, especially since post-COP21 there have been numerous initiatives aimed at increasing SOC as a climate change mitigation measures (e.g., 4 per 1000 initiative in France; https://www.4p1000.org).
We hypothesize that yields will decrease under higher temperature because of the shorter vegetative period (Asseng et al., 2014; Bassu et al., 2014), whereas an increase in CO2 may partially offset yield decline by increasing CO2 uptake and water use efficiency (Leakey et al., 2009). We also hypothesize that SOC levels will decline under future climate scenarios because the higher temperatures will decrease bio-mass and the amount of crop residues returned to the soil. Due to the lower biomass produced, N removal by crops will be lower, and with no reduction in N inputs will leave more fertilizer N available for subsequent loss to the environment. The objective of the study was to evaluate the feedbacks from SOC and N to future maize (Zea mays L.) and wheat (Triticum aestivum L.) yield under climate change.
Materials and Methods
To project soil C sequestration, inorganic N loss, and yield, we used quantitative ensemble modeling to simulate maize and wheat fallow rotations at eight sites around the globe (Australia, Argentina, India, and the Netherlands for wheat; Brazil, France, Tanzania, and the United States for maize) under different scenarios of temperature and CO2 concentrations. The sites were selected to represent a wide range of soil and growing conditions for these two crops. We simulated each site under different scenarios by testing all combinations of increased local temperature (-3, 0, +3, +6°C) and increased CO2 concentration (360 and 540 ppm).
We first investigated whether the impact of increased tem-perature on SOC and N dynamics varied across individual model responses based on the ratio of simulated change in crop yield per degree of temperature increase. We calculated the median of the model ensemble separately for every site. We used the coefficient of variation as an estimator of uncer-tainty due to model differences. Each ensemble comprised either seven wheat or five maize models with and without the inclusion of SOC dynamics (Supplemental Table S1) to evaluate crop model uncertainties for SOC, yield, soil N, and water under increased temperatures and CO2. Model simula-tions were generated for a 30-yr period to quantify the long-term dynamics of SOC, water, and N with the same model protocols as the maize and wheat pilots of the Agricultural Model Intercomparison and Improvement Project (AgMIP)
(Rosenzweig et al., 2013), where the models had previously been validated. The models were run using two distinct modes. In the first (reinitialized mode), we reinitialized SOC, soil N, and soil water annually to the same initial conditions every year, as in the previous AgMIP studies (Asseng et al., 2013; Bassu et al., 2014). In the second (continuous mode), the same models were run continuously for 30 yr, allowing the models to accumulate the effect of years of cultivation on SOC, soil N, soil water, and crop yield. The differences between reinitialized and continuous mode allowed us to understand how yield losses were affected by SOC decline under increased temperature and CO2 increase compared with yield decline due to temperature increase alone without accounting for the SOC and N loss feedbacks.
Results
On average, our continuous simulations projected a decrease in plant transpiration from -1 to -10 mm per degree of temperature increase due to a shorter growing season, smaller plants, and higher fraction of soil evaporation in total evapotranspiration (Fig. 1). Simulated yields decreased by 0.1 to 0.3 tonnes ha-1 for wheat and by 0.2 to 0.6 tonnes
ha-1 for maize for every degree of local temperature increase.
We found a correlation between the simulated soil nitrate content at the end of the season and temperature increase in the different scenarios; more specifically, we found that an increase in temperature determines an increase in soil nitrate content at the end of the season. Values ranged from 2.5 (US maize) to 29.3 (Australian wheat) kg N ha-1 (Fig. 1).
We found that uncertainty was at a minimum when we ran the model under the baseline scenario and that uncertainty
Fig. 1. Modeled average 30-yr changes in (A) yield, (B) transpi-ration, (C) soil nitrate, and (D) soil organic carbon (SOC) as a function of mean temperature increase over the range 0, +3°C,
+6°C, under [CO2] baseline conditions (360 ppm) for wheat
(empty bars: AR, Argentina; AU, Australia; IN, India; NL, the Netherlands) and maize sites (filled bars: BR, Brazil; FR, France; TZ, Tanzania; US, United States). For each boxplot, the black dot represents the median (50th percentile), while the bars span 25th to 75th percentiles and lines span 10th to 90th percentiles of model ensemble results.
increased with increasing temperature. The increase in uncertainties under increased temperature is a result of the different approaches implemented by models to account for the effects of increased temperatures on crop yield and on C and N dynamics. Our results show uncertainties that are of the same order of magnitude and corroborate the findings of earlier models (Asseng et al., 2013; Bassu et al., 2014). All the models agreed on the direction of change (Fig. 1).
The results of our simulations with the inclusion of SOC indicate that increased temperature will reduce future aver-age yield by 13% (+3°C) and 35% (+6°C) for wheat and by 19% (+3°C) and 32% (+6°C) for maize compared with base-line simulations (Table 1). We attribute these yield reductions under increased temperature mainly to the shorter effective growing period due to higher temperature’s accelerating plant development. When these yield losses were compared with yields obtained by only increasing temperature without the inclusion of SOC changes, the differences corresponded to additional yield losses of 4% (+3°C) and 5% (+6°C) in wheat and 5% (+3°C) in maize (Supplemental
Tables S4, S5).
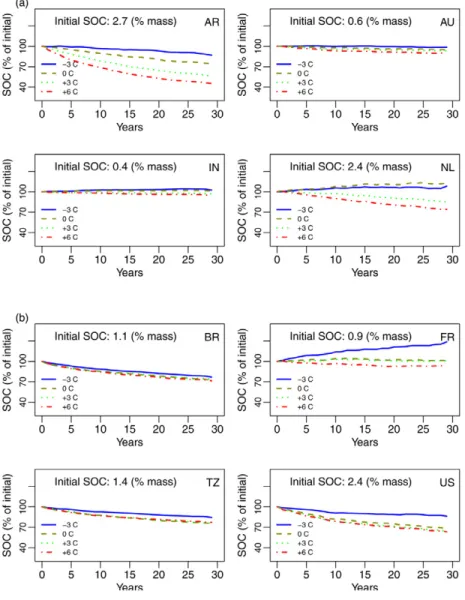
Simulated SOC changes on average decreased (relative to initial values) by 0.7 to 4.4% per year and per degree of temperature increase. We found that SOC decreased over time with increased temperatures, and sites with the highest initial SOC content exhib-ited the largest decrease (Fig. 2; Senthilkumar et al., 2009). Under lower temperature sce-narios (baseline and -3°C), as shown in Fig. 2, the French site gained SOC over time due to increased residue inputs (baseline) and/or slower decomposition (-3°C). However, all sites lost SOC with increased temperatures. With a 6°C temperature increase, the reduc-tion in SOC content after 30 yr ranged from 10 to 65% of initial values for wheat and 20 to 45% of initial values for maize. Under these high temperature change scenarios, maize sites that were initially below 1.5% SOC (i.e., Australia, India, Brazil, France, and Tanzania) showed a nonlinear change over time, with smaller rela-tive changes occurring after the first years.
The cumulative difference between N input (mineral N fertilizer applied, N from crop residues) and the N removed from the system (leached N at end of the growing season, annual unused N, N used by the crop) indi-cate that N losses exceed N input for all com-binations of sites and temperature and that N losses increased with temperature (Galloway et al. 2004).
Discussion
Our results suggest that reductions in residues returned to the soil, lower SOC levels, and lower soil N availability pose an additional threat to crop yields for
Table 1. Relative percentage changes of simulated yields (model ensemble) for the different sites and temperature levels compared to
the baseline scenario. Negative values depict the inability of [CO2] to
compensate for the loss of yield associated to the concomitant impact of soil organic C decline and temperature increase, while positive values indicate a mitigation of yield losses.
Site† Temperature change, [CO2] kept at 360 ppm
−3°C Baseline +3°C +6°C Wheat AR -4.13 0.00 -12.89 -34.93 AU -28.20 0.00 -17.74 -41.08 IN 3.07 0.00 -16.58 -47.82 NL -0.67 0.00 -3.90 -16.86 Avg. wheat -7.48 0.00 -12.78 -35.17 Maize BR -12.50 0.00 -5.51 -22.98 FR -39.27 0.00 -13.44 -20.06 TZ -4.65 0.00 -38.98 -60.70 US -6.15 0.00 -18.93 -25.23 Avg. maize -15.64 0.00 -19.21 -32.24
† AR, Argentina; AU, Australia; IN, India; NL, the Netherlands; BR, Brazil ; FR, France; TZ, Tanzania; US, United States.
Fig. 2. Simulations of the soil organic carbon (SOC) stocks (0–25 cm) for the different
sites under scenarios with different temperature and constant CO2 concentration
(360 ppm). The lines represent the median of the model ensemble predictions for the site and scenario. The site abbreviations (a) for wheat are Argentina (AR), Australia (AU), India (IN), and the Netherlands (NL) and (b) for maize are Brazil (BR), France (FR), Tanzania (TZ), and the United States (US).
key agricultural sites worldwide unless new adaptation strategies (changes in planting dates, new cultivars, N fertilization, disease prevention, and pest control) are implemented.
Future temperature increases are expected to reduce maize and wheat yields; however, results confirmed our hypothesis that the concurrent increments of CO2 will par-tially compensate for these losses (Table 2), echoing a large body of literature (Long, 1991; Kimball et al., 2002; Long et al., 2006; Leakey et al., 2009). Increasing CO2 concentration to 540 ppm reduced losses due to temperature increase by 80% in wheat and by 81% in maize in the +3°C scenario and by 35% (wheat) and 20% (maize) in the +6°C scenario. Lower temperatures have the most detrimental effect for maize cul-tivated in France (Supplemental Fig. S1); because this site is the coldest among the ones in this study, a -3°C in tempera-ture would prevent the plants from receiving enough degree days to reach maturity (Bassu et al., 2014). On the opposite side, an increase of 6°C would be most detrimental for maize grown in Tanzania (Supplemental Fig. S1), the warmest of our sites (Bassu et al., 2014).
We showed that the predictions from our model ensem-ble agree with the current paradigm that increased tempera-tures accelerate crop development and thereby effectively shorten the growing season, consequently lowering yields, biomass production, and crop residues returned to the soil. Under higher temperature scenarios at nonirrigated sites, the removal of N in the form of harvested grain will decline, resulting in higher reactive N losses due to unused soil N (Supplemental Fig. S9, S10, S11).
Results of this study also demonstrate that it is critical to take into account changes occurring in the soil as the result of management, as these changes will shape the design of future strategies to adapt to and mitigate increased climate variability and change globally.
Supplemental Material
Supplemental information is available online. The supplemental material reports the simulations protocols, the multimodel
ensemble, and additional details on the uncertainty analysis and on soil organic C and N dynamics under climate change.
Conflict of Interest Disclosure
The authors declare no competing financial interests. The views expressed in this paper are the views of the authors and do not necessarily represent the views of the organization or institution to which they are currently affiliated.
Author Contributions
B.B. conceived and motivated the study. B.B., B.D., G.P.R, P.S., J.R.P., and K.P. led the writing of the paper; B.B., B.D., B.M, and I.S. analyzed the data; S.A., F.E., P.M., J.-L. D., and S.B. analyzed and provided the AgMIP wheat- and maize-pilots data; B.B., B.D., B.M, I.S.G.P.R., J.R.P., P.S., K.P., P.R.G. S.A., S.B., C.B., K.J.B., D.C., G.D.S., J.-L.D., F.E., S.G., D.W.H, J.K., P.M., C.N., E.P., D.R., A.C.R., J.S. P.J.T., J.L.H., J.W.J., and C.R. carried out crop model simulations, discussed the results, and contributed to writing the paper.
Acknowledgments
Support was provided by the UKAID for its primary financial support to the Agricultural Model Intercomparison and Improvement Project (AgMIP). Additional funding was provided by USDA–NIFA under awards 2015-68007-23133, 2011-67003-3025, and 2011-68002-30190, the FACCE JPI MACSUR project (031A103B) through the metaprogram Adaptation of Agriculture and Forests to Climate Change (AAFCC) of the French National Institute for Agricultural Research (INRA), and the Swiss National Science Foundation (project number 167689). We thank Anne Stanton and two anonymous reviewers for very helpful comments on an earlier draft.
References
Asseng, S., F. Ewert, P. Martre, R.P. Rötter, D.B. Lobell, D. Cammarano, B.A. Kimball, M.J. Ottman, G.W. Wall, J.W. White, M.P. Reynolds, P.D. Al-derman, P.V.V. Prasad, P.K. Aggarwal, J. Anothai, B. Basso, C. Biernath, A.J. Challinor, G. De Sanctis, J. Doltra, E. Fereres, M. Garcia-Vila, S. Gayler, G. Hoogenboom, L.A. Hunt, R.C. Izaurralde, M. Jabloun, C.D. Jones, K.C. Kersebaum, A.-K. Koehler, C. Müller, S. Naresh Kumar, C. Nendel, G. O’Leary, J.E. Olesen, T. Palosuo, E. Priesack, E. Eyshi Rezaei, A.C. Ruane, M.A. Semenov, I. Shcherbak, C. Stöckle, P. Stra-tonovitch, T. Streck, I. Supit, F. Tao, P.J. Thorburn, K. Waha, E. Wang, D. Wallach, J. Wolf, Z. Zhao, and Y. Zhu. 2014. Rising temperatures reduce global wheat production. Nat. Clim. Chang. 5(2):143–147. doi:10.1038/nclimate2470
Asseng, S., F. Ewert, C. Rosenzweig, J.W. Jones, J.L. Hatfield, A.C. Ruane, K.J. Boote, P.J. Thorburn, R.P. Rötter, D. Cammarano, N. Brisson, B. Basso, P. Martre, P.K. Aggarwal, C. Angulo, P. Bertuzzi, C. Biernath, A.J. Challinor, J. Doltra, S. Gayler, R. Goldberg, R. Grant, L. Heng, J. Hooker, L.A. Hunt, J. Ingwersen, R.C. Izaurralde, K.C. Kersebaum, C. Müller, S. Naresh Kumar, C. Nendel, G. O’Leary, J.E. Olesen, T.M. Osborne, T. Palosuo, E. Priesack, D. Ripoche, M.A. Semenov, I. Shcherbak, P. Steduto, C. Stöckle, P. Stratonovitch, T. Streck, I. Supit, F. Tao, M. Travasso, K. Waha, D. Wallach, J.W. White, J.R. Williams, and J. Wolf. 2013. Uncertainty in simulating wheat yields under climate change. Nat. Clim. Chang. 3(9):827–832. doi:10.1038/nclimate1916 Basso, B., D.W. Hyndman, A.D. Kendall, P.R. Grace, and G.P. Robertson.
2015. Can impacts of climate change and agricultural adaptation strat-egies be accurately quantified if crop models are annually re-initial-ized? PLoS One 10(6):e0127333. doi:10.1371/journal.pone.0127333 Basso, B., and J.T. Ritchie. 2018. Evapotranspiration in high-yielding maize
and under increased vapor pressure deficit in the US Midwest. Agric. Environ. Lett. 3(1):170039. doi:10.2134/ael2017.11.0039
Bassu, S., N. Brisson, J.L. Durand, K. Boote, J. Lizaso, J.W. Jones, C. Rosen-zweig, A.C. Ruane, M. Adam, C. Baron, B. Basso, C. Biernath, H. Boogaard, S. Conijn, M. Corbeels, D. Deryng, G. De Sanctis, S. Gay-ler, P. Grassini, J. Hatfield, S. Hoek, C. Izaurralde, R. Jongschaap, A.R. Kemanian, K.C. Kersebaum, S.H. Kim, N.S. Kumar, D. Makowski, C. Müller, C. Nendel, E. Priesack, M.V. Pravia, F. Sau, I. Shcherbak, F. Tao, E. Teixeira, D. Timlin, and K. Waha. 2014. How do various maize crop models vary in their responses to climate change factors? Glob. Change Biol. 20(7):2301–2320. doi:10.1111/gcb.12520
Table 2. Relative percentage changes of simulated yields when moving
from the baseline scenario ([CO2] = 360 ppm and DT = 0°C) to higher
temperature under and [CO2] of 540 ppm. Negative values depict
the inability of [CO2] to compensate for the loss of yield associated
to the concomitant impact of soil organic C decline and temperature increase, while positive values indicate a mitigation of yield losses.
Site† Temperature change, [CO2] increased to 540 ppm
−3°C Baseline +3°C +6°C Wheat AR – 6.29 -2.77 -20.70 AU – -2.64 -14.86 -35.80 IN – 26.91 3.17 -29.94 NL – 23.10 4.83 -5.03 Avg. wheat – 13.41 -2.41 -22.87 Maize BR – 28.97 2.11 -15.26 FR – 13.11 -5.22 -16.15 TZ – -1.77 -15.20 -55.98 US – 13.82 3.03 -15.35 Avg. maize – 13.53 -3.82 -25.69
† AR, Argentina; AU, Australia; IN, India; NL, the Netherlands; BR, Brazil ; FR, France; TZ, Tanzania; US, United States.
Byjesh, K., S.N. Kumar, and P.K. Aggarwal. 2010. Simulating impacts, poten-tial adaptation and vulnerability of maize to climate change in India. Mitig. Adapt. Strategies Glob. Change 15(5):413–431. doi:10.1007/ s11027-010-9224-3
Chenu, K., J.R. Porter, P. Martre, B. Basso, S.C. Chapman, F. Ewert, M. Bin-di, and S. Asseng. 2017. Contribution of crop models to adaptation in wheat. Trends Plant Sci. 22(6). doi:10.1016/j.tplants.2017.02.003 Denton, F., T.J. Wilbanks, A.C. Abeysinghe, I. Burton, Q. Gao, M.C. Lemos,
T. Masui, K.L. O’Brien, and K. Warner. 2014. Climate-resilient path-ways: Adaptation, mitigation, and sustainable development. In: C.B. Field, V.R. Barros, D.J. Dokken, K.J. Mach, M.D. Mastrandrea, T.E. Bilir, M. Chatterjee, K.L. Ebi, Y.O. Estrada, R.C. Genova, B. Girma, E.S. Kissel, A.N. Levy, S. MacCracken, P.R. Mastrandrea, and L.L. White, editors, Climate change 2014: Impacts, adaptation, and vulnerability. Part A: Global and sectoral aspects. Contribution of Working Group II to the Fifth Assessment Report of the Intergovernmental Panel on Cli-mate Change. Cambridge Univ. Press, Cambridge, UK. p. 1101–1131. Donatelli, M., A.K. Srivastava, G. Duveiller, and S. Niemeyer. 2012. Estimat-ing impact assessment and adaptation strategies under climate change scenarios for crops at EU27 scale. In: 2012 International Congress on Environmental Modelling and Software, Leipzig, Germany. 1 –5 July. https://www.iemss.org/publications/conference/2012proceedings/. Food and Agriculture Organization (FAO). 2016. The state of food and
ag-riculture. Climate change, agriculture, and food security. FAO, Rome. Galloway, J.N., F.J. Dentener, D.G. Capone, E.W. Boyer, R.W. Howarth, S.P.
Seitzinger, G.P. Asner, C.C. Cleveland, P.A. Green, E.A. Holland, D.M. Karl, A.F. Michaels, J.H. Porter, A.R. Townsend, and C.J. Vo. 2004. Ni-trogen cycles : Past, present, and future. Biogeochemistry 70:153–226. Godfray, H.C.J., J.R. Beddington, I.R. Crute, L. Haddad, D. Lawrence, J.F.
Muir, J. Pretty, S. Robinson, S.M. Thomas, and C. Toulmin. 2010. Food Security: The Challenge of Feeding 9 Billion People. Science 327(5967):812–818. doi:10.1126/science.1185383
Jarecki, M., B. Grant, W. Smith, B. Deen, C. Drury, A. VanderZaag, B. Qian, J. Yang, and C. Wagner-Riddle. 2018. Long-term trends in corn yields and soil carbon under diversified crop rotations. J. Environ. Qual. 47(4):635–643. doi:10.2134/jeq2017.08.0317
Jones, J.W., J.M. Antle, B. Basso, K.J. Boote, R.T. Conant, I. Foster, H.C.J. Godfray, M. Herrero, R.E. Howitt, S. Janssen, B.A. Keating, R. Munoz-Carpena, C.H. Porter, C. Rosenzweig, and T.R. Wheeler. 2016. Brief history of agricultural systems modeling. Agric. Syst. 155:240–254. doi:10.1016/j.agsy.2016.05.014
Kimball, B.A., K. Kobayashi, and M. Bindi. 2002. Responses of agricul-tural crops to free-air CO2 enrichment. Adv. Agron. 77:293–368. doi:10.1016/S0065-2113(02)77017-X
Leakey, A.D.B., E.A. Ainsworth, C.J. Bernacchi, A. Rogers, S.P. Long, and D.R. Ort. 2009. Elevated CO2 effects on plant carbon, nitrogen,
and water relations: Six important lessons from FACE. J. Exp. Bot. 60(10):2859–2876. doi:10.1093/jxb/erp096
Long, S.P. 1991. Modification of the response of photosynthetic productiv-ity to rising temperature by atmospheric CO2 concentrations: Has its
importance been underestimated? Plant Cell Environ. 14:729–739. doi:10.1111/j.1365-3040.1991.tb01439.x
Long, S.P., E.A. Ainsworth, A.D.B. Leakey, D.R. Ort, and J. No. 2006. Food for thought : Lower-than-expected crop yield stimulation with rising CO2 concentrations. Science 312(5782):1918–1922.
Moradi, R., A. Koocheki, M. Nassiri Mahallati, and H. Mansoori. 2013. Ad-aptation strategies for maize cultivation under climate change in Iran: Irrigation and planting date management. Mitig. Adapt. Strategies Glob. Change 18(2):265–284. doi:10.1007/s11027-012-9410-6 Rosenzweig, C., J. Elliott, D. Deryng, A.C. Ruane, C. Müller, A. Arneth, K.J.
Boote, C. Folberth, M. Glotter, N. Khabarov, K. Neumann, F. Piontek, T.A.M. Pugh, E. Schmid, E. Stehfest, H. Yang, and J.W. Jones. 2014. Assessing agricultural risks of climate change in the 21st century in a global gridded crop model intercomparison. Proc. Natl. Acad. Sci. USA 111(9):3268–3273. doi:10.1073/pnas.1222463110
Rosenzweig, C., J.W. Jones, J.L. Hatfield, A.C. Ruane, K.J. Boote, P. Thor-burn, J.M. Antle, G.C. Nelson, C. Porter, S. Janssen, S. Asseng, B. Basso, F. Ewert, D. Wallach, G. Baigorria, and J.M. Winter. 2013. The Agricultural Model Intercomparison and Improvement Project (Ag-MIP): Protocols and pilot studies. Agric. For. Meteorol. 170:166–182. doi:10.1016/j.agrformet.2012.09.011
Rötter, R.P., T. Palosuo, N.K. Pirttioja, M. Dubrovsky, T. Salo, S. Fronzek, R. Aikasalo, M. Trnka, A. Ristolainen, and T.R. Carter. 2011. What would happen to barley production in Finland if global warming ex-ceeded 4°C? A model-based assessment. Eur. J. Agron. 35(4):205–214. doi:10.1016/j.eja.2011.06.003
Senthilkumar, S., B. Basso, A.N. Kravchenko, and G.P. Robertson. 2009. Contemporary evidence of soil carbon loss in the U.S. Corn Belt. Soil Sci. Soc. Am. J. 73(6):2078–2086. doi:10.2136/sssaj2009.0044 Sundström, J.F., A. Albihn, S. Boqvist, K. Ljungvall, H. Marstorp, C.
Mar-tiin, K. Nyberg, I. Vågsholm, J. Yuen, and U. Magnusson. 2014. Future threats to agricultural food production posed by environmental deg-radation, climate change, and animal and plant diseases- a risk analy-sis in three economic and climate settings. Food Secur. 6(2):201–215. doi:10.1007/s12571-014-0331-y
Wheeler, T., and J. von Braun. 2013. Climate change impacts on global food security. Science 341(6145):508–513. doi:10.1126/science.1239402
![Fig. 1. Modeled average 30-yr changes in (A) yield, (B) transpi- transpi-ration, (C) soil nitrate, and (D) soil organic carbon (SOC) as a function of mean temperature increase over the range 0, +3°C, +6°C, under [CO 2 ] baseline conditions (360 ppm) for](https://thumb-eu.123doks.com/thumbv2/123doknet/6158655.157770/2.918.469.827.641.948/modeled-average-changes-function-temperature-increase-baseline-conditions.webp)