Columnar defects acting as passive internal field detectors
A. V. Silhanek,1,*L. Civale,1,†and M. A. Avila2,‡1
Comisio´n Nacional de Energı´a Ato´mica-Centro Ato´mico Bariloche and Instituto Balseiro, 8400 Bariloche, Argentina 2Instituto de Fı´sica ’’Gleb Wataghin,’’ UNICAMP, 13083-970, Campinas - SP, Brazil
共Received 24 September 2001; revised manuscript received 6 March 2002; published 3 May 2002兲 We have studied the angular dependence of the irreversible magnetization of several YBa2Cu3O7 and 2H-NbSe2single crystals with columnar defects tilted off the c axis. At high magnetic fields, the irreversible magnetization Mi(⌰) exhibits a well-known maximum when the applied field is parallel to the tracks. As the
field is decreased below H⬃0.02Hc2, the peak shifts away from the tracks’ direction toward either the c axis
or the ab planes. We demonstrate that this shift results from the misalignment between the external and internal field directions due to the competition between anisotropy and geometry effects.
DOI: 10.1103/PhysRevB.65.174525 PACS number共s兲: 74.60.Ge, 74.60.Jg, 74.72.Bk I. INTRODUCTION
It is a well established fact that the presence of columnar defects 共CD’s兲 in high-temperature superconductors
共HTSC’s兲 enhances the critical current (Jc) due to the strong pinning and the inhibition of thermal wandering when the flux lines lay into these tracks.1,2In the YBa2Cu3O7 共Y:123兲 compound, the directional pinning produced by these corre-lated structures becomes evident when the angular depen-dence of Jc is studied.3,4 In the last decade several works have shown that a sharp peak in Jc(⌰) appears when the applied field H is aligned with the direction (⌰D) of these linear defects1,3,5– 8共here ⌰ and ⌰Dare the angles formed by the crystallographic c axis with H and the CD, respectively兲. However, this behavior only holds when H is high enough to ensure that the average vortex direction is parallel to H. At lower fields, both material anisotropy and geometry effects become relevant and modify the vortex orientation,9 which consequently may not coincide with that of H. Since maxi-mum pinning occurs when the vortex orientation 共given by the internal field B rather than by H) is aligned with the CD, Jc(⌰) should maximize at an angle ⌰max⫽⌰D. In other words, any misalignment between B and H manifests itself as a shift in the angular position of the peak in Jc(⌰) with respect to the tracks direction.
In fact, we have recently shown in Y:123 compounds that, if the anisotropy effect dominates over the geometry effect
共as occurs in most cases for HTSC compounds, as we will
show below兲, for fields lower than 10 kOe the peak progres-sively departs from the track orientation and shifts toward the c axis3 (兩⌰max兩⬍兩⌰D兩). In contrast, if the geometry ef-fect dominates over the anisotropy efef-fect 共as would be the case in more isotropic materials兲, the maximum in Jc(⌰) should move toward the ab plane (兩⌰max兩⬎兩⌰D兩). Although the latter effect has not been seen until now, Candia and Civale10have experimentally demonstrated that in the isotro-pic Pb0.9Tl0.1alloy, the sample shape determines the internal field direction. In that study it was shown that, regardless of the direction of H, at low fields the flux lines remain almost locked to the sample normal because the system gains energy by shortening the vortex length.
In this paper we present a study of the angular
depen-dence of the irreversible magnetization in several YBa2Cu3O7 and 2H-NbSe2 single crystals with a single set of CD’s tilted off the c axis. In particular, we study the mis-alignment between the external and the internal field direc-tions for several sample aspect ratios and anisotropies. We use the uniaxial pinning of the CD as a detector of the vortex orientation in the bulk of the samples. We clearly demon-strate the influence of the crystal shape in the determination of the vortex direction and find that the angular behavior of the critical current is well described by the competition be-tween material anisotropy and sample geometry.
II. THEORETICAL BACKGROUND
A complete description of the vortex lattice behavior in a superconducting material should include geometry effects, mass anisotropy, vortex-vortex, and vortex-defect interac-tions. Whenever the system is in thermodynamic equilib-rium, the internal field B is determined by minimization of the free energy G(B)⫽F(B)⫺B2/8⫹(B⫺H)•M/2 关Ref. 9, Eq. 共8.60兲兴. In this expression the magnetization M and the applied field H are related by H⫽B⫺4(1⫺ˆ )M, whereˆ is the tensor of demagnetization factor. The compo-nents ofˆ at the sample principal axes are (x,y,z), with
x⫹y⫹z⫽1. We adopt the notation that z coincides with the crystallographic c axis, and that the x axis is perpendicu-lar to both c and H. Standard minimization of G(B) with respect to By and Bz gives
4 F
Bi⫽Bi⫺ Bi⫺Hi
共1⫺i兲
, where i⫽y,z. 共1兲
In the intermediate-field regime (Hc1ⰆHⰆHc2) the free energy F(B) is given by 关Ref. 9, Eq. 共8.54兲兴,
F⫽ B 2 8⫹ ⌽0 2共4ab兲2 B⑀⌰ Bln
冉
Hc2c B⑀⌰ B冊
, 共2兲where ⌰B is the direction of the internal field, ⑀⌰B
⫽
冑
cos2⌰B⫹⑀2sin2⌰B, the anisotropy⑀⫽
冑
mab/mc⬍1, andab is the penetration depth for H储c.
We now write all the field dependencies in Eq. 共2兲 in terms of By and Bzand take the derivatives. To that end we replace B⑀⌰ B⫽
冑
⑀ 2B y 2⫹B z 2 . The result is 4 F By⫽By⫹ Hc2c 42 ⑀2B y B⑀⌰ B冋
ln冉
Hc2 c B⑀⌰ B冊
⫺1册
, 共3兲and an analogous expression forF/Bz, with Bzinstead of By and without the ⑀2 factor in the second term. Here
⫽ab/ab. By replacing into Eq.共1兲 we get Hc2c 42 ⑀2B y B⑀⌰ B
冋
ln冉
B⑀⌰ B Hc2c冊
⫹1册
⫽ By⫺Hy 1⫺y , 共4兲 Hc2c 42 Bz B⑀⌰ B冋
ln冉
B⑀⌰ B Hc2c冊
⫹1册
⫽ Bz⫺Hz 1⫺z . 共5兲Multiplying Eqs. 共4兲 and 共5兲 by (1⫺y)Bz/BH and (1
⫺z)By/BH, respectively, and subtracting, after some alge-bra we obtain sin共⌰B⫺⌰兲⫽⫺ f共y,z,⑀兲sin共2⌰B兲 82 ln h⫹1 h , 共6兲 where f (y,z,⑀)⫽(1⫺z)⫺(1⫺y)⑀2, the reduced field h⫽H/Hc2(⌰B,T), the angular-dependent upper critical field Hc2(⌰B,T)⫽Hc2c (T)/⑀⌰
B, and we replaced H⬇B in the
ar-gument of the logarithm.
The result 共6兲 only assumes uniaxial anisotropy and the coincidence of one principal axis with the c axis, and it shows that under those very general conditions the misalign-ments due to both mass anisotropy and sample geometry have the same field and temperature dependence. The func-tion f (ˆ ,⑀), which contains the combined effects of geom-etry and anisotropy, is the key ingredient of the low-field behavior, as its sign determines whether ⌰B leads or lags behind⌰.
To be more specific, let us consider the typical platelike shape of all the single crystals of both Y:123 and NbSe2used in this study, with thickness t along the c axis much smaller than the lateral dimensions Lxand Ly. To a first approxima-tion x⫽t/Lx andy⫽t/Ly; thusx,y,(1⫺z)Ⰶ1. If the material is strongly anisotropic and the crystal is not too thin, then (1⫺z)⬎(1⫺y)⑀2; thus f⬎0 and ⌰B⬎⌰. We will
call this the ‘‘anisotropy-dominated’’ situation. In contrast, for thin enough samples of a not too anisotropic material (1⫺z)⬍(1⫺y)⑀2, so ⌰B⬍⌰. This is what we will call the ‘‘geometry-dominated’’ case. The extreme limit of this case, with an infinite slab (x⫽y⫽0) and ignoring the an-isotropy, has been discussed by Klein et al.5It is also worth noting that for an infinite cylinder with axis perpendicular to
H, where the geometry effects are expected to cancel out,
x⫽0 andy⫽z⫽12, thus f⬀(1⫺⑀
2) and Eq. 共6兲 reduces to the well-known expression for the bulk 关Ref. 9, Eq.
共8.55兲兴.
Equation 共6兲 allows us to determine which should be the vortex direction ⌰B for a given angle ⌰ of the controlled variable H. To check whether this model describes the basic vortex lattice behavior when H is tilted away from the c axis, we will use the CD’s as internal field detectors, taking profit from the fact that Jcmaximizes when⌰B⫽⌰D. Thus, if we know⌰Dand⌰max共the angular position of the maximum in Jc), we are able to determine the misalignment ⌰B⫺⌰
⫽⌰D⫺⌰max. Although the sign of such misalignment is solely determined by the sign of f, its magnitude also de-pends on additional factors such as sin(2⌰B) and2. Besides that, the misalignment is strongly temperature and field de-pendent. It is easy to see from Eq.共6兲 that ⌰B→⌰ for large enough h. Throughout this paper we will change each of these factors in order to show that Eq. 共6兲 satisfactorily ac-counts for the observed properties.
At this point it is important to note that, although the misalignment between B and H is a low-field effect, Eq.共6兲 can only be used in the field range where Eq.共2兲 is valid, i.e., for HⰇHc1. It turns out that all our data are well described by Eq. 共6兲. However, the very dilute vortex limit is concep-tually interesting, and for completeness we will discuss it in the last section.
III. EXPERIMENTAL DETAILS
The Y:123 single crystals used in this work were grown by the self-flux method as described in Ref. 11 and exhibit a critical temperature of Tc⫽92 K. We also performed mea-surements on single crystals of the layered superconductor NbSe2with Tc⫽7.2 K. In all cases, columnar defects off the c axis were introduced by irradiation with 300 MeV Au26⫹ ions, using the TANDAR accelerator facility 共Buenos Aires, Argentina兲. Table I summarizes the information about geo-metrical dimensions, mass anisotropy, dose-equivalent TABLE I. Irradiation and shape specifications for all the crystals studied.
Crystal Material ⑀⫺1 B⌽ 共kOe兲 ⌰D t (m) Ly (m) Lx (m) y (⫻10⫺3) x (⫻10⫺3) f (ˆ,⑀) (⫻10⫺3)
A YBa2Cu3O7 7 30 32° 8.5 210 630 40 13.5 ⫹34 B YBa2Cu3O7 7 30 32° 20.9 715 2150 29 9.7 ⫹19 C YBa2Cu3O7 7 57 30° 11.5 1050 1050 11 11 ⫹1.8 D YBa2Cu3O7 7 22 57° 4.3 381 762 11.3 5.6 ⫺3.2 E NbSe2 3 0.5 27° 7.7 765 640 10.1 12 ⫺67 F NbSe2 3 0.5 27° 7.7 585 640 13.2 12 ⫺63.5 G NbSe2 3 0.5 27° 7.7 419 640 18.4 12 ⫺58
matching field B⌽, and angle⌰Dof the CD with respect to the c axis, for all the crystals measured.
The dc magnetization measurements were performed in a commercial superconducting quantum-interference device
共SQUID兲 magnetometer with two pickup coils, and both
components 共longitudinal Ml and transverse Mt) were re-corded. Samples could be rotated around the axis perpen-dicular to both the c axis and the CD. Two measuring pro-cedures were used. The first one consisted of collecting a set of isothermal magnetization loops, each one recorded at a fixed angle⌰. In the second one, which we developed more recently,12the sample is rotated in steps at fixed T and H, and
M is recorded at a dense set of orientations共the sample is not
rotating during the measuring scan兲. By appropriate process-ing, both methods allows us to obtain the irreversible mag-netization vector Mi(H,T,⌰), as described previ-ously.3,10,12,13
In general, the relation 共given by the critical state Bean model兲 between Mi and the various components of the an-isotropic Jc is complicated. However, for thin platelike samples, and as long as tan⌰⬍Ly/t⬃y⫺1 共which in all the crystals used in our study is true for almost all field orienta-tions, except in a very narrow angular range near ⌰⫽90°), due to purely geometrical constraints the following condi-tions are satisfied:14First, the pinning-related persistent cur-rents flow essentially parallel to the ab planes; thus only one component of Jcis involved. Second, Miis almost normal to the sample surface. Third, the geometrical factor that relates the modulus Mi with Jc is almost independent of ⌰. As a consequence, a measure of Mi(⌰,H,T) is equivalent to a measure of the in-plane Jc(⌰,H,T).
IV. EXPERIMENTAL RESULTS A. Anisotropy-dominated case
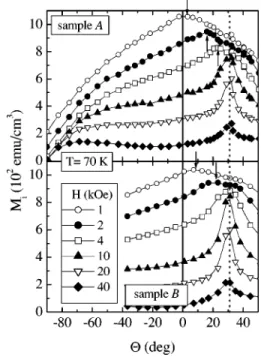
Figure 1 shows the angular dependence of the irreversible magnetization for Y:123 crystals A and B at T⫽70 K for several fields. The most evident feature in this figure is the asymmetry of Mi(⌰) around ⌰⫽0 arising in the uniaxial pinning due to the CD. For sample A at H⬎10 kOe, we observe the well-known peak at the track angular position
⌰D⫽32°, and at lower fields the peak progressively shifts away from ⌰D toward the c axis. A more complete set of curves showing the shift for this crystal at various T and H can be found in Ref. 3. A similar behavior is observed in crystal B, although the shift turns out to be smaller than that in A. These two crystals have the same anisotropy and irra-diation conditions, but different shapes. Thus, at the same T and H all factors in Eq. 共6兲 are identical, except for f (ˆ ,⑀). As seen in Table I, the difference in demagnetizing factors results in a smaller f (ˆ ,⑀) for sample B than for A. Hence, the misalignment in sample B is expected to be smaller, as indeed observed.
B. Compensated case
A striking result predicted by Eq.共6兲 is that the competing effects共anisotropy and geometry兲 could be exactly
compen-sated if one were able to tune the demagnetizing factors and the anisotropy in order to get f (ˆ ,⑀)⫽0, a condition that is satisfied for 1⫺z⫽(1⫺y)⑀2. For the Y:123 single crystals used in this work, with ⑀⬃1/7, this requires extremely thin samples with a big area. Table I shows that crystals C and D almost exactly satisfy this compensating condition, as the absolute values of their f (ˆ ,⑀) are, respectively, a factor of
⬃20 and ⬃10 smaller than in A. Figure 2 shows the angular
dependence of Mifor these two crystals at T⫽60 K. For the sake of clarity only a reduced set of fields is shown, and some curves have been shifted vertically. Since the CD ori-entations ⌰D in samples C and D are different, in order to compare them we set the abscissas as the relative angle ⌰
⫺⌰D. In this figure we clearly observe that the peaks re-main locked at the track direction even for the lowest fields, in complete agreement with the expectation. The same be-havior was observed for other temperatures.
C. Geometry-dominated case
So far, the four samples studied were Y:123 crystals with the same anisotropy but different geometries. On these samples we observed that the peak either shifts in the direc-tion of the c axis or almost does not deviate from the CD direction. As pointed out previously, this behavior arises from the strong anisotropy effect in this material. In order to change the sign of the deviation 共i.e., a shift toward the ab plane兲, we need to reduce the anisotropy effects. 共Table I shows that crystal D has f⬍0, thus strictly speaking it is in the geometry-dominated case, but the shift is too small to be detected兲.
FIG. 1. Angular dependence of the irreversible magnetization as a function of the applied field at T⫽70 K for the samples A and B
共Y:123兲. The arrows indicate the angular position, ⌰max, of the
maximum in Mi(⌰) for the lowest fields. For clarity, some curves
To that end we decided to measure NbSe2 single crystals, which have ⑀⬃1/3, making the anisotropy effect about 5 times smaller than that in the Y:123 single crystals. Besides this, very large and thin NbSe2crystals can be readily found, and they can be easily cut to obtain the desired shape. So we irradiated a rectangular crystal 共labeled as sample E), such that it is in the extreme geometry-dominated case, with f (ˆ ,⑀)Ⰶ0. Figure 3共a兲 shows Mi(⌰) for this sample at T
⫽4.4 K for several H. At high fields we observe a peak at
the track direction⌰D⫽27°. As the field decreases the peak becomes broader and, in contrast to the Y:123 crystals ob-served behavior, it progressively moves away from ⌰D to-ward the ab plane, in agreement with a negative f (ˆ ,⑀).
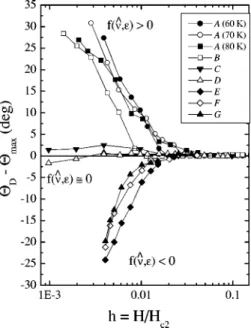
The conclusive evidence that the function f (ˆ ,⑀) domi-nates the behavior of the misalignment ⌰B⫺⌰ comes from samples F and G, which are pieces of crystal E. These samples were obtained by cutting the sample E along a line parallel to its shortest side, in such a way that the demagne-tizing factor x remains unaltered, but y increases. In this way, the absolute value of the function f (ˆ ,⑀) was progres-sively reduced, i.e., we moved away from the ‘‘extreme geometry-dominated case’’ and approached the ‘‘compen-sated case’’共see Table I兲. According to Eq. 共6兲, the deviation of the maximum in Mi(⌰) for given H and T should become progressively smaller for crystals F and G as compared to crystal E. This is in fact observed, as demonstrated in Fig. 4, where ⌰max⫺⌰D for crystals E, F, and G is plotted as a function of h⫽H/Hc2(T,⌰).
The misalignments for all the Y:123 crystals shown in Figs. 1 and 2 are also included in Fig. 4. Thus, this figure summarizes all the samples studied in the present work at various temperatures and fields. The three possible low-field behaviors are clearly visible: anisotropy-dominated 共upward curvature兲, geometry-dominated 共downward curvature兲 and compensated 共almost horizontal curves兲. It is worth noting that, in all the noncompensated cases and for both materials, the misalignment between B and H becomes relevant for fields below a certain characteristic field H⬃0.02Hc2.
D. Quantitative test of the model
The above results clearly demonstrate that the qualitative differences in the low-field behavior are controlled by the
FIG. 2. Irreversible magnetization as a function of the relative angle ⌰⫺⌰D for several fields at T⫽60 K in samples C and D 共Y:123兲. For clarity, some curves have been shifted vertically.
FIG. 3. Angular dependence of the irreversible magnetization for sample E(NbSe2) at共a兲 T⫽4.4 K for several fields 共in units of
kOe兲, 共b兲 H⫽0.15 kOe for several temperatures. The arrow 共up, right兲 indicates the maximum shift of the peak as predicted by the very-low-field limit共see text兲.
FIG. 4. Deviation in the maximum of the irreversible magneti-zation with respect to the track direction⌰D⫺⌰maxas a function of
factor f (ˆ ,⑀). We now want to verify whether the H and T dependence of the shift is well described by the model. Ac-cording to Eq. 共6兲 these two variables appear only through the combination h⫽H/Hc2(⌰B,T). Thus, 兩⌰D⫺⌰max兩 should increase not only with decreasing H at fixed T, as already seen in Figs. 1 and 3共a兲, but also with decreasing T at fixed H, due to the increase in Hc2(T). This second expec-tation is also verified, as shown in Fig. 3共b兲 where Mi(⌰) for sample E was plotted at the constant field H⫽0.15 kOe for several temperatures.
The equivalence between the variations in T and H is quantitatively verified in the main panel of Fig. 5, where sin(⌰max⫺⌰D)/ f (ˆ ,⑀) is plotted as a function of h for the two sets of data shown in Figs. 3共a兲 and 3共b兲. We observe quite a good scaling, thus confirming that h is the appropriate variable. The upper critical field values Hc2(kG)⫽51.8(1
⫺t) were taken from the literature;15thus the superposition of the two curves involves no free parameters. This equiva-lence between T and H variations is also verified in Y:123 crystals, as demonstrated by the superposition of the three curves of sample A corresponding to different temperatures when plotted as a function of h in Fig. 4.
Finally, we analyze the quantitative effect of the factor f (ˆ ,⑀). This factor is a constant for a given sample, so it is the same for all the data in the main panel of Fig. 5. In contrast, in the inset we show the same scaling procedure for the crystals E, F, and G at T⫽4.4 K, so now f (ˆ ,⑀) is different for each sample, while all the other parameters re-main identical. We again obtain a good superposition of the data, although the scaling is poorer than in the main panel, probably due to the damage produced in the crystal after each cut process.
The solid line in the main panel of Fig. 5 depicts the expectation of Eq. 共6兲, with ⌰B⫽⌰D⫽27° as experimen-tally determined from the location of the maximum at high
fields, and a single fitting parameter⫽5.6. The same curve is shown in the inset. Although the value ⫽5.6 is smaller than the accepted value15 ⬃9, a similar discrepancy was reported by Zhukov et al. when studying the lock-in effect in Y:123 crystals by both twin boundaries7 and columnar defects.16 Moreover, in previous studies in Y:123 and ErBa2Cu3O7 共Er:123兲 crystals with tilted CD’s we had also found that both the misalignment between B and H at low fields3 and the width of the lock-in regime12 are well de-scribed using values of the penetration depth 共or equiva-lently, of the parameter in the formalism of the present work兲 about 3 times smaller than the accepted ones.
V. THE INFLUENCE OF THE CD’s
It is important to keep in mind that the shift in ⌰max at low h is not due to the CD’s. We are only using them as a passive tool to measure the vortex direction in the bulk of the samples, which is not easy to do by other methods. In fact, the pinning of the CD is not contained in Eq. 共6兲, which arises from the minimization of a free energy, and thus de-scribes a state of thermodynamic equilibrium. It is obvious, on the other hand, that the uniaxial pinning of these corre-lated structures is relevant and should be considered. How-ever, the key point in the context of the present study is that the incorporation of the pinning due to the CD into the sce-nario does not modify the previous results, as we show be-low.
Correlated pinning is usually included in the analysis6,9by adding to the free energy共2兲 a term Fpinthat accounts for the correction to the vortex self-energy due to the linear or pla-nar defects, and then comparing the energy of alternative configurations. 共The procedure is described in Ref. 9, Sec. IX A 1 for the case of twin boundaries and Sec. IX B 5 for the case of CD’s.兲 This additional contribution depends on the orientation of the vortices and the tracks, Fpin
⫽Fpin(⌰B,⌰D), and it is always negative, reflecting the fact that, for ⌰B⫽⌰D, the CD’s promote the formation of stair-case vortices whose self-energy is lower than that of a straight vortex at the same average orientation. Due to the increase of the core trapped fraction, Fpin(⌰B) decreases
共becomes more negative兲 as ⌰B→⌰D, and minimizes for that orientation, where the vortex cores are totally trapped into the tracks.
Of course Fpin(⌰B) introduces an additional modification to the angle between B and H. Namely, it will tend to shift the vortices towards⌰D, that is, a kind of effective angular attractive potential towards the CD orientation will develop. But this will not modify Eq.共6兲. Indeed, if H is applied at the angle ⌰⫽⌰maxsuch that, in the absence of pinning and ac-cording to Eq. 共6兲, the vortices would be at the angle ⌰B
⫽⌰D, the only effect of adding the term Fpin(⌰B) 共which also minimizes at ⌰B⫽⌰D) will be to deepen the already existing minimum of the free energy at this orientation, with-out changing the angle.
Let us now suppose that H is applied at an angle ⌰ slightly smaller or slightly larger than⌰max. In the absence
FIG. 5. Main panel: sin(⌰max⫺⌰D)/ f (ˆ,⑀) vs h for the two sets
of data shown in Figs. 3共a兲 and 3共b兲 for the sample E. Solid sym-bols: H fixed and T swept. Open symsym-bols: T fixed and H swept. Inset: the same scaling shown in the main panel for samples E, F, and G. The solid line in both, main panel and inset, corresponds to Eq.共6兲 with ⌰B⫽⌰D⫽27° and⫽5.6.
of pinning, vortices would respectively orient at angles⌰B slightly smaller or slightly larger than⌰D, according to Eq.
共6兲. The addition of the term Fpin(⌰B) will shift those angles closer to ⌰D. In particular, for 兩⌰⫺⌰max兩⬍L, the influ-ence of Fpin(⌰B) will be so strong that the system will mini-mize its free energy by orienting the vortices exactly along the CD. This is the well known lock-in effect, namely, that the internal field remains locked to⌰Dover a finite range of
⌰, and L(h) is called the lock-in angle. In previous works3,12 we have extensively studied this effect, which manifests in our measurements as a plateau in Mi(⌰) of width 2L. Note that the center of the plateau coincides with
⌰max. Thus, although the relation⌰Bvs⌰ will be modified by the CD, the angle ⌰max, experimentally defined as the maximum in Mi(⌰) or as the center of the plateau where necessary, will still be given by Eq. 共6兲.
A natural consequence of the previous analysis is the fact that the matching field B⌽ does not play any role in our scenario. Having more vortices than CD’s or vice versa will modify the strength of the pinning, which is measured by the magnitude of Mi(⌰), but not the angular location of the maximum,⌰max, which is determined solely by the fact that vortices and CD’s are aligned.
As a final comment it is worth mentioning that, although
L⬀1/h, similarly to the misalignment between B and H, the physical origin of both effects is totally different. Indeed, in NbSe2 we observe the shift but not the plateau associated with the lock-in, probably because the pinning of the CD is less effective in this material as compared to the Y:123 and Er:123 compounds.
VI. THE VERY-LOW-FIELD LIMIT
For completeness, we now consider the very-low-field limit, although it does not apply to our data. In this limit only nearest-neighbor共NN兲 vortex-vortex interactions need to be taken into account; thus
F⬇BHc1共⌰B兲
4 关1⫹g共B兲兴, 共7兲
where Hc1(⌰B)⬇Hc1 c ⑀
⌰B.
In an isotropic material, the sum of the six equal contri-butions from the NN gives g(B)⫽kr⫺1/2e⫺r, where k
⫽(6/ln)
冑
/2⬃1; r⫽a/ and a⫽冑
⌽0/B is the vortex lattice parameter. In this limit rⰇ1, thus g(B)Ⰶ1. In the anisotropic case, g(B) must be modified to account for the angular dependence of, and for the distortion of the trian-gular lattice. Regardless of the details, it is clear that in this case g(B) will still be exponentially small at low enough vortex densities, and the same is true for the derivatives (g/Bi). Thus, replacement of Eq. 共7兲 into Eq. 共1兲 givesHc1c ⑀ 2sin⌰ B ⑀⌰B 关1⫹y共B兲兴⫽ Hy⫺yBy 1⫺y , 共8兲 Hc1c cos⌰B ⑀⌰B 关1⫹z共B兲兴⫽ Hz⫺zBz 1⫺z , 共9兲
wherei(B), which account for NN interactions, are expo-nentially small in the limit of B→0.
By taking the ratio of both components, we can calculate the relation between ⌰ and ⌰B for the first vortex to pen-etrate, ⑀2tan⌰ B⬇ 共Hy⫺yBy兲共1⫺z兲 共Hz⫺zBz兲共1⫺y兲 ⬇ 共1⫺z兲 共1⫺y兲 tan⌰. 共10兲
So, in the very dilute limit the system is in the geometry-dominated case for ⑀2(1⫺y)⬎(1⫺z) and in the anisotropy-dominated case for ⑀2(1⫺y)⬍(1⫺z), exactly the same result that we had found for intermediate fields.
Equation共6兲 predicts that the misalignment grows indefi-nitely as h→0, even allowing for ⌰B and⌰ to lay in differ-ent quadrants. As an extreme case, that equation has no real solution when the absolute value of its right-hand side be-comes larger than unity. These clearly unphysical results are just a manifestation of the inapplicability of Eq. 共6兲 at very low fields. As an example, we can estimate the field at which the peak in Mi(⌰) is predicted to coincide with the ab plane (⌰⫽90°) for sample E. The result is h⬇0.0013, or H/Hc1
⬇0.09 关that is, H⬇25 Oe in Fig. 3共a兲兴, clearly below the
lower limit of validity.共Note that, due to the strong demag-netizing effects, vortex penetration becomes energetically fa-vorable not at Hc1 but rather at a much smaller field Hc1*
⬃(1⫺z)Hc1⬃0.02Hc1for sample E.兲 In contrast, Eq. 共10兲 indicates that for this sample at very low fields the peak should be observed at⌰⬇88°, as marked with an arrow in Fig. 3共a兲.
Finally, we must note that the influence of the uniaxial pinning of the CD turns progressively stronger as h decreases and the term Fpinbecomes a significant fraction of the total free energy. At low enough fields the lock-in angle L⬀1/h covers most of the angular range 共this is essentially what Klein et al.5called flux-flop in their early work兲, thus produc-ing a very broad plateau that turns our method inapplicable to determine ⌰max.
VII. CONCLUSION
In summary, we performed a detailed study of the influ-ence of anisotropy and sample geometry in the determination of the vortex orientation in bulk superconductors. We showed that these effects are relevant at low fields and be-come negligible at high fields. On top of that, we developed a model that correctly accounts for the sample shape, mass anisotropy, temperature, and field dependencies of the mis-alignment between the applied field and the vortex direction. We demonstrated that the sign of the misalignment is solely determined by a function that contains the combined effects of the anisotropy and the demagnetizing factors, and we pre-sented experimental examples of the three possible situa-tions, namely, anisotropy-dominated, geometry-dominated, and compensated cases. We finally discussed the very
low-vortex-density limit.
An important practical consequence of these results is that studies of the pinning properties of tilted CD’s that are based solely on measurements at H储CD, or on comparison of this orientation with a few others, give valid information at high fields, but are misleading at low fields: vortices are just not oriented in the right direction. To avoid this problem, a rather complete knowledge of the angular-dependent response is required.
ACKNOWLEDGMENTS
We are pleased to thank David J. Bishop for providing us with the NbSe2 single crystals and Juan A. Herbsommer for his valuable help in selecting crystals for irradiation. This work was partially supported by ANPCyT, Argentina, PICT 97 No. 01120 and by FAPESP, Brazil, Procs. Nos. 96/ 01052-7 and 96/05800-8. A.V.S. would like to thank the CONICET for financial support.
*Email address: [email protected]
†Present address: Superconductivity Technology Center, Los Ala-mos National Laboratory, Los AlaAla-mos, NM.
‡Present address: Ames Laboratory, Iowa State University, Ames, IA.
1L. Civale, A. D. Marwick, T. K. Worthington, M. A. Kirk, J. R. Thompson, L. Krusin-Elbaum, Y. Sun, J. R. Clem, and F. Holtzberg, Phys. Rev. Lett. 67, 648共1991兲.
2M. Konczykowski, F. Rullier-Albenque, E. R. Yacoby, A. Shau-lov, Y. Yeshurun, and P. Lejay, Phys. Rev. B 44, 7167共1991兲. 3A. V. Silhanek, L. Civale, S. Candia, G. Nieva, G. Pasquini, and
H. Lanza, Phys. Rev. B 59, 13 620共1999兲.
4A. V. Silhanek and L. Civale, Physica C 341-348, 1227共2000兲. 5L. Klein, E. R. Yacoby, Y. Wolfus, Y. Yeshurun, L. Burlachkov, B.
Y. Shapiro, M. Konczykowski, and F. Holtzberg, Phys. Rev. B 47, 12 349共1993兲.
6V. Hardy, A. Wahl, S. He`bert, A. Ruyter, J. Provost, D. Groult, and Ch. Simon, Phys. Rev. B 54, 656共1996兲.
7A. A. Zhukov, G. K. Perkins, J. V. Thomas, A. D. Caplin, H.
Ku¨pfer, and T. Wolf, Phys. Rev. B 56, 3481共1997兲.
8A. Herbsommer, J. Luzuriaga, L. Civale, G. Pasquini, and G. Nieva, Physica C 304, 112共1998兲.
9G. Blatter, M. V. Feigel’man, V. B. Geshkenbein, A. I. Larkin, and V. M. Vinokur, Rev. Mod. Phys. 66, 1125共1994兲.
10S. Candia and L. Civale, Semicond. Sci. Technol. 12, 192共1999兲. 11F. de la Cruz, D. Lo´pez, and G. Nieva, Philos. Mag. B 70, 773
共1994兲.
12M. A. Avila, L. Civale, A. V. Silhanek, R. A. Ribeiro, O. F. de Lima, and H. Lanza, Phys. Rev. B 64, 144502共2001兲.
13A. V. Silhanek, D. Niebieskikwiat, L. Civale, M. A. Avila, O. Billoni, and D. Casa, Phys. Rev. B 60, 13 189共1999兲.
14A. A. Zhukov, G. K. Perkins, Yu. V. Bugoslavsky, and A. D. Caplin, Phys. Rev. B 56, 2809共1997兲.
15P. de Trey, Suso Gygax, and J.-P. Jan, J. Low Temp. Phys. 11, 421 共1973兲.
16A. A. Zhukov, G. K. Perkins, J. V. Thomas, A. D. Caplin, H. Ku¨pfer, and T. Wolf, Physica C 282-287, 2155共1997兲.