HAL Id: hal-01611088
https://hal.archives-ouvertes.fr/hal-01611088
Submitted on 6 Nov 2018
HAL is a multi-disciplinary open access
archive for the deposit and dissemination of
sci-entific research documents, whether they are
pub-lished or not. The documents may come from
teaching and research institutions in France or
abroad, or from public or private research centers.
L’archive ouverte pluridisciplinaire HAL, est
destinée au dépôt et à la diffusion de documents
scientifiques de niveau recherche, publiés ou non,
émanant des établissements d’enseignement et de
recherche français ou étrangers, des laboratoires
publics ou privés.
A decision support system for robust humanitarian
facility location
Jorge Vargas Florez, Matthieu Lauras, Uche Okongwu, Lionel Dupont
To cite this version:
Jorge Vargas Florez, Matthieu Lauras, Uche Okongwu, Lionel Dupont. A decision support system
for robust humanitarian facility location. Engineering Applications of Artificial Intelligence, Elsevier,
2015, 46 (Part B, SI), p. 326-335. �10.1016/j.engappai.2015.06.020�. �hal-01611088�
A decision support system for robust humanitarian facility location
Jorge Vargas Florez
a, Matthieu Lauras
b,c, Uche Okongwu
c,n, Lionel Dupont
baDepartment of Engineering, Pontifical University Catholic of Peru, Peru bDepartment of Industrial Engineering, University of Toulouse, Mines Albi, France
cDepartment of Information, Operations and Management Science, Toulouse Business School, 20 Boulevard Lascrosses, 31000 Toulouse, France
Keywords:
Humanitarian supply chain Stochastic Multi-Scenarios Program Facility location
Pre-positioning Efficiency Resilience
a b s t r a c t
Each year, more than 400 natural disasters hit the world. To be more responsive, humanitarians organize stocks of relief items. It is an issue to know the quantity of items to be stored and where they should be positioned. Many authors have tried to address this issue both in industrial and humanitarian environments. However, humanitarian supply chains today do not perform correctly, particularly as regards resilience and efficiency. This is mainly due to the fact that when a disaster occurs, some hazards can strongly impact the network by destroying some resources or collapsing infrastructure. The expected performance of the relief response is consequently strongly decreased. The problem statement of our research work consists in proposing a decision-making support model in artificial intelligence dedicated to the humanitarian world and capable of designing a coherent network that is still able to adequately manage the response to a disaster despite failures or inadequacies of infrastructure and potential resources. This contribution is defined through a Stochastic Multi-Scenarios Program as a core and a set of extensions. A real-life application case based on the design of a humanitarian supply chain in Peru is developed in order to highlight the benefits and limits of the proposition.
1. Introduction
Today, humanitarian professionals face new challenges in the context of their activities. Donors in particular impose more and more drastic guarantees on the proper use of funds made available in case of crisis. Although very common in the business world, this requirement is very new in this sector, almost in contradiction with the doctrines and fundamentals of the humanitarian world. Another challenge clearly lies in the ability of humanitarian organizations to integrate several performance dimensions in their reasoning. The approach of simply responding quickly to an emergency situation is no longer satisfactory. The performance of the humanitarian response to crisis should be measured not only according to its speed of execution, but also according to its ability to minimize costs, to allow high flexibility, to limit its environmental footprint or to maximize its (media) visibility.
These contextual elements raise the issue of developing artifi-cial intelligence (AI) tools, espeartifi-cially decision-support systems that the key actors can use for evaluating and defining operational solutions to be implemented. In the face of this observation, many researchers, in the past 15 years, have widely carried out studies
and proposed tools and methods in this field. Authors such as
Natarajarathinam et al. (2009), andPeres et al. (2012)have studied
this phenomenon and observed that a big majority of the pub-lished works (more than 50% of articles) are based on analytical models, and in particular on mathematical programming models. However, in practice today, very few humanitarian organizations (not to say none) use tools stemming from AI as decision-making support tools. This point demonstrates the big gap that yet today separates academics and practitioners in the field of humanitarian activities, more especially humanitarian logistics. In attempt to bridge this gap, authors such as Kovács and Spens (2007) and
Peres et al. (2012) identified very concrete research themes and
particularly made the following suggestions:
– Given that humanitarian workers evolve in very uncertain environments, scientists should consider these uncertainties in a much more systematic way, within the framework of their research works.
– Researchers should try to come up with answers to the new efficiency requirements facing humanitarian organizations, and should not just confine themselves to the improvement of responsiveness.
Nevertheless, it would be difficult to take these two suggestions into account in only one research work given that the scope and spectrum of issues in a supply chain are very vast. Therefore, we have decided in this paper to focus only on the configuration and nCorresponding author. Tel.: þ33 561 294 862; fax: þ33 561 294 994.
E-mail addresses:[email protected](J. Vargas Florez),
[email protected](M. Lauras),
[email protected](U. Okongwu),
dimensioning of a humanitarian supply chain (HSC). Though location and sizing problems can be considered to have attained maturity from a scientific standpoint, their implementation in the humanitarian context encounters two major difficulties:
– the difficulty of having access to the data necessary for the elaboration and the validation of their models;
– the difficulty of assessing the severity of the disrupted situation once the disaster has been established to be true.
This paper aims to address these difficulties by studying the design of a HSC associated with recurring disasters, for example, cyclones in the Caribbean, earthquakes along the ring of fire, and floods in South-East Asia. These small-and-medium-scale crises constitute a very big percentage of emergency interventions by humanitarian organizations. For these particular crises, it is possible to build realistic scenarios based on past events as demonstrated by
Charles (2010) or Comes et al. (2015). Other researchers such as
Kovács and Spens (2007)andPeres et al. (2012)simply consider that
for small- and medium-size disasters, future occurrences will gen-erally be similar to those that had occurred in the past. In practice, the analysis of data from past disasters provides valuable information that enables to understand disaster trends (localization, intensity, typology and seasonality, etc.).
In these cases, the goal is to know where to pre-locate materials and how much in order to maximize responsiveness and effectiveness on the one hand, and minimize costs on the other hand. Moreover, this problematic has to take into account the main difficulties inherent to the humanitarian world, particu-larly demand uncertainty and non-availability of infrastructure. In other words, this paper addresses the following research question: How should HSCs be designed such as to guarantee good performance levels in terms of efficiency (minimum costs) and resilience(the capability to deliver come what may)?
To address this question, we developed a research project that comprises two complementary parts. The first part is a robust HSC design model for a single scenario. Stemming from a classical location/allocation problem, the originality of this model lies not only in its ability to take into account the potential degradation of resources and infrastructure following the occurrence of a disaster (the resilience dimension), but also in its attempt to optimize the ratio between the committed costs and the obtained result (the efficiency dimension). Presented in the form of an Integer Linear Program, this part proposes an operation that guarantees greater robustness by allowing the smoothing of possible shortages. The second part, which is an extension of the first part, allows to consider a set of probability scenarios. This multi-scenarios approach is essential in view of the very uncertain character of humanitarian disasters. In practice, this takes the form of a Stochastic Multi Scenarios Program (SMSP).
These two parts would be too long to be presented in one single paper. In this paper, we have therefore chosen to present only the second part, which we consider to be a major contribu-tion. The model that we developed was tested by applying it to a real life case of recurrent disaster in Peru. The paper starts with a literature review related to the design of supply chains, as well as existing approaches to solving location problems in both tradi-tional and humanitarian supply chains. Then, it continues by defining an AI model that supports decision-making for designing robust HSCs. Finally, it develops a numerical application based on a sizing problem of the HSC in Peru. This numerical application enables to highlight the benefits and limits of our proposal.
2. Literature review and scientific problem 2.1. Determinist, stochastic or robust models
In our study, we try to develop a model to support decision-making for facility location, based on artificial intelligence (AI). One characteristic that is common to all mathematical modeling used in AI is representing a part of the reality and using variables and parameters to achieve the end results. This representation enables to make decisions, to implement them or to understand the implications of the decisions on the studied reality. The mathematical programming models used in this case represent the reality through the combination of variables and parameters in form of constraints and/or objective functions. Generally, the constraints must be respected and the objective function allows making the difference between a given solution and another solution that is potentially better.
A model is said to be determinist when all the data are supposedly known without uncertainty, while in a stochastic model certain first-order variables are represented by probability distributions. Consequently, in the results of the latter, the model is capable of taking randomness or uncertainty into account.
Anjorin (2010) asserts that stochastic optimization problems are
typically dynamic. The algorithms used in solving these problems are classified as NP-hard (Dyer and Stougie, 2006).
For Bertsimas and Thieley (2006), stochastic programming
stood out as a powerful tool for modeling when a random probability description is available. However, in numerous real-life applications, the decision-maker does not possess this infor-mation. Therefore, robust models need to be developed. The idea is to design the model such that the effective scenario would have the least possible influence on the proposed solutions. Robustness is defined byKlibi et al. (2010)as a measure of useful flexibility maintained by a decision that leaves some allowance for future choices. She came up with this based on an optimization of the solution starting from pre-established scenarios but favored none of them such that the performance of the solution would be good whatever the scenario (Baud-Lavigne, 2012).
In a nutshell, we note that stochastic programming assumes that the probability function of random parameters is known, while in the case of robust models the random parameters and the probability functions are not necessarily known. For robust approaches, the uncertain parameters can be given by a set of discrete scenarios or a continuum. The purpose of this type of method is to obtain an optimal solution, which is insensitive to almost all the values of the uncertain parameters. Though we conducted our research on both deterministic and stochastic/ robust models, we will in this paper present only the results of the latter since they constitute our major contribution to this stream of research.
2.2. Location problems
The determination of geographical locations of diverse units is referred to as a location problem. In all location problems, the main goal is to locate a limited number of units in order to provide the best services to the geographical area in question. The first location problem applicable to the industrial sector was formu-lated by Weber (1929). The industrial application consists in locating a warehouse such as to minimize the costs of products circulating between the warehouse and a set of customers (the cost of transportation being proportional to distance, as well as to the transported volume or weight). In the extant literature, there are diverse categories of problems that are extensions of the simple location problem. In the past 15 years, a certain number
of surveys have been published on the different categories, some of which are:
– general location problems (ReVelle and Eiselt, 2005; ReVelle
et al., 2008);
– covering facility location problems (Farahani et al., 2010), where a site can deliver only customers situated in a given zone;
– location routing problems (Prodhon and Prins, 2014), which incorporate the management of the fleet of trucks used to transport products from the warehouses to the customers; – supplier selection problems (Jain et al., 2009), where supplier
selection is taken into account in addition to the location of site during the design of the distribution network.
All these location problems can be encountered in a determi-nist, stochastic, robust and even fuzzy situation. Beyond these surveys that propose an appraisal of the domain, we observe that research in this field has remained particularly active. We can mention some research streams on location selection qu-ery for utility maximization (Qi et al., 2014; Chen et al., 2014) and capacitated location-allocation models (Wen et al., 2014;
Hosseininezhad et al., 2014).
In this paper, we intend to identify sites where warehouses will be located, set the capacity of these warehouses and determine how materials will be delivered to the beneficiaries. The problem treated here is essentially that of location/allocation. A great majority of publications on location/allocation problems are determinist and only a few propose stochastic or fuzzy approaches
(Peres et al., 2012). Traditional methods used in the case of
uncertain demand are based on stochastic or robust optimization
(Klibi et al., 2010; Bagher and Yousefli, 2011; Klibi and Martel,
2012). Robust optimization uses different scenarios ranging from the most optimistic to the worst case, while stochastic optimiza-tion uses the probability of occurrence and generally search for the optimal result. According toShapiro et al. (2009), this is justified when the law of large numbers can be evoked and when we are interested in long-term performance, independently of the fluc-tuations from one realization to another. In the case that we studied, the impact of these fluctuations will potentially impact human lives. Snyder (2004) proposed an exhaustive literature review of existing stochastic models related to location/allocation problems. The objective of most of the models is to minimize costs or to maximize profitability of the entire supply chain network. Some of the models are developed using probabilistic approaches, while others use dynamic approaches.Snyder (2006)argued that robust location problems are more difficult to solve. The specificity of our approach lies mainly in the fact that our model is based on a set of probable scenarios, and that from one scenario to another, the demands and logistic infrastructure are different. For a given scenario, the context is determinist, and for all the scenarios, it is not any more.
2.3. Designing humanitarian supply chains
Although research on facility location problems is extensive, much attention has not been given to the field of humanitarian relief, both in terms of theory and applications (Balcik and
Beamon, 2008; Campbell and Jones, 2011). Nevertheless, in recent
years, some authors have carried out a literature review on research related to the humanitarian world (Altay and Green, 2006; Kovács and Spens, 2007; Simpson and Hancock, 2009;
Lettieri et al., 2009; Galindo and Batta, 2013). These literature
reviews are diverse in scope: some looked at articles related to the management of disasters from the perspective of operations management and operations research, while others laid more
emphasis on articles concerning humanitarian supply chains (HSCs). It resulted from all these articles that the academic literature on humanitarian logistics tends to focus on the pre-paredness phase of bringing relief (help) to the beneficiaries. It also appears that most organizations have chosen a decentralized supply network, underlining the improved delivery service obtained by moving nearer to the field (Gatignon et al., 2010).
As regards more specifically location problems or preposition-ing in the humanitarian context, the literature is divided between the preparedness phase and the response phase.Hale and Moberg
(2005), Salmeron and Apte (2010), Rawls and Turnquist (2010),
Mete and Zabinsky (2010) looked at the prepositioning of
dedi-cated local structures. Other location models dedidedi-cated to the charitable sector focus on the response phase (Barbarosoglu et al., 2002; Ozdamar et al., 2004; Yi and Ozdamar, 2007; Campbell et al.,
2008; Campbell and Jones, 2011; Rath and Gutjahr, 2014).
Of all these facility location papers dedicated to disaster relief, only a very small proportion take a preparedness point of view and work on the global supply network (Akkihal, 2006; Lodree and Taskin, 2007; Balcik and Beamon, 2008; Ukkusuri and Yushimito, 2008; Campbell et al., 2008; Campbell and Jones, 2011; Duran
et al., 2011). These papers focus on facility location and inventory
decisions (amount of stock to pre-position at each facility). They are often based on effectiveness maximization, whereas (Charles, 2010) has demonstrated that efficiency is probably a better objective in current humanitarian environment. They propose interesting solutions to the problems encountered by humanitar-ian practitioners.
However, they are all limited in their ability to design HSCs that are capable of guaranteeing good performance levels in spite of the consequences associated with the occurrence of a disaster. In fact, during the preparedness phase, humanitarian workers plan their response (distribution of relief items) by studying existing infrastructure and available resources (Duran et al., 2011). One of the main difficulties encountered in the design of a performant logistic network in the face of crisis is related to the reliability of infrastructure (Rawls and Turnquist, 2010; Charles, 2010). Indeed, in many cases, roads, railways, bridges, and airports can be destroyed or damaged by the disaster. Consequently, the theore-tical performance of the HSC can be considerably deteriorated. For example, during the Haiti earthquake in 2010, the post-earthquake condition found by the humanitarian actors included many obsta-cles related to the deterioration of infrastructure, and reduced considerably the effectiveness and efficiency of their response.
If such sudden changes in demand or supply occur during a humanitarian operation, a complex problem of re-planning in the urgency appears. It involves decisions regarding the reallocation of stocks and transport of relief items in an uncertain environment
(Rawls and Turnquist, 2010; Charles, 2010; Rottkemper et al.,
2011). It is this limitation of the existing design models of HSCs that we intend to address in this research work.
2.4. Research statement
In the end, the considered scientific problem consists in defining a decision-making support model in artificial intelligence (AI), known as facility location, dedicated to the humanitarian world and capable of designing a coherent network which is still able to adequately manage the response to a disaster despite failures or inadequacies of infrastructure and potential resources. Basically, our research work consists in proposing an innovative location model to improve the resilience and efficiency of the humanitarian response to foreseeable disruptions of infrastructure logistics. Although the environment changes rapidly and unpre-dictably after a disaster,Kovács and Spens (2007)argue that hum-anitarians could benefit from the use of decision-support-systems
concerning the optimization of their logistics networks. In addi-tion, there is a consensus among experts on the field that there are many lessons to learn from the industrial world. Some practices in the business sector could be adapted and used in the humanitarian world. We can say that, although humanitarian logistics has distinct characteristics, the basic principles of industrial logistics can be applied thereto (Kovács and Spens, 2007).
If the vast majority of published research is deterministic, researchers (particularly those working on humanitarian issues) now propose stochastic models in order to better take uncertainty into account (Martel et al., 2013). But whether the approach is stochastic or not, a major issue is that natural disasters are in many cases difficult to predict. Also, the demand induced by theses disasters is even more difficult to predict (Cassidy, 2003). It should be added to this that once the crisis starts the environment changes so rapidly that the information on the actual situation is not available on time. Moreover, a thorough analysis of a logistics network should take into account transport costs, the size of warehouses, environmental constraints, inventory turnover ratios, storage costs, service levels and many other data and parameters. As mentioned earlier, these data and parameters are difficult to collect in the humanitarian world.
3. Proposal: location of warehouses for relief items
As presented inFig. 3.1, our goal is to propose the design of a supply chain as part of humanitarian interventions to support the implementation of relief in case of crisis (by determining the location, the number and the size of warehouses).
The configuration of the network and its design should ideally allow to deliver all the necessary items at the right time and in the most efficient manner, even if the infrastructure has been partially or fully damaged during the disaster. Basically, our approach consists in developing and running a stochastic facility location model that is based on
– data and parameters that are able to describe the current logistics situation on the considered territory;
– scenarios of demand that are able to formalize future disasters and their consequences on the considered territory.
Given that this paper focuses on contributing to solving facility-location problems, it does not address the issue of the definitions of humanitarian scenarios. We refer readers interested in this issue
toVargas Florez et al. (2014), where a concrete methodology is
proposed. Based on the results ofKovács and Spens (2007),Balcik
and Beamon (2008),Charles (2010),Peres et al. (2012)andComes
et al. (2015), we simply assume that realistic scenarios can be
defined for recurrent disasters, including the following elements:
"
Defining the probability of occurrence of a hazardous event in a given region with a given intensity. As indicated by VargasFlorez et al. (2014), the key parameters, such as magnitude,
peak intensity, epicenter, time duration, and occurrence period, can be correlated by means of simple functions. In this paper, we use past disaster occurrences to evaluate not only the probability of occurrence of a new disaster in the future, but also its magnitude.
"
Assessing the consequences of this event on the people who live in the concerned region. As described by Vargas Florezet al. (2014), we use vulnerability and resiliency factors to
define correlation between the intensity of a disaster and its consequences in terms of beneficiaries.
"
Determining the expected impact of future disasters on infra-structures (particularly roads and communication ways poten-tially used to deliver the relief items) and on logistics resources such as prepositioned warehouses (partial or total destruction). This is also based on the work done by Vargas Florez et al.(2014), where they explain how to assess the potential
reduc-tion of logistics capacities following total or partial destrucreduc-tion of vehicles, infrastructures and facilities. The authors argue that this is a function of both the intensity of the disaster and the sensitivity of the region.
To facilitate the reading of data and variables, we will adopt hereafter the following conventions:
– a datum has a name written in small letters: cg¼overall capacity set by the planner;
– a decision variable has a name in capital letters: C¼capacity to be determined;
– indices are written in brackets: C(j), X(i,j).
3.1. Stochastic Multi-Scenarios Program (SMSP) for the design of a robust HSC
The mono-scenario approach is not sufficient since we natu-rally do not know where exactly disasters will occur and we have to presume a set of scenarios. We thus suggest using a stochastic approach. We assume K scenarios with distinct probabilities h(s). As in any stochastic problem, we will now have two types of variables:
– Variables independent of any scenario. Here we want to locate and determine the size of warehouses to better respond to various scenarios. We will always have the binary variables Y(j) that are equal to 1 if a warehouse is located in region j and 0 otherwise, and variables C(j) to determine the capacity of warehouse j.
– Variables related to a given scenario: R(i,s) corresponds to unmet demand in scenario s, while X(i,j,s) correspond to the relief delivered to region i by the warehouse located in region j in scenario s.
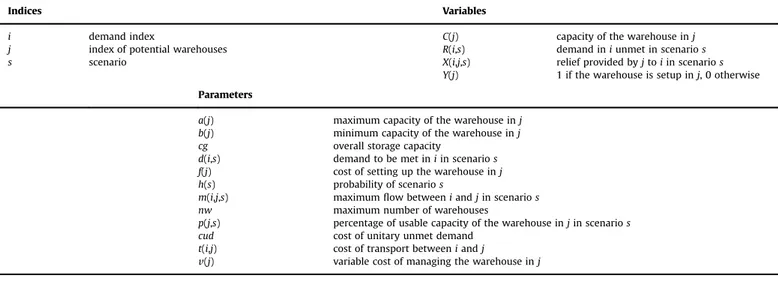
Therefore, the objective function to be minimized comprises three parts: (i) the costs of unmet demand (shortage); (ii) the costs of setting up and managing the warehouses that are independent of the selected scenarios and (iii) the costs of transport depending on scenarios. The indices, parameters and variables used in the model are presented inTable 3.1.
The Stochastic Multi-Scenarios Program (SMSP) is defined as follows: min ¼ cudX i X s hðsÞURði; sÞþ X j ðf ðjÞUYðjÞþvðjÞUCðjÞÞ þX i X j X
s hðsÞU tði; jÞUXði; j; sÞ
The first constraint ensures that warehouse j is open if it delivers items in scenario s.
8j; 8 s;X
i
Xði; j; sÞrYðjÞUX
i
dði; sÞ ð1Þ
The second constraint guarantees that the demand is satisfied by the warehouses, otherwise it is unmet. Demand can be satisfied by deliveries from whatever warehouse.
8i; 8 sX
j
Xði; j; sÞþRði; sÞ ¼ dði; sÞ ð2Þ
The third constraint indicates that a given warehouse cannot deliver more than its own residual capacity.
8j; 8 sX
i
Xði; j; sÞrpðj; sÞUCðjÞ ð3Þ
The fourth constraint entails that if a warehouse is open, then its capacity is between a(j) and b(j). If the warehouse is not open, then its capacity is null.
8j; aðjÞUYðjÞrCðjÞrbðjÞUYðjÞ ð4Þ
The fifth constraint expresses the fact that the flows between i and j are limited. This is particularly useful to express the potential reduction of transport capacities after a disaster.
8i8 j8 s; Xði; j; sÞrmði; j; sÞ ð5Þ
The sixth constraint indicates that the number of opened warehouses is limited. Basically, the relief strategy should consider fixed cost constraints and consequently, the number of running warehouses has to be limited.
X
j
YðjÞrnw ð6Þ
The seventh constraint requires that the overall capacity of all the warehouses is at maximum cg.
X
j
CðjÞrcg ð7Þ
The last constraint proposes a binary variable that indicates whether a warehouse is open or not.
8 j YjA 0; 1f g ð8Þ
3.2. Numerical application and discussions 3.2.1. Case presentation
The real-life case that we will use to illustrate our proposed model is a short version of a complete study of the design of a humanitarian supply chain (HSC) dedicated to the recurrent humanitarian disasters in Peru (Vargas Florez, 2014). We have chosen to present a version that is short but sufficient enough to highlight the advantages and limitations of our proposal. All data and assumptions in this version are coherent with the whole application case and can be considered to be realistic. Specifically, the study is on a geographical area subjected to the El Niño phenomenon and consequently to the risk of recurrent natural disasters caused by earthquakes, floods and cold waves. Indeed, this area is crossed from west to east by a mountain barrier that cuts it in two. The mountain barrier creates different weather conditions in the northern and southern flanks and restricts north/ south transport capacity. Moreover, this area is on the border of two tectonic plates and prone to earthquake. To provide relief items to the population, we decided to locate warehouses in which kits of relief items would be stored. For more details on the whole Peruvian application case, we invite the reader to seeLauras et al.
(2014)orVargas Florez (2014).
The geographical layout (zoning) chosen for the example is purely geometrical and divides the area into 12 (3 & 4) regions (see
Fig. 3.2). It is possible to locate a warehouse in each of the regions.
Table 3.1
Model indices, parameters and variables.
Indices Variables
i demand index C(j) capacity of the warehouse in j j index of potential warehouses R(i,s) demand in i unmet in scenario s s scenario X(i,j,s) relief provided by j to i in scenario s
Y(j) 1 if the warehouse is setup in j, 0 otherwise Parameters
a(j) maximum capacity of the warehouse in j b(j) minimum capacity of the warehouse in j cg overall storage capacity
d(i,s) demand to be met in i in scenario s f(j) cost of setting up the warehouse in j h(s) probability of scenario s
m(i,j,s) maximum flow between i and j in scenario s nw maximum number of warehouses
p(j,s) percentage of usable capacity of the warehouse in j in scenario s cud cost of unitary unmet demand
t(i,j) cost of transport between i and j
v(j) variable cost of managing the warehouse in j
1 2 3 4
5 6 7 8
9 10 11 12
Here, we consider three levels of crises (high, medium or low). Generally, a crisis strikes several regions with varying intensity depending on the region. For example, an earthquake of high-intensity with its epicenter in region 2 (high-level crisis) will result in medium-level crisis in regions 3 and 6. The cold waves would simultaneously affect regions 5, 6, 7 and 8 to varying degrees. Based on the historical data of past crises, 12 disaster scenarios were identified and their probability of occurrence estimated, as shown inTable 3.2. Scenario 1 for example is the occurrence of a high-intensity earthquake on the fault separating regions 3 and 7. The level of the crisis will be high on both regions and will propagate, following the fault, in form of medium-level crisis on regions 6 and 8 and low-level on regions 2 and 4.
In case of medium- or high-amplitude crisis, relief items must be provided to a part of the population. Relief consists of a standard kit (food items, blankets, medicine) delivered to each person.Table 3.3shows the number of persons to be served by region depending on whether the intensity of the crisis is medium or high.
Based on the numbers inTable 3.3, we determined the demand corresponding to each of the scenarios. We assessed the impact of a disaster on infrastructure. Disasters can modify the logistics environment in two ways by
– restricting existing transport capacity between regions; – reducing the responsiveness of a warehouse where emergency
kits were stored.
Under normal circumstances it is possible to circulate from one region to another. But the mountainous area East/West limits the transport capacity between two regions and increases the cost of transport.Table 3.4 shows the number of kits f(i,j) that can be transported between two regions i and j when transport networks are not deteriorated or cut.
The majority of transport is by vulnerable roads, especially mountain roads. A high-intensity earthquake or heavy snowfalls can cut them, leaving only the airlift, air drops by helicopter or the passage of small convoys. To take this into account, we consider that after a disaster, there is only one part m(i,j) left of the initial flow f(i,j) between the two regions i and j. We determine m(i,j) in two steps. In step 1, the percentage of the usable road network after a medium-level disaster is 90% for regions 1–4 and 9–12, and 80% for regions 5–8; and for a high-level disaster, the percentage is 75% for regions 1–4, 60% for regions 5–8, and 80% for regions 9–12. To determine the percentage of residual flows between regions iand j, we consider that these percentages are multiplicative:
– If region 1 undergoes a medium-level crisis and region 5 a low-level crisis, the percentage will be 90% & 100%¼90%. The maximum flow between regions 1 and 5 will be 3600 kits (90% & 4000).
– If regions 1 and 5 simultaneously undergo a medium-level crisis, the percentage between these two regions will be 90% & 80%¼72%. The maximum flow between regions 1 and 5 will be 2880 kits (72% & 4000).
– If region 1 undergoes a high-level crisis and region 5 a medium-level crisis, the percentage will be 75% & 80%¼60%. The flow will be 2400 kits.
The second risk is the loss (after the disaster) of all or part of the warehouse inventory. In Haiti in 2010, the adopted solution was to keep a single inventory in Port au Prince. This made sense given the distribution of the population and the communication channels. During the earthquake, the warehouses were destroyed and could not be used. To account for this risk, we introduce a parameter giving the usable percentage p(j) of the warehouse capacity C(j) according to the importance of the crisis in region j. In our example, p(j) for a medium-level disaster is 80% for regions 1–4, 70% for regions 5–8, and 90% for regions 9–12; and for a high-level disaster, p(j) is 60% for regions 1–4, 50% for regions 5–8, and 65% for regions 9–12.
The last step of the approach is to determine where to locate the warehouses in which kits of relief items should be stored. To complete the example, we include some additional assumptions:
– It is possible to locate not more than one warehouse by region. – For financial reasons and to ensure a better control of the stored items, the number of selected warehouses must be low (maximum of 3).
– All the warehouses must allow delivering relief items to not more than 14,000 persons since the authorities do not have the financial means to store more. Moreover, beyond 14,000 persons, it seems possible to easily mobilize international generosity, which is unlikely in the case of recurrent disasters. We can already observe that in scenario 1 where demand is 15,500 (seeTable 3.4), it will not be possible to fully meet the needs. We note that we have voluntarily limited the capacity coverage at 90% of the overall capacity in order to test the robustness of our model, as well as to be closer to realistic humanitarian situations.
– To ensure a better dissemination of stocks, we set a minimum capacity a(j) and a maximum capacity b(j) of the inventory located in region j. In our example, a(j)¼2000 and b(j)¼6000 for all the regions.
– The construction of a warehouse in a region entails a fixed setup cost f(j), as well as monitoring costs and replenishment costs of perishable items, which are proportional to the capacity C(j) stored in the warehouse. If v(j) is the variable cost per kit, the variable cost is equal to v(j) & C(j). These variable costs also vary from one region to another. In our example, f(j)
Table 3.2
Case example – scenarios (L¼low, M¼Medium, H¼High).
Scenario Probability (%) 1 2 3 4 5 6 7 8 9 10 11 12 1 9 – L H L – M H M – – – – 2 13 – M – – – M – – – – – – 3 5 M H M – – H L – – – – – 4 10 – M M – – – M – – – – – 5 3 – M H M – M L – – – – – 6 12 – – – – M M – – – – – – 7 6 – H L – – H M – – – – – 8 8 H M – – – – – – – – – – 9 12 – – – M – – M H – – L M 10 10 – – – – – – – – M M – – 11 7 – – – – – – – – – L H M 12 5 – – – – – – – M L – M H Table 3.3
Case example – number of persons to be served.
Region Medium-level crisis High-level crisis
1 2000 3000 2 3500 6000 3 4500 8000 4 1500 2800 5 500 1000 6 1000 1500 7 3000 5000 8 1500 3500 9 2000 3500 10 3000 5000 11 4000 7000 12 2000 4500
is 1050 for regions 1 and 4; 1000 for regions 2, 3 and 12; 1100 for regions 6, 7, 10 and 11; 1200 for regions 5 and 9; 1300 for region 8. The variable cost per kit is 1.0 for regions 1–4; 1.1 for regions 5, 7, 8, 10, 11 and 12; 1.2 for region 6; and 1.3 for region 9.
Transport costs between regions are variable depending on the distance and the usable means of transportation.Table 3.5shows the transport cost of a kit between two regions (i,j).
3.2.2. Experimentation
To support our numerical analysis, we first calculated the optimal results for each scenario separately (that is, probability of 100% for the studied scenario and 0% for the others).Table 3.6 presents the obtained results. We can see that only two scenarios present some difficulties regarding the unfulfilled deprived per-sons. In scenario 1, there are actually 1500 kits that cannot be delivered (9.7%). This is perfectly normal since the overall capacity of the network is 14,000. Scenario 5 also presents some failures regarding the deliveries. In this case, 960 kits (6.9%) cannot be delivered whereas there are enough products in the network (14,000 kits). This is due to the fact that some infrastructures are destroyed.
We will now discuss a numerical application of our SMSP. This proposes a global solution and not a set of local optima. In the example, the following results are obtained: the warehouses of regions 1, 5 and 11 should be opened with capacities of 3700, 4620 and 5680 respectively.Table 3.7shows the impact of this solution on costs and deprived persons for the different scenarios. Several comments have to be made regarding this result. Firstly, we can observe that scenarios 2, 4, 6, 8, 9, 10, 11 and 12 obtain very
satisfactory results regarding the unfulfilled deprived persons (all the beneficiaries are served). Of course, the costs of the response associated to each scenario are a bit higher than those associated to local optimizations (seeTable 3.6). But these extra costs would be really counterbalanced by the functional costs that will be lower since only 3 warehouses are used in this configuration against 12 in the local optimizations' solution. Secondly, four scenarios (1, 3, 5 and 7) present some problems regarding the unfulfilled kits. For scenario 1 the result corresponds to the optimal as we cannot deliver more than 14,000 kits. For scenarios 3 and 7, there is a little increase of unfulfilled deprived. This is a side effect of a global approach compared to a local approach. Nevertheless, the number of unfulfilled kits represents less than 2% of the demand in each scenario. Scenario 5, which was already problematic with the local optimization, presents here again more difficulties. The number of unfulfilled items increases by 4.4%. Nevertheless, this can be moderated because the probability of occurrence of this scenario is only 3%. That is why our model implies that it is better to distinguish this scenario instead of another one with a higher probability of occurrence. At the end, in terms of expected value, the percentage of the deprived persons will be 2.4% (that is, 202/8375).
3.2.3. Extension of the model
Let us look at the percentage distribution of the deprived across regions, as shown inTable 3.8
This solution does not give a fair distribution of non-satisfaction between regions. This is particularly true for region 7 in scenario 1 and region 3 in scenario 5. Basically, the solution cannot be considered yet as a robust solution. It is possible to improve the distribution without increasing the number of the deprived in each of the scenarios. For this, we need to know the maximum percentage PM(s) of the unsatisfied in a region for scenario s. In the objective function to be minimized, we will add a “cost” proportional to PM(s).
Let dn(s) be the number of the deprived previously obtained for scenario s.
In the program (SMSP), we add: – the variables PM(s);
– the data dn(s);
– the following additional constraints for scenarios s:
Eq. 9, associated with the objective function, gives the max-imum percentage of the deprived in a region for scenario s.
8 s8 i PMðsÞZRði; sÞ=dði; sÞ ð9Þ
Table 3.4
Case example – Nominal inter-regional flow (in number of kits). Regions Initial flow between regions f(i,j)
1 2 3 4 5 6 7 8 9 10 11 12 1 – 3500 3500 3000 4000 4000 4000 3000 2400 3200 3200 2800 2 3500 – 4000 3000 3000 3500 3500 3000 2400 3200 3200 2800 3 3500 4000 – 3000 4000 4000 4000 3000 2400 3200 3200 2800 4 3000 3000 3000 – 3000 3000 3000 3000 2000 2800 2800 2400 5 4000 3000 4000 3000 – 2000 1600 1200 2400 2400 2400 2400 6 4000 3500 4000 3000 2000 – 4000 2500 2400 2000 2000 2000 7 4000 3500 4000 3000 1600 4000 – 2400 800 1200 1600 1200 8 3000 3000 3000 3000 1200 2500 2400 – 1200 1200 1200 1200 9 2400 2400 2400 2000 2400 2400 800 1200 – 2400 2400 2400 10 3200 3200 3200 2800 2400 2000 1200 1200 2400 – 2400 2400 11 3200 3200 3200 2800 2400 2000 1600 1200 2400 2400 – 3200 12 2800 2800 2800 2400 2400 2000 1200 1200 2400 2400 3200 – Table 3.5
Case example – transport cost t(i,j) between two regions (i,j).
Regions 1 2 3 4 5 6 7 8 9 10 11 12 1 0 1 2 3 1 2 3 4 3 4 5 6 2 1 0 1 2 2 1 2 3 4 3 4 5 3 2 1 0 1 3 2 1 2 5 4 3 4 4 3 2 1 0 4 3 2 1 6 5 4 3 5 1 2 3 4 0 1 2 3 2 3 4 5 6 2 1 2 3 1 0 1 2 3 2 3 4 7 3 2 1 2 2 1 0 1 4 3 2 3 8 4 3 2 1 3 2 1 0 5 4 3 2 9 3 4 5 6 2 3 4 5 0 1 2 3 10 4 3 4 5 3 2 3 4 1 0 1 2 11 5 4 3 4 4 3 2 3 2 1 0 1 12 6 5 4 3 5 4 3 2 3 2 1 0
Eq. (10) implies that the number of the deprived for scenario s remains the same.
8 s X
i
Rði; sÞ ¼ dnðsÞ ð10Þ
In the objective function to be minimized, we add a cost proportional to PM(s). The resulting solution retains the same warehouses with identical storage capacities; only the flows are changed. Transport costs therefore increase by 0.6%. The results are shown inTable 3.9.
It improves the situation of scenarios 1 and 3, but the problem still remains the same for scenario 5, as shown inTable 3.10.
The basic assumption retained so far is to find a solution that minimizes the number of the deprived, and this, at the lowest cost. In the event that the emergency must meet immediate vital needs, this criterion is indisputable. We observe in the two previous cases that this objective conflicts with the criterion of fair distribution of the shortage in the regions. In a situation where relief is organized by public authorities and if the rest of the relief can be delivered in
Table 3.6
Results of the numerical application of the local optimization.
Scenario Demand Deprived persons Deprived % Stock Lost Kits Costs
Transport Warehouse 1 15,500 1500 9.7% 14,000 0 20,250 17,100 2 4500 0 0 5000 500 1000 6000 3 14,000 0 0 14,000 0 20,000 18,255 4 11,000 0 0 13,183 2183 0 16,683 5 14,000 960 6.9% 14,000 0 20,600 18,380 6 1500 0 0 2000 500 500 3500 7 10,500 0 0 13,333 2833 3500 16,967 8 6500 0 0 7639 1139 0 9689 9 10,000 0 0 12,076 2076 3500 16,026 10 5000 0 0 5380 380 0 8663 11 9000 0 0 10,667 1667 2200 13,833 12 10,000 0 0 12,587 2587 0 17,246 Table 3.7
Results of the SMSP numerical application
Scenario Probability (%) Costs Deprived persons Demand % deprived persons Transport Warehouse 1 9 37,000 18,380 1500 15,500 9.7 2 13 4850 18,380 0 4500 0.0 3 5 30,530 18,380 185 14,000 1.3 4 10 23,040 18,380 0 11,000 0.0 5 3 30,920 18,380 1580 14,500 11.3 6 12 1000 18,380 0 1500 0.0 7 6 21,620 18,380 180 10,500 1.7 8 8 7040 18,380 0 6500 0.0 9 12 24,700 18,380 0 10,000 0.0 10 10 8680 18,380 0 5000 0.0 11 7 20,360 18,380 0 9000 0.0 12 5 23,248 18,380 0 10,000 0.0 Expected value 17,119 18,380 202 8375 2.4 Table 3.8
SMSP numerical application – Percentage of non-satisfaction
Percentage of non-satisfied Average % Reg. 1 Reg. 2 Reg. 3 Reg. 4 Reg. 6 Reg. 7 Reg. 8
Scenario 1 – – 0.0% – 0.0% 30.0% 0.0% 9.7 Scenario 3 0.0% 0.0% 4.1% – 0.0% – – 1.3 Scenario 5 – 0.0% 19.8% 0.0% 0.0% – – 10.9 Scenario 7 – 3.0% – – 0.0% 0.0% – 1.7
Table 3.9
Extended SMSP Numerical Application – Summary of results Scenario Probability (%) Costs Deprived persons % deprive persons Transport Warehouse 1 9 37,923 18,380 1500 9.7 2 13 4850 18,380 0 0.0 3 5 30,702 18,380 185 1.3 4 10 23,040 18,380 0 0.0 5 3 30,920 18,380 1580 11.3 6 12 1000 18,380 – – 7 6 21,620 18,380 180 1.7 8 8 7040 18,380 0 0.0 9 12 24,700 18,380 0 0.0 10 10 8680 18,380 0 0.0 11 7 20,360 18,380 0 0.0 12 5 23,248 18,380 0 0.0 Expected value 17,210 18,380 202 Table 3.10
Extended SMSP numerical application – non-satisfaction
Percentage of non-satisfied Average % Reg. 1 Reg. 2 Reg. 3 Reg. 4 Reg. 6 Reg. 7 Reg. 8
Scenario 1 – – 11.5% – 0.0% 11.5% 0.0% 9.7 Scenario 3 1.3% 1.3% 1.3% – 1.3% – – 1.3 Scenario 5 – 0.0% 19.8% 0.0% 0.0% – – 10.9 Scenario 7 – 3.0% – – 0.0% 0.0% – 1.7
a short time, the criterion of fair distribution can become domi-nant. In our example, it may be attractive to decision makers to have a robust solution that would ensure that in all scenarios where it is possible, every region receives at least 95% of its needs. For scenarios 1 and 5 for which we know beforehand that we will have a minimum of 9.7% and 10.9% shortage, the thresholds to be respected will be higher than or equal to these values. We sug-gest adding a table to be completed by the decision makers who state the maximum percentage px(s) of acceptable shortage in scenario s.
To take this new constraint into account, we must add a constraint in the program (SMSP).
Eq. (11) limits the value of the maximum percentage.
8s PMðsÞrpxðsÞ ð11Þ
The risk is to end up with programs without a solution if the values px(s) are too low. To obtain an answer in all cases, we suggest deleting the constraints (11) and adding a penalty w(s) if the variables PM(s) exceed the values px(s). The cost of smoothing will then be proportional to this excess. In essence, the equation to be added is Smoothing Cost ¼X s X i ðPMðsÞ'pxðsÞÞnwðsÞ ð12Þ
Let us look at this example again. Here we aim to have a maximum percentage of the deprived of 10% for scenario 1, 8% for scenario 5 and 5% for others. To avoid increasing the percentage on the already critical scenarios 1 and 5, we have taken higher weights for these two scenarios. Thus, the penalty (if PM(s) exceed the values px(s)) is 10,000 for scenario 1, 5000 for scenario 5, and 1000 for the other scenarios.
The resulting solution opens warehouses 1, 5 and 11 with respective capacities of 3900, 5700 and 4400.Table 3.11shows the impact of this solution on costs and deprived persons for the different scenarios. In this small example, the numerical results are very close to those obtained previously but the solution can now be considered as the most robust in this situation. The results do not change for scenarios 5 and 7. Scenario 1 is almost balanced at the expense of Scenario 3, which increases slightly from 1.3% to 1.4%. For the other scenarios, the percentages remain the same. On the other hand, the costs of transport increase significantly from 17,119 to 20,665, that is, by 20%.
4. Conclusion and perspectives
As part of this research, we focused on the design/configuration of a humanitarian supply chain (HSC) capable of supporting the response to recurrent crises. The main purpose of our research was to propose an artificial intelligence-based decision-making tool that takes into account the reality on the ground and is capable of guaranteeing resilience on the one hand and efficiency on the other hand. To achieve this goal, our research work includes a robust HSC design model that allows considering a set of prob-ability scenarios. This multi-scenarios approach is essential in view
of the very uncertain character of humanitarian disasters. In practice, this contribution takes the form of a Stochastic Multi-Scenarios Program (SMSP). Stemming from a classical location/ allocation problem, the originality of this model lies in its ability to take into account the potential degradation of resources and infrastructures following the occurrence of a disaster (the resi-lience dimension) and to try to optimize the ratio between the committed costs and the obtained result (the efficiency dimen-sion). Presented in the form of an Integer Linear Program, this contribution proposes an operation that guarantees greater robustness by allowing the smoothing of possible shortages. The developed model was tested by applying it to a real life case of a recurrent disaster in Peru. Beyond the aspects that we have just mentioned, the major perspectives in this research are undoubt-edly related to the development of new scientific contributions.
Firstly, as in any research project, the sensitivity of the results is an important topic. Due to limited-availability of data, we were unable to carry out this sensitivity analysis. The application of our proposals to several real life cases would enable to fill this gap.
Secondly, the research work that we conducted helped to find solutions to capture some criteria of humanitarian uncertainty (demand and infrastructure/resources). Nonetheless, uncertainty also concerns other criteria such as safety, the level of media coverage (and thus funding), or competition between the different actors on the ground. This reflection gives rise to many potential themes of research to ensure that these new types of hazards are properly taken into consideration in decision making.
Thirdly, though recurrent disasters (which constitute the only focus of this research) are the most numerous, they are not necessarily the most critical in terms of management. The very big disasters also have many problems related to decision-making-support, coordination and professionalization. Further work needs to be conducted such as to extend our approaches to these particular crises in order to also improve their resilience and efficiency.
Fourthly, the present research work deals with strategic deci-sions in the preparedness phase (designing and dimensioning of logistics networks in particular). An interesting perspective would be to address the question of decision-making at the operational level in response to a crisis phase. In an environment where information is more and more massive (including in the situa-tion of crises), it will be an issue to define and develop a decision-support-system for supporting, at the operational level, the responsiveness and coordination of humanitarian response in spite of a particularly disrupted environment on the one hand, and highly heterogeneous and distributed actors on the other hand.
Finally, the work done enabled to develop concrete solutions for locating and dimensioning a HSC. Additional work would naturally focus on the optimization of transport modes. Thus, a strong perspective is to develop decision-support tools dedicated to routing problems that are consistent and compatible with the proposals presented in this paper (development of efficiency and resilience capabilities, and taking uncertainty into account).
References
Akkihal, A.R., 2006. Inventory pre-positioning for humanitarian operations (Ph.D.
dissertation). Massachusetts Institute of Technology, USA.
Altay, N., Green III, W.G., 2006. OR/MS research in disaster operations management.
Eur. J. Oper. Res. 175 (1), 475–493.
Anjorin, C.A.A., 2010. A modelling language for decision-making under uncertainty
(Thesis). Imperial College of London (163 pp.).
Bagher, M., Yousefli, A., 2011. An application of possibilistic programming to the fuzzy location-allocation problems. Int. J. Adv. Manuf. Technol. 53 (9–12),
1239–1245.
Balcik, B., Beamon, B.M., 2008. Facility location in humanitarian relief. Int. J. Logist.:
Res. Appl. 11 (2), 101–121.
Table 3.11
Multi-scenarios SMSP numerical application – non-satisfaction
Percentage of non-satisfied Average Reg. 1 Reg. 2 Reg. 3 Reg. 4 Reg. 6 Reg. 7 Reg. 8
Scenario 1 – – 10.0% – 10.0% 10.0% 6.7% 9.7 Scenario 3 1.4% 1.4% 1.4% – 1.4% – – 1.4 Scenario 5 – 0.0% 19.8% 0.0% 0.0% – – 10.9 Scenario 7 – 3.0% – – 0.0% 0.0% – 1.7
Barbarosoglu, G., Ozdamar, L., Cevik, A., 2002. An interactive approach for hierarchical analysis of helicopter logistics in disaster relief operations. Eur. J.
Oper. Res. 140 (1), 118–133.
Baud-Lavigne, B., 2012. Conception conjointe de nomenclatures et de la chaîne logistique pour une famille de produits: outils d’optimisation et analyse (Ph.D. dissertation). Université de Grenoble (France) and Ecole Polytech de Montréal,
Canada.
Bertsimas, D., Thieley, A., 2006. Robust and data-driven optimization: modern decision-making under uncertainty. Working Paper. MIT Press, Cambridge.
Campbell, A.M., Jones, P.C., 2011. Prepositioning supplies in preparedness for
disasters. Eur. J. Oper. Res. 209 (2), 156–165.
Campbell, A.M., Vandenbussche, D., Hermann, W., 2008. Routing for relief efforts.
Transport. Sci. 42 (2), 127–145.
Cassidy, W.B., 2003. A logistics lifeline. Traffic World Mag. (October 27).
Charles, A., 2010. Improving the design and management of agile supply chains: feedback and application in the context of humanitarian aid (Ph.D. thesis).
Toulouse University, Mines Albi, France (227 pp.).
Chen, J., Huang, J., Wen, Z., He, Z., Taylor, K., Zhang, R., 2014. Analysis and evaluation
of the top-k most influential location selection query. Knowl. Inf. Syst. (online).
Comes, T., Wijngaards, N., VanDeWalle, B., 2015. Exploring the future: runtime scenario selection for complex and time-bound decisions. Technol. Forecast.
Social Change 97, 29–46.
Duran, S., Gutierrez, M.A., Keskinocak, P., 2011. Pre-positioning of emergency items
for CARE International. Interfaces 41 (1), 223–237.
Dyer, M., Stougie, L., 2006. Computational complexity of stochastic programming
problems. Math. Program. 106 (3), 423–432.
Farahani, R.Z., SteadieSeifi, M., Asgari, N., 2010. Multiple criteria facility location
problems: a survey. Appl. Math. Model. 34 (7), 1689–1709.
Galindo, G., Batta, R., 2013. Review of recent developments in OR/MS research in
disaster operations management. Eur. J. Oper. Res. 230 (2), 201–211.
Gatignon, A., Van Wassenhove, L.-N., Charles, A., 2010. The Yogyakarta earthquake: humanitarian relief through IFRC's decentralized supply chain. Int. J. Prod. Econ.
126 (1), 102–110.
Hale, T.S., Moberg, C.R., 2005. Improving supply chain disaster preparedness: a decision process for secure site location. Int. J. Phys. Distrib. Logist. Manag. 35
(3), 195–207.
Hosseininezhad, S.J., Jabalameli, M.S., Naini, S.G.J., 2014. A fuzzy algorithm for continuous capacitated location/allocation model with risk consideration. Appl.
Math. Model. 38 (3), 983–1000.
Jain, V., Benyoucef, L., Deshmukh, S.G., 2009. Strategic supplier selection: some
emerging issues and challenges. Int. J. Logist. Syst. Manag. 6 (1/2), 61–88.
Klibi, W., Martel, A., 2012. Scenario-based supply chain network risk modeling. Eur.
J. Oper. Res. 223 (1), 644–658.
Klibi, W., Martel, A., Guitouni, A., 2010. The design of robust value-creating supply
chain networks: a critical review. Eur. J. Oper. Res. 203 (1), 283–293.
Kovács, G., Spens, K.M., 2007. Humanitarian logistics in disaster relief operations.
Int. J. Phys. Distrib. Logist. Manag. 37 (2), 99–114.
Lauras, M., Vargas Florez, J., Dupont, L., Charles, A., 2014. A location-allocation model for more consistent humanitarian supply chains. In: Proceedings of 1st ISCRAM-Med Conference. Springer, Toulouse, France.
Lettieri, E., Masella, C., Radaelli, G., 2009. Disaster management: findings from a
systematic review. Disaster Prev. Manag.: Int. J. 18 (2), 117–136.
Lodree, E.J., Taskin, S., 2007. An insurance risk management framework for disaster relief and supply chain disruption inventory planning. J. Oper. Res. Soc. 59 (5),
674–684.
Martel, A., Benmoussa, A., Chouinard, M., Klibi, W., Kettani, O., 2013. Designing global supply networks for conflict or disaster support: the case of the
Canadian armed forces. J. Oper. Res. Soc. 64 (1), 577–596.
Mete, H.O., Zabinsky, Z.B., 2010. Stochastic optimization of medical supply location
and distribution in disaster management. Int. J. Prod. Econ. 126 (1), 76–84.
Natarajarathinam, M., Capar, I., Narayanan, A., 2009. Managing supply chains in times of crisis: a review of literature and insights. Int. J. Phys. Distrib. Logist.
Manag. 39 (7), 535–573.
Ozdamar, L., Ekinci, E., Kucukyazici, B., 2004. Emergency logistics planning in
natural disasters. Ann Oper Res 129 (1/4), 217–245.
Peres, E.Q., BritoJr, I., Leiras, A., Yoshizaki, H.T.Y., 2012. Humanitarian logistics and disaster relief research: trends, applications, and future research directions. In: Conference Proceedings, 4th International Conference on Information Systems, Logistics and Supply Chain. Quebec, Canada, pp. 26–29.
Prodhon, C., Prins, C., 2014. A survey of recent research on location-routing
problems. Eur. J. Oper. Res. 238 (1), 1–17.
Qi, J., Zhang, R., Wang, Y., Yuan Xue, A., Yu, G., Kulik, L., 2014. The min-dist location selection and facility replacement queries. World Wide Web J. 17 (6),
1261–1293.
Rath, S., Gutjahr, W.J., 2014. A math-heuristic for the warehouse location-routing
problem in disaster relief. Comput. Oper. Res. 42 (February), 25–39.
Rawls, C.G., Turnquist, M.A., 2010. Pre-positioning of emergency supplies for
disaster response. Transp. Res. Part B: Methodol. 44 (4), 521–534.
ReVelle, C.S., Eiselt, H.A., 2005. Location analysis: a synthesis and survey. Eur.
J. Oper. Res. 165 (1), 1–19.
ReVelle, C.S., Eiselt, H.A., Daskin, M.S., 2008. A bibliography for some fundamental problem categories in discrete location science. Eur. J. Oper. Res. 184 (1),
817–848.
Rottkemper, B., Fischer, K., Blecken, A., Danne, C., 2011. Inventory relocation for overlapping disaster settings in humanitarian operations. Oper. Res. Spectr. 33
(3), 721–749.
Salmeron, J., Apte, A., 2010. Stochastic optimization for natural disaster asset
prepositioning. Product. Oper. Manag. 19 (5), 561–574.
Shapiro, A., Dentcheva, D., Ruszczynski, A., 2009. Lectures on Stochastic
program-ming: Modeling and Theory, 2nd edition SIAM, Philadelphia.
Simpson, N.C., Hancock, P.G., 2009. Fifty years of operational research and
emergency response. J. Oper. Res. Soc. 60 (Suppl. 1), S126–S139.
Snyder, L.V., 2004. Facility Location Under Uncertainty: A Review, Technical Report #04T-015. Department of Industrial & System Engineering, Lehigh University,
USA.
Snyder, L.V., 2006. Facility location under uncertainty: a review. IIE – Trans. 38 (7),
537–554.
Ukkusuri, S.V., Yushimito, W.F., 2008. Location routing approach for the humani-tarian prepositioning problem. Transp. Res. Rec.: J. Transp. Res. Board 2089 (1),
18–25.
Vargas Florez, J., 2014. Aide à la conception de chaînes logistiques humanitaires efficientes et résilientes: application au cas de crises récurrentes péruviennes
(Ph.D. thesis). Toulouse University, Mines Albi (176 pp.).
Vargas Florez, J., Charles, A., Lauras, M., Dupont, L., 2014. Designing realistic scenarios for disaster management quantitative models. In: Proceedings of Annual ISCRAM Conference. Penn-State University, USA.
Weber, A., 1929. The Theory of the Location of Industries. Chicago University Press p. 256.
Wen, M., Qin, Z., Kang, R., 2014. The alpha-cost minimization model for capacitated facility location-allocation problem with uncertain demands. Fuzzy Optim.
Decis. Mak. 13 (3), 345–356.
Yi, W., Ozdamar, L., 2007. A dynamic logistics coordination model for evacuation