RESEARCH
Carbon dioxide fluxes from a degraded
woodland in West Africa and their responses
to main environmental factors
Expedit Evariste Ago
1,2*, Dominique Serça
3, Euloge Kossi Agbossou
2, Sylvie Galle
4,5,6and Marc Aubinet
1Abstract
Background: In West Africa, natural ecosystems such as woodlands are the main source for energy, building poles
and livestock fodder. They probably behave like net carbon sinks, but there are only few studies focusing on their carbon exchange with the atmosphere. Here, we have analyzed CO2 fluxes measured for 17 months by an eddy-covariance system over a degraded woodland in northern Benin. Specially, temporal evolution of the fluxes and their relationships with the main environmental factors were investigated between the seasons.
Results: This study shows a clear response of CO2 absorption to photosynthetic photon flux density (Qp), but it varies according to the seasons. After a significant and long dry period, the ecosystem respiration (R) has increased immedi-ately to the first significant rains. No clear dependency of ecosystem respiration on temperature has been observed. The degraded woodlands are probably the “carbon neutral” at the annual scale. The net ecosystem exchange (NEE) was negative during wet season and positive during dry season, and its annual accumulation was equal to +29 ± 16 g C m−2. The ecosystem appears to be more efficient in the morning and during the wet season than in the afternoon and during the dry season.
Conclusions: This study shows diurnal and seasonal contrasted variations in the CO2 fluxes in relation to the alter-nation between dry and wet seasons. The Nangatchori site is close to the equilibrium state according to its carbon exchanges with the atmosphere. The length of the observation period was too short to justify the hypothesis about the “carbon neutrality” of the degraded woodlands at the annual scale in West Africa. Besides, the annual net ecosys-tem exchange depends on the intensity of disturbances due to the site management sysecosys-tem. Further research works are needed to define a woodland management policy that might keep these ecosystems as carbon sinks.
Keywords: Eddy-covariance, Woodland, Sudanian climate, Net ecosystem exchange, Annual NEE, Benin, West Africa Résumé
Problématique: En Afrique de l’Ouest, les écosystèmes naturels comme les forêts claires constituent la principale
source d’énergie, de bois d’oeuvre et de fourrage pour le bétail. Ces forêts claires se comportent probablement comme de puits nets de carbone, mais très peu d’études ont porté sur les échanges de carbone de celles-ci avec l’atmosphère. Cette étude a analysé les flux de CO2 mesurés pendant 17 mois à l’aide d’un système d’eddy-covariance placé au dessus d’une forêt claire dégradée au nord du Bénin. De façon spécifique, l’évolution temporelle des flux de CO2 et leurs relations avec les principaux facteurs environnementaux ont été étudiées suivant les saisons.
© 2015 Ago et al. This article is distributed under the terms of the Creative Commons Attribution 4.0 International License (http://creativecommons.org/licenses/by/4.0/), which permits unrestricted use, distribution, and reproduction in any medium, provided you give appropriate credit to the original author(s) and the source, provide a link to the Creative Commons license, and indicate if changes were made.
Open Access
*Correspondence: EEAGO@DOCT.ULG.AC.BE
2 Laboratoire d’Hydraulique et de Maîtrise de l’Eau, Faculté des Sciences
Agronomiques (FSA), Université d’Abomey-Calavi (UAC), BP 2819, Cotonou, Benin
Background
Forests occupy approximately 42 million km2,
represent-ing approximately 30 % of the total land surface in the tropical, boreal and temperate lands [1–3]. Worldwide, it is recognized that these ecosystems influence strongly the global carbon cycle through their exchanges with the atmosphere of the carbon dioxide, energy, water and other gases or chemical elements [2, 4]. However, the complexity and large temporal or spatial variability of the interactions between the atmosphere and forests can sig-nificantly reduce or amplify impacts of the main anthro-pogenic factors on the climate change. Forests provide many services such as the hydrologic cycle regulation, biodiversity protection, food provision and other prod-ucts [1, 5–7]. Also, forests are recognized to sequester overall large quantities of carbon, approximately 45 % of the total terrestrial carbon stock [8]. Therefore, a better understanding of the carbon exchanges dynamics within forests and a determination of their contribution to the global carbon cycle appear important for the studies focusing on interactions between these vegetation types and the atmosphere. Forest responses to the main mete-orological factors whose changes can favor or limit the vegetation development increase the importance of the scientific community [9–11]. Nemani et al. [12] under-line that the vegetation growth is strongly limited by water availability over 40 % of the vegetated surface of the Earth while the temperature and radiation would respec-tively limit this growth only to 33 and 27 %. It appears relevant to improve the overall climate impacts on the plant growth in order to better forecast the future veg-etation patterns, especially in the climate change con-text. The dynamics of carbon fluxes within the terrestrial
ecosystems and with the atmosphere could help to define the strategies to better mitigate the impacts of the vari-ability and change of climate [1, 4, 13].
Tropical forests cover 7–10 % of the global land area which store approximately 40–50 % of the total terres-trial vegetation carbon [1, 14], mainly through the bal-ance between respiration and photosynthesis processes. Moreover, the vegetation growth seems to be strongly limited by the drought conditions occurring overall in tropical regions during the dry seasons [15, 16]. In recent years, the tropical forests seem to maintain at a high level their evapotranspiration rate and carbon storage in rela-tion not only to the increase in the air temperature and atmospheric CO2 concentration, but also to the annual
rainfall improvements at the tropical regions [9, 17–19]. They act mostly as net carbon sinks [1, 7, 19, 20]. How-ever, the future of these ecosystems seems to be uncer-tain not only because of the climate change, but also because of the anthropogenic pressures in relation with the high population growth rates [1, 4, 5, 21].
Over the last decades, although they have been sub-ject to intensive human pressures, African forests have responded to the satisfaction of the needs of the popu-lations or several environmental challenges [1, 5, 6, 13]. In West Africa, the woodlands and forests remain very important because they are the main source for energy, building poles and livestock fodder for both the rural and urban populations. In recent years, only few studies have focused on the water and carbon exchanges between the atmosphere and woodlands or forests have been reported in West Africa, especially in Benin [22, 23], Mali [24] and Niger [25, 26]. In Benin, the woodlands are mostly located in the northern part of the country where the Résultats: Cette etude montre une réponse claire de l’absorption du CO2 à la densité de flux de photons photosyn-thétiques, mais elle est différente selon les saisons. Après une longue et significative période sèche, la respiration de l’écosystème (R) augmente immédiatement en réaction aux premières pluies significatives. Aucune dépendance claire de la respiration de l’écosystème à la température n’a été observée. Les forêts claires dégradées ouest-africaines sont probablement neutres en considérant leurs échanges de carbone à l’échelle annuelle avec l’atmosphère. L’échange net de l’écosystème (NEE) est négatif pendant la saison humide et positif durant la saison sèche, et son cumul annuel est égal + 29 ± 16 g C m−2. L’écosystème apparaît être plus efficient dans la matinée et en saison humide que
pen-dant l’après-midi et en saison sèche.
Conclusion: Cette étude a montré d es variations journalières et saisonnières contrastées des flux de CO2 en rela-tion avec l’alternance entre les saisons sèche et humide. Le site investigué est à l’état d’équilibre en considérant ses échanges de carbone avec l’atmosphère. La durée de la période d’observation était trop courte pour justifier l’hypothèse de la neutralité des forêts claires dégradées ouest-africaines par rapport aux échanges de carbone avec l’atmosphère à l’échelle annuelle. En outre, l’échange net de l’écosystème dépend de l’intensité des perturbations dues au système de gestion du site. D’autres recherches sont nécessaires pour définir une politique de gestion des forêts claires qui contribueraient à maintenir ceux-ci comme de puits nets de carbone.
Mots clés: Eddy-covariance, Forêt claire, Climat soudanien, Echange net de l’écosystème, NEE annuel, Bénin, Afrique
Nangatchori site is located and occupy almost two-thirds of the total dense forest area with a woody cover between 40 and 75 % [27]. Increasingly, these ecosystem types are deforested, disturbed and converted into agricultural areas [23, 28, 29].
In this study, we have analyzed water and CO2 fluxes
measurements made for 17 months, from November 1, 2005 to March 31, 2007 in the framework of the interna-tional AMMA program (http://www.amma.org) over a degraded woodland.
The main objective of this paper is to analyze the dynamics of carbon exchanges over a degraded woodland site. Notably, we have considered the following questions: (1) How did the net exchange ecosystem (NEE) and its two major components, ecosystem respiration (R) and gross primary production (Gp) respond to changes in the
environmental conditions at the site? (2) What were the driving variables of these fluxes at the daily and seasonal scales and (3) Finally, was the degraded woodland a car-bon sink or source at the annual scale during the eddy-covariance measurements period?
Results and discussion
Weather context, vegetation growth and fluxes overview
In order to study the carbon fluxes dynamics over the degraded woodland, it appears useful to first describe the evolution of the key meteorological factors. Seasonal evolution of the daily average of photosynthetic photon flux density (Qp), light index (K), vapour pressure
defi-cit (VPD), relative humidity (RH), air temperature, Leaf Area Index (LAI) and precipitation are given in Fig. 1. The climate at the site region is overall characterized by a succession of two main seasons, a dry one (Novem-ber–April) and a wet one (May–October). This season-ality is typical of the Sudanian region, which is strongly controlled by the West African Monsoon regime, clearly highlighted through the seasonal variations of precipita-tion (Fig. 1e), RH (Fig. 1e) and VPD (Fig. 1c). Two transi-tional periods, wet-to-dry ON (October–November) and dry-to-wet AM (April–May) can be identified between the two seasons (Ago et al. submitted). During the year, the main wind direction remained South-West, except from December to January where it was North-East and dominated mostly by the Harmattan winds. The daily average speed was between 0.5 to 3.0 m s−1 (Fig. 1a).
There was a low seasonal variability in the daily average air temperature, which ranged between 21 and 25 °C, but reached 31 °C at the end of the dry season (Fig. 1c). The vapour pressure deficit (VPD) was lower than 0.5 kPa during the wet season and higher (2–3 kPa) during the dry one, with a maximum value of 4 kPa at the end of March (Fig. 1c).
The daily average QP varied from 335 µmol m−2 s−1
in July to 675 µmol m−2 s−1 during November (Fig. 1d).
As a result, the light index K was low and more or less stable around 0.5. This was probably due to the cloudi-ness regime and the aerosols or dust loads brought from North-East by the Harmattan winds that reduced strongly the incoming radiation [30–32]. During the wet season, the light index K was went down to 0.2–0.3 (Fig. 1d).
Due to the Sudanian climate, most of the total pre-cipitation is concentrated between May and October (Fig. 1e). The total rainfall during 2006 was 850 mm with 101 rainy days. This is in agreement with the regional averages for dry years from 1921 to 2009 [31, 33, 34]. The RH variability was also impacted by the Monsoon flux intrusions, South-West winds, bringing the moist from the ocean to continental surfaces in West Africa, leading to an increase in the air humidity which generally starts from February though rains have not start yet at that moment [31, 35, 36]. RH was usually high, up to approxi-mately 90 % and low of 20–50 % during the wet and dry seasons, respectively (Fig. 1e).
LAI varied seasonally, with relatively low value during the dry season (lower value of 0.2 m2 m−2 in January)
(Fig. 1b), but always significantly different from zero due to the presence of an herbaceous strata, a few crops non still harvested and sparse trees or shrubs. LAI increased continuously from January to March due to the leaves renewal for most of the woody species such as Isoberlinia sp, and reached a maximum value of 2.8 m2 m−2, i.e. the
full development of the whole vegetation with the rain onset, between April and May months [22, 33, 37, 38].
Footprint contributions of different vegetation types to the measured fluxes
A footprint analysis was conducted to address the spatial representativeness of the measured fluxes. It reveals that each vegetation type (Fig. 2) contributed significantly to the fluxes depending on the wind occurrence from the two main directions during the year (North-East and South-West). The major contribution of the measured fluxes was emitted by the degraded woodland. Compar-ing the two main seasons, this contribution was more important during the wet season than the dry one. This analysis shows that the area contributing to 90 % of the measured fluxes extended up to 230 and 434 m respec-tively the day and night conditions.
During the dry season, the wind direction was mainly North-East and the daytime fluxes measurements were impacted primarily by the degraded woodland surround-ings (71 %) and by a few perennial herbs (mostly C4 plants), bare soil and fallow (29 %). During the night, with
a contribution of 64 %, the degraded woodland impacted less the measured fluxes compared to those of the day.
During the wet season, the wind primarily blew South-West when the vegetation was fully developed (Fig. 1b), especially around the tower where most of the shrubs, trees, herbs and crops covered the site area. Most of the degraded woodland being located South-West, near the tower was mainly included in the footprint areas in day-time. Therefore, measured fluxes were significantly and largely affected by the degraded woodland (74 %) fol-lowed by the cultivated areas for 26 %. In nighttime, the contribution was almost similar to 69 % of the contribu-tion from the degraded woodland.
As a conclusion, one can say that the fluxes measured at the Nangatchori site reflected mostly those of a culti-vated area and a degraded woodland respectively for the dry and wet seasons. Therefore, the contribution of trees and shrubs (mostly by C3 species) to the measured fluxes appeared all time more important than that of herbs strata or crops areas (mostly C4 species).
Temperature response of nighttime fluxes and their relationship with relative humidity
The plot of nighttime fluxes for unstable conditions (u* > 0.10 m s−1) against the half-hour air temperature
measurements during both the wet and dry periods (Fig. 3)
Fig. 1 Seasonal evolution of the average daily meteorological variables from 1 November 2005 to 31 March 2007: a Wind speed, b Leaf Area Index
(LAI), c vapour pressure deficit (VPD) (grey continuous line) and air temperature (dark discontinuous line), d light index (K) (dark continuous line) and photosynthetic photon flux density (Qp) (grey histogram), e precipitation (dark histogram) and relative humidity (RH) (grey discontinuous line)
reveals no clear dependence of the nighttime ecosystem respiration on temperature. This could be due to the range of the temperature variability (daily average range <10 °C) at the Nangatchori site or masked by the response to the soil moisture [39–42]. However, a highly significant posi-tive correlation (R2 = 0.63; p < 0.001) was found between
the nighttime average of the ecosystem respiration and rel-ative humidity (Fig. 4). This might suggest a significant pos-itive correlation between nighttime averages of ecosystem
respiration and soil moisture as the latter co-vary season-ally (daily scale) with RH at the site region [33]. Finally, the average of the nighttime ecosystem respiration was 1.15 ± 0.33 and 6.54 ± 2.31 µmol m−2 s−1 respectively for
the dry and wet seasons.
Lack of or very little relationship was also found between nighttime fluxes and temperature for tropical forest and savanna sites [37, 43–45]. In contrast, other studies report that, for several dry west African sites,
Fig. 2 Land use distribution for a 1 km2 area around the flux tower
Fig. 3 Relationship between the half-hour nighttime net ecosystem exchange (NEE) and air temperature during the wet and dry periods. Only data
the ecosystem respiration was primarily driven by tem-perature [46–50] and secondly by soil moisture. For the Skukuza semi-arid South African savanna site, while Williams et al. [43] find an unclear relationship between nighttime fluxes and temperature using 52 months of data series, Kutsch et al. [51] observe only with 9 months of fluxes data a dependence on this variable. Finally, the respiration dependency with temperature seems to be influenced in the tropical regions by the temporal scale of flux measurements or combined effects of other climatic factors [45].
Response of daytime fluxes to radiation Qp
It is widely recognized that light drives CO2 uptake at the
ecosystem scale [52]. Therefore, we examined first how the daytime NEE has responded to the radiation vari-ations, i.e. the photosynthetic photon flux density (Qp)
changes. As, the vegetation density changes seasonall (shown by LAI seasonal variation), we have examined this relationship during the two main seasons (Fig. 5). The difference between the two seasonal variations indi-cates two contrasting phenological and physiological patterns. In daytime, NEE steadily increased (in abso-lute value) with the radiation increasing due likely to the CO2 absorption by the green leaves, and then saturated
at high radiation (above 1000 µmol m−2 s−1). During the
dry season, when the LAI value was overall lower than 0.5 m2 m−2, the light saturation was not so clear. Based
on the statistics of the non linear model fitting of day-time fluxes using Eq. (1) on 15 days windows, regres-sion coefficients indicate that the variations in NEE were explained by 50–72 % of the changes in Qp confirming
the dominant role played by the radiation in the CO2
absorption of the ecosystem. Amax and α varied from
1.8 ± 1.3 to 14.0 ± 1.8 µmol m−2 s−1 and 0.006 ± 0.002 to
0.040 ± 0.016 µmol µmol−1 respectively for dry and wet
seasons.
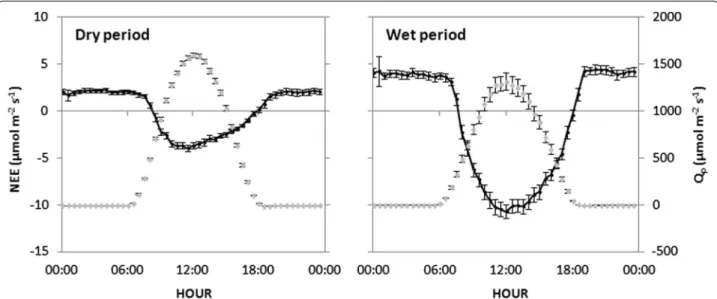
These seasonal changes in diurnal patterns of NEE can also suggest an influence of green leaves density on respiration and photosynthesis in response to the varia-tions in the main environmental condivaria-tions. The aver-age diurnal courses of NEE and Qp during the two main
vegetation growth seasons are displayed in Fig. 6 to illus-trate this assertion. In daytime, the evolution of NEE depended mainly on the Qp variations and the canopy
density, all two seasons showing a similar NEE curve pattern to Qp (Fig. 6). Maximum values of NEE and Qp
were observed around noontime. During the wet sea-son, NEE has reached −10.7 ± 0.7 µmol m−2 s−1, a
value significantly higher (in absolute value) than the NEE (−4.0 ± 0.4 µmol m−2 s−1) found in the dry
sea-son. This was due to the small density of green leaves
Fig. 4 Relationship between the mean nighttime net ecosystem
exchange (NEE) and mean nighttime relative humidity (RH) for the whole of period measurements (1 November 2005 to 31 March 2007). Only data for u* >0.10 m s−1 are shown
Fig. 5 Response of the half-hour daytime net ecosystem exchange (NEE) to photosynthetic photon flux density (Qp) for both the wet and dry periods
(LAI ~0.2–0.5 m2 m−2) combined to a lesser extent with
higher VPD. In addition, a dissymmetry was observed in the diurnal NEE evolution more remarkably in the dry season than in the wet one (Fig. 6) suggesting a par-tial stomatal closure impact during the afternoon. This leads to a limitation of CO2 absorption by the ecosystem
besides the radiation control.
This range of CO2 uptake at light saturation (Amax), and
quantum light efficiency (α) was well consistent with that reported in other studies for savanna and forest sites in Benin under the Sudanian climate (Ago et al. submit-ted). However, the corresponding Amax and α values were
lower than those reported by Tagesson et al. [53] for a savanna grassland site in Senegal.
Daytime water use efficiency (WUE) and evaporative fraction (EF)
Daytime WUE patterns for dry and wet periods are displayed in Fig. 7. They show values ranging from 0.40 ± 0.09 to 5.79 ± 1.55 and from 0.83 ± 0.11 to 8.25 ± 1.94 mmol C (mol H2O)−1 respectively for the dry
and wet periods. For both wet and dry seasons, a similar decreasing trend was found from morning to afternoon following the VPD increase. During morning, WUE was high, mainly due to the radiation increasing with low VPD. Thereafter, it declined progressively until afternoon as VPD has increased and reached its maximum value around 3.00 p.m. This suggests a partial stomatal closure impact besides the radiation control [54]. Similar daytime
Fig. 6 Diurnal courses of half-hour mean net ecosystem exchange (NEE) (dark continuous line) and photosynthetic photon flux density (Qp) (grey
discontinuous line for both the dry and wet periods. Error bars represent 95 % confidence interval
Fig. 7 Daytime evolution of the half-hour mean water use efficiency (WUE) (black continuous line) and vapour pressure deficit (VPD) (grey square)
WUE patterns and magnitudes were reported for similar ecosystems in West Africa by several authors, especially in Benin for cultivated savanna [37] and forest sites (Ago et al. submitted); in Niger for savanna and millet crops [50, 55–57]; and in Southern Africa for savanna, wood-land and forest sites [44, 58]. However, at the noontime and sunset, WUE values for our investigated site were lower than those reported for savanna and millet crops in West Africa. These differences could be explained by dif-ferences found in canopy covers of the vegetation, growth stages and species physiology [56, 59]. Indeed, savanna and millet crops canopies are generally less dense com-pared to those of woodland. In this latter case, larger can-opies are more efficient at the intercepting rainfall leading to high subsequent evaporation from leaves and lower WUE values in the afternoon. Similar observations have been reported for Kataba forest in Zambia [58]. However, the WUE values at the Nangatchori site were consistently lower during the dry season than the wet one. This is due to variations in the vegetation growth along the year, confirmed by LAI seasonal changes (Fig. 1b).
The EF daytime evolution presented in Fig. 8 shows a typical concave up shape which is more pronounced during the dry season than the wet one. During the dry season, the minimum daytime EF values were observed around noontime, and the highest values were found both in the early morning and late afternoon. During the wet season EF decreases rapidly from 0.8 at sunrise and reaches its lowest value of 0.6 at 8.30 a.m. This is prob-ably due to the radiation increase that favors the water evaporation from the ecosystem. After that, EF remains relatively constant until 3.00 p.m. when the VPD reaches its highest value. These EF diurnal evolutions suggest that during the morning when the radiation increases
(Fig. 6) with low VPD (Fig. 7), the sum of turbulent fluxes (H + LE) increases faster than the latent heat flux (LE) alone. An opposite EF behavior was observed in the after-noon with the decrease in radiation evolution and high VPD, i.e. the latent heat flux (LE) increases faster than the turbulent fluxes sum (LE + H). The diurnal cycles of H and LE reported in Africa for similar Sahelian [24, 60, 61] and Sudanian sites [22, 33, 62] support well this diurnal EF behavior. Overall, daytime values of EF ranged from 0.4 to 0.8 for the ecosystem investigated here. However, this overall diurnal EF behaviors, which has been hypoth-esized by Lhomme and Elguero [63] was also reported with consistent magnitudes for similar African sites using the eddy-covariance measurements, notably in Benin for cultivated savanna [30] and in Morocco for sparse veg-etation [64, 65].
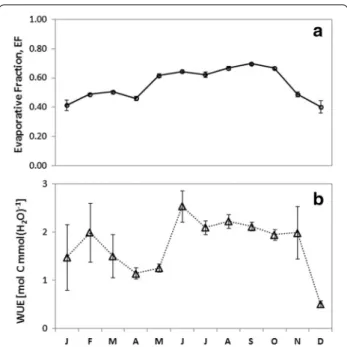
Seasonal variations patterns of EF and WUE
The EF and WUE seasonal variations (monthly mean) during the year are given in Fig. 9. As expected, similar contrasted trends were observed in WUE and EF sea-sonal variations. This was mainly due to variations of the vegetation growth and available energy in relation with main environmental conditions changes between the dry and wet seasons. During the dry season, WUE and EF, increased gradually from December due prob-ably to the renewing leaves, reached overall in February and decreased to together with the air humidity increase, although the precipitation did not start yet [31, 35, 36]. This led to a significant increase in the water vapour flux from February at the studied site region [22, 30], and induced a WUE decrease from February to April despite the net CO2 absorption by a few perennial herbs and
sparse trees keeping their green leaves or renewing them
Fig. 8 Daytime evolution of the half-hour mean evaporative fraction (EF) for both the wet and dry periods. Error bars represent 95 % confidence
[37]. From May when the rain events became more fre-quent, EF and WUE increased progressively again and reached their maximum yearly values in August–Sep-tember. From October, a decline trend was observed until December due to the significant reduction of the vegetation density and activity induced by crops harvest, frequent fires, senescence and desiccation processes dur-ing the drought, but also to the soil dryness inducdur-ing an evapotranspiration decrease. However, most of shrubs or trees keep some green leaves or renew them, and can
satisfy their atmospheric demand of the water through their roots system which was able to use water from the deep layer. This might explain well the low, but still sig-nificant values of EF and WUE that were observed in the dry period.
Finally, monthly average values of WUE varied from 0.51 ± 0.07 to 2.54 ± 0.32 mmol C (mol H2O)−1 and EF
from 0.40 ± 0.17 to 0.70 ± 0.01 (Fig. 9). Similar seasonal WUE trends were reported for similar African sites: in Benin for savanna [37] and forest (Ago et al. submitted); in Niger for savanna and millet crops [56, 57, 60]; and in Southern Africa for forest, woodland, shrubland and savanna [44, 58, 59].
As WUE, EF seasonal values and trends were also consistent with findings reported in Africa by several authors: in Benin for forest and savanna [22, 33] and in Kenya for woodland and grassland [66].
Influence of rain events on ecosystem respiration R
In order to better analyze the impact of precipitation on the total ecosystem respiration R, we have displayed in Fig. 10 the evolutions during 2006 of daily sums of res-piration and rainfall. There is an immediate increase of R after the first significant rain events following drought periods. This was clearly observed on March 14, April 19 and July 15 with cumulated rainfall respectively for 12.3, 10.4 and 28.6 mm. When no rain was recorded during a long period, a decrease was observed in R. Reversely, when rainfall events became more regular, the ecosys-tem respiration increased continuously before reaching their highest and stable values (~4.9 g C m−2 day−1) in
August–September. After the last significant rain, the ecosystem respiration tended to decrease back to low val-ues (~2.4 g C m−2 day−1) at the end of rainy season and
Fig. 9 Seasonal evolution of the monthly average evaporative
frac-tion (EF) and water use efficiency (WUE) during the whole measure-ments period. Error bars represent 95 % confidence interval
during the subsequent dry season. During drought peri-ods, the soil micro-organisms activity was very low and the soil wetted by first rains induced bursts in the activity of soil micro-organisms.
This sudden increase observed in the ecosystem respi-ration following significant rainfall after a relatively long drought period was also reported by several authors for other water-limited ecosystems in Africa: in Burkina Faso for savanna [48], in Niger for millet and savanna [55] and in South Africa for savanna [43], and elsewhere in the world: in USA for grassland and savanna [42, 67, 68] and in China for a typical steppe [69]. Indeed, in water-lim-ited sites, first rain events cause generally a great stimu-lation in the soil microbial activity after a relatively long drought period.
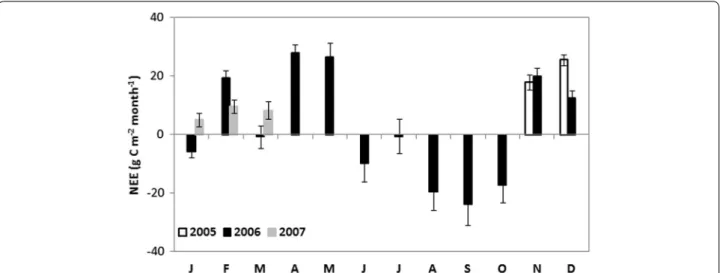
Seasonal variations of carbon fluxes (NEE, R and Gp)
In order to better understand the seasonal evolution of fluxes taking into account the changes observed in footprint areas between dry and wet seasons, monthly cumulated values of carbon fluxes (NEE, R and Gp) are
presented in Figs. 11 and 12. Overall, along the year, the carbon flux dynamics were unsurprisingly submitted to a strong seasonal variability. The site behaved as a carbon sink during the wet period while it was a carbon source during the drought and dry-to-wet transitional periods (Fig. 11). This suggests that Gp was consistently higher
than R only during the wet periods when the vegetation greatly grew to reach its highest cover area at the site. The NEE evolution was likely related to that of both res-piration R and photosynthesis Gp.
During the dry season, Gp was significantly reduced
(in absolute value) in comparison to their values during
the wet season. The reduced Gp values during the dry
season results mainly from the reduced density of green leaves which were still kept or renewed during this period by shrubs or trees, a few perennial herbs and late crops still non harvested which composed the ecosys-tem. Gp started to increase (in absolute value) after the
first rain events in March 2006 when most of the green leaves started also their growth. A break in precipita-tion, as observed in April 2006 induced a drought with subsequent decay in the new initiated leaves, leading to a decrease in Gp (in absolute value). From May, when
pre-cipitations become more regular inducing probably an increase and stable soil moisture, especially from April to October, Gp increased and reached its maximum
val-ues in August–September. Therefore, the vegetation grew rapidly with a continuous increasing in the photo-synthetic capacity. This was confirmed by the evolution of LAI from April to October. After the last rain events, especially during November–December, Gp tended to
decrease to its lowest value due not only to the start-ing drought conditions (decrease in soil moisture and increase in VPD), but also to crop harvest, leaf senes-cence and desiccation processes.
Ecosystem respiration R also showed a high seasonal variation related to precipitation regime and seasonal vegetation development. During dry season, R was low probably due to the soil drought conditions induced by the lack of rain and vegetation growth reduction. While Gp (in absolute value) drops if first rains are not
fol-lowed during the time by others, R increases from March to April. This suggests that the increase observed in soil water availability induced by first rains, appears suffi-cient to continue to stimulate the carbon release. During
Fig. 11 Evolution of monthly cumulated net ecosystem exchange (NEE) from 1 November 2005 to 31 March 2007. Error bars represent 95 %
November–December. As for Gp, R was low probably
due to the soil dryness as no rain was recorded and green leaves density reduction. This suggests that during the wet-to-dry transitional and dry periods, the ecosystem has lost continuously carbon via the soil and little plants respiration, but at low rate, mainly due to the soil dryness.
However, during the wet season, if a significant drought appears both R and Gp would be reduced. This was especially observed during July 2006 with a significant drought induced by a decrease in precipitation ranging from 18 to 8 mm from June 18 to July 3 2006, followed by 12 continuous days without rains (Fig. 1e).
Similar seasonal variations of R and Gp between dry
and wet seasons were reported in other studies for simi-lar ecosystems in West Africa, especially in Benin for savanna [37] and forest (Ago et al. submitted), in Burkina Faso for savanna [48], in Burkina Faso for crop/fallow in Ghana [46] and in Niger for fallow savanna [49]; and elsewhere in Africa, e.g. for semi-arid savannas in Bot-swana [70] and in South Africa [71], and for papyrus and cocoyam wetland in Uganda [72].
Annual net carbon exchange and implications for management strategy
During the year 2006, the cumulated NEE was +29 ± 16 g C m−2 (±CI) indicating that the site was close to an equilibrium ecosystem. In the years preced-ing the flux measurements period, the Nangatchori site has been highly disturbed as underlined by other authors [73, 74]. These disturbances (mainly deforestation and degradation) would explain the carbon behavior of the studied site in 2006 [1, 3, 7, 20, 49]. However, flux data collected for 17 months didn’t allow us to better analyze
the sensitivity of the ecosystem to disturbance. Until now, no management site strategy was defined by the forest office.
These results were comparable with those reported by several authors in Africa for similar sites on a yearly basis. In West Africa, some sites acted as net carbon sinks: cumulated NEE of −232 ± 27 (±CI) for a culti-vated savanna [37] and −640 ± 20 g C m−2 (±CI) for a
forest (Ago et al. submitted) in Benin, −32 g C m−2 for a
fallow savanna in Niger [49], −239 g C m−2 for a semiarid
savanna grassland in Senegal [53], −387 ± 23 g C m−2
(±std) for a shrub savanna in Ghana [46]. In contrast, other sites acted as net carbon sources: cumulated NEE of +128 ± 7 and +108 ± 6 g C m−2 (± std) for a short
grassland savanna and fallow/cropland in Ghana, respec-tively [46]. In South Africa, Archibald et al. [71] reported an average cumulated NEE of +99 ± 35 g C m−2 (±CI)
for a semi-arid Savanna on 2 years. This large variabil-ity in patterns of African sites could be explained by the vegetation types, management systems and disturbance degrees as reported by several authors [46, 48, 49, 71]. Conclusion
This study has analyzed the eddy covariance fluxes meas-ured between 1 November 2005 and 31 March 2007 over a degraded woodland located in northern Benin (West Africa). To our knowledge, this is the first long term eddy-covariance data set of carbon flux that is analyzed over woodlands in West Africa.
This study has showed seasonal contrasted variations in carbon fluxes (NEE, R, Gp), evaporative fraction (EF)
and water use efficiency (WUE) in relation to the alter-nation between dry and wet seasons. Fluxes responses to
Fig. 12 Evolution of the monthly cumulated ecosystem respiration (R) (empty triangle, square, circle) and gross primary productivity (Gp) (full
the main environmental variables changes were studied. At the day scale, fluxes were mainly controlled by radia-tion and to a lesser extent by the VPD. Nighttime fluxes were observed to be strongly influenced by air humidity, but seemed quite insensitive to temperature. While no clear VPD impact on EF was observed likely due to the roots system capacity of trees or shrubs to use the water from deep layers of the ground during the drought, a limited VPD impact on WUE was found. However, with respect to the use of water resources, the Nangatchori site appeared more efficient during morning than after-noon, and evaporated more water around the noontime than both at sunrise and sunset. At the seasonal scale, the rainfall and probably the soil moisture appeared to be the main factors controlling the carbon fluxes variabil-ity between the dry and wet seasons. According to water use, the investigated site evaporated more and was more efficient during the wet than dry season.
Finally, the Nangatchori site was near of the equilib-rium with a cumulated NEE of +29 ± 16 g C m−2 during
the year 2006. In order to better clarify this vegetation pattern in the context of the climate change, fluxes obser-vations during several years will be necessary. The eco-system remains highly disturbed annually by frequent bushfires, intensive agriculture activities, illegal trees log-ging and cattle grazing.
Methods
Site description
The study was focused on a site (9.65°N, 1.74°E, 432 m) located in the Nangatchori village, approximately 20 km south of the Nalohou site which has already been described and studied by other authors [30, 33, 37]. The site is a typical degraded woodland that has been highly disturbed by illegal cattle pasture, intensive agriculture activities, tree logging and bushfire in the past years [36,
73, 74]. Northern Benin is a part of the Sudanian climatic region. It is characterized by an average annual rainfall of 1254 mm (1950–2009 average), of which 90 % occurred between April and October [33].
The soil at the Nangatchori site is a Luvisol skeleta chromic (FAO classification) composed mainly of 5–13 % clay, 77–85 % sand and 7–9 % silt on the surface horizon (0–50 cm depth) and 28–32 % clay, 50–56 % sand and 12–18 % silt in the roots zone [75]. In this region, most of the original landscapes have been undergoing hydric ero-sion [76, 77] for several decades. The site was composed by some sparse woody and herb vegetation, typical of the Sudanian region, with a species composition varying between dry and wet seasons [78, 79]. A floristic inven-tory during wet seasons of the most abundant species showed a heterogeneous vegetation composed mainly by some natural woody species (Isoberlinia spp, Monotes
kerstingii, Parkia biglobosa, Uapaca togoensis, Vitel-laria paradoxa), tree crops (Blighia sapida, Anacardium occidentale, Tectona grandis), annual crops (Dioscorea spp, Manihot esculenta, Zea mays, Pennisetum spp, Sor-ghum bicolor, Arachis hypogaea) and herbs (Andropogon guayanus, Imperata cylindrical, Andropogon tectorum, Panicum maximum). On the basis of LANDSAT TM scenes obtained in 2010, the area of 1 km2 around the
flux tower was characterized. It was mainly constituted by the degraded woodland (28 %) and crops/fallows/bare soil (72 %) (Fig. 2). The main wind directions were South-West and North-East during the wet and dry seasons, respectively [36]. Generally, from November to March, most of herbaceous strata were burned by farmers with cultivated parcels mainly covered by crops residues and litter. Most of the leaves fall from trees occurred at the end of the wet season (October), except species such as Isoberlinia spp and fruit trees which kept their leaves during the dry season [28, 33, 37, 38].
Fluxes, meteorology and other variables measured
Fluxes of CO2, water vapor and sensible heat were
meas-ured continuously at the Nangatchori village over a degraded woodland by the eddy covariance technique. The flux system, placed at 8 m above ground, approxi-mately and respectively for 3 and 7 m above trees and crops canopies, was made up by a 3D sonic anemometer (Model Solent Research R3, Gill Instruments, Lymington, UK) coupled with an open-path infrared gas analyzer (IRGA, Licor 7500, Inc., Lincoln, NE, USA) that recorded the fluxes at a 8 Hz frequency.
The deployed meteorological station failed to measure complementary meteorological data at the site. As a back up solution, we have used the half-hour data recorded to the nearby site of Nalohou during the same period of the fluxes measurement. To do this, we have checked that the seasonal (daily) variability and magnitudes of the main meteorological parameters (i.e. mainly the radia-tion, temperature, vapour pressure deficit) were similar at a few kilometres scale in the whole Djougou district, except rainfall and soil moisture [22]. Details on meas-urements and calculations of main meteorological vari-ables can be found in Ago et al. [37]. All these variables were sampled every 30 s and averaged half-hourly. The radiation sensors were calibrated by a comparison annu-ally with standard sensors (CGR4 and CMP21 Kipp and Zonen, Delft, The Netherlands). Both fluxes and meteor-ological conditions were recorded for 7 months from 1st November of 2005 to 31th March of 2007.
The net carbon exchange (NEE) was computed every half hour as the algebraic sum of turbulent fluxes meas-ured by eddy-covariance technique and of storage fluxes considering as negligible the additional terms [80]. As we
did not have CO2 profile measurements throughout the
canopy, storage flux term was computed from the single CO2 concentration measurements at 8 m above ground
[37, 46, 51, 53, 61]. This approach can be generally criti-cized, but may be acceptable in the present study because of the openness of the canopy and relative low height of the eddy-covariance system [81].
CO2 fluxes calculation was performed using the
Eddy-flux Software package [82] and following the standard methodology proposed by Aubinet et al. [52]. The flux data treatment included the despiking, double rotation, spectral corrections and WPL correction. Fluxes of CO2
were submitted to a stationarity test [83] and only the data that met the quality test with a deviation lower than 60 % were used to establish the fluxes responses to driv-ing meteorological factors. A photosynthetic photon flux density (Qp) criterion was used to separate data between
night and day, with a threshold of 5 µmol m−2 s−1 [84].
In order to correct the nighttime fluxes error, a u*-filter-ing was applied [47, 52]. Like studies conducted in other African sites, the filtering criterion was chosen by a visual approach [37, 55, 71] and the u* threshold of 0.10 m s−1
was found for the investigated site. Data gaps in the flux time series resulting from the eddy-covariance system failures, power cuts or data removal because of poor quality or stable conditions were filled using the flux responses parameterizations to the main meteorological driving factors. For the site, 47 and 39 % of the missing data were filled respectively for the nighttime and day-time fluxes. For dayday-time gaps, we have used the Mister-lich equation, Eq. (1) to describe the fluxes responses to radiation, i.e. Qp [37, 80, 85]. This was done using 30-min
data for 15 days windows.
where NEE is the net ecosystem exchange, Qp the
pho-tosynthetic photon flux density, rd the dark respiration;
α the quantum light efficiency and Amax the NEE at the
light saturation.
A non-linear regression was performed to deduce the three characteristic parameters using the Levenberg– Marquardt algorithm (MATLAB, R2010b version, The Mathworks, Natick, USA).
The site is characterized by a low seasonal (daily mean) variability in temperature (<10 °C) and large changes in precipitation often accompanied with variation of both the atmospheric humidity and soil moisture. In Sudano-Sahelian climate, these two variables (temperature and soil moisture) co-vary generally at the seasonal scale [22, 33, 53, 86]. Therefore, the nighttime fluxes were not
(1) NEE = −[Amax+rd] ∗
1 − exp −αQp (Amax+rd) +rd
predicted to vary significantly with temperature [39, 41] as in other similar African sites [37, 43, 44]. Nighttime fluxes would depend strongly on soil moisture. As no soil moisture data was recorded for the site, the average of nighttime fluxes rn unavailable were filled by the
expo-nential relationship between rn (u* > 0.10 m s−1) and the
nighttime average of relative humidity (RHn), i.e. Eq. (2)
following:
where a is the minimum value of the nighttime fluxes average and b a parameter characterizing the sensitivity of the average nighttime respiration to RH. These two parameters (a and b) were determined using the whole nighttime fluxes of unstable conditions (u* > 0.1 m s−1)
during the whole period covered by the eddy-covariance measurements. The daily sum of the nighttime ecosystem respiration (Rn) was estimated by Rn=rn∗DL, with DL
(s day−1) representing the night length of a day.
Flux-partitioning was performed into two main com-ponents, i.e. gross primary productivity (Gp) and
ecosys-tem respiration (R). In order to better take into account the photosynthesis processes occurring during day con-ditions, we have estimated the daily sum of daytime eco-system respiration (Rd) using the dark respiration, rd,
provided by the light-responses of the daytime flux meas-urements from Eq. (1) above by Rd =rd∗DL, where DL
(s day−1) is always the light length of a day. This approach
has been recently more used to derive the daytime res-piration by several authors [84, 87–90]. It can complete the methods based on the nighttime flux [52, 91] using the nighttime respiration responses to the main mete-orological variables such as temperature [46, 48, 92] or soil moisture [37]. Thus, Gp was inferred by subtracting
the total daily sum of ecosystem respiration R from NEE calculated from half-hourly measured fluxes by the eddy-covariance technique or gap-filled. The daily sum of R was obtained by adding Rd and Rn.
The sampling error on individual gap-filled flux was estimated for both daytime and nighttime fluxes to twice the standard error (95 % confidence interval) of the gap-filling model residuals [37, 93]. Finally, the total uncertainty on flux (NEE) was computed (95 % confi-dence interval) using the Richardson and Hollinger [94] approach assuming that the two error sources on its two major components were independent.
As the site is composed by a heterogeneous vegeta-tion cover, we have made a footprint analysis during the unstable and neutral conditions in order to deter-mine the contribution of each source to the measured fluxes. This was done for the whole measurements period for the two major wind directions using the software tool proposed by Neftel et al. [95]. This (2) rn=a*Exp (b* RHn)
method is based on the two-dimensional analytical footprints model according to the Kormann–Meixner footprint model [96]. This model was applied to each half-hour value of the flux to obtain the contribution of each vegetation type to the measured fluxes dur-ing the wet and dry seasons. The model inputs are the main variables that are supplied by the eddy-covar-iance system i.e., the measurement height, friction velocity, displacement height, Obukhov length, hori-zontal wind velocity, standard deviation of the cross wind speed and wind direction.
Water use efficiency (WUE) is defined as the ratio of absolute values of NEE and water vapour flux E [55, 57,
97]. It was calculated using only NEE values correspond-ing to Qp ≥ 400 µmol m−2 s−1 [37], as it is found to be
sensitive to lower radiation when no water stress is pre-sent [98].
Leaf Area Index (LAI) time series were obtained by a combination of satellites LAI products (SEVIRI) con-strained by in situ measurements. Main species domi-nating the ecosystem were inventoried in a 1 km2 plot
surrounding the tower during wet period when the veg-etation was fully developed.
Finally, the evaporative fraction, EF (%) was calculated following Eq. (3) below in order to analyze the frac-tion of the available energy, i.e. the sum of latent (LE) and sensible heat (H) fluxes which is converted into evapotranspiration:
Abbreviations
AMMA: African Monsoon Multidisciplinary Analyses; RH: relative humidity; K: light index; LAI: Leaf Area Index; H: sensible heat; LE: latent heat; Qp:
photosyn-thetic photon flux density; VPD: vapour pressure deficit; NEE: net exchange ecosystem; WUE: water use efficiency; EF: evaporative fraction; R: ecosystem respiration; Gp: gross primary productivity; NA: November–April; AM: April–
May; MO: May–October; ON: October–November; CI: 95 % confidence interval; Std: standard deviation.
Authors’ contributions
While EEA has conducted the main part of data analysis and prepared the manuscript with contributions from all co-authors, DS, on his has carried out the installations of the eddy-covariance system, measured and processed the raw fluxes data. In addition, SG has dealt with the meteorological station and measured the main environmental conditions. Furthermore, MA and EKA have been in charge of assisting in the data analyses. All authors read and approved the final manuscript.
Author details
1 Axe Exchange Ecosystems-Atmosphere, Department of Biosystem
Engineer-ing (BIOSE), University of Liege, Gembloux Agro Bio Tech, 8, Avenue de la Faculté, 5030 Gembloux, Belgium. 2 Laboratoire d’Hydraulique et de Maîtrise
de l’Eau, Faculté des Sciences Agronomiques (FSA), Université d’Abomey-Calavi (UAC), BP 2819, Cotonou, Benin. 3 Laboratoire d’Aérologie, UMR CNRS
5560, Université Paul Sabatier, Toulouse, France. 4 Univ. Grenoble Alpes, LTHE,
38000 Grenoble, France. 5 CNRS LTHE, 38000 Grenoble, France. 6 IRD, LTHE,
38000 Grenoble, France.
(3)
EF = LE
LE + H
Acknowledgements
This study was funded by the “Association pour l’Agriculture et le Développe-ment Durable” (A2D), “Agence Belge de DéveloppeDéveloppe-ment” (CTB) and “Agence Universitaire de la Francophonie” (AUF). The first author is grateful to all members of the staff of Exchanges Ecosystems-Atmosphere axis, Department of Biosystem Enginieering (BIOSE), University of Liege Gembloux Agro Bio Tech (Belgium) and of “Laboratoire d’Hydraulique et de Maîtrise de l’Eau”, Faculté des Sciences Agronomiques (FSA), Université d’Abomey-Calavi (Bénin) for their various help; AMMA staff in Benin for supplying micrometeorological and eddy-covariance data; Dorothée Tchada for his editing assistance and Belar-main Fandohan, PhD for his support for the summary inventory of vegetation species. The authors warmly thank the reviewers for their relevant comments and suggestions.
Compliance with ethical guidelines Competing interests
The authors declare that they have no competing interests. Received: 16 June 2015 Accepted: 25 August 2015
References
1. Grace J, Mitchard E, Gloor E. Perturbations in the carbon budget of the tropics. Glob Change Biol. 2014;20:3238–55.
2. Bonan GB. Forests and climate change: forcings, feedbacks, and the climate benefits of forests. Science. 2008;320:1444–9.
3. Malhi Y, Baldocchi DD, Jarvis PG. The carbon balance of tropical, temper-ate and boreal forests. Plant Cell Environ. 1999;22:715–40.
4. IPCC (2013) Climate Change 2013: The Physical Science Basis. In: Stocker TF, Qin D, Plattner GK, Tigor M, Allen SK, Boschung J, Nauels A, Xia Y, Bex, V, Midgley PM editors. Working Group I Contribution to the Fifth Assess-ment Report of the IntergovernAssess-mental Panel on Climate Change. New York: Cambridge University Press; 2013. p. 1535.
5. Valentini R, Arneth A, Bombelli A, Castaldi S, Cazzolla Gatti R, Chevallier F, et al. A full greenhouse gases budget of Africa: synthesis, uncertainties, and vulnerabilities. Biogeosciences. 2014;11:381–407.
6. Henry M, Maniatis D, Gitz V, Huberman D, Valentini R. Implementation of REDD + in sub-Saharan Africa: state of knowledge, challenges and opportunities. Environ Dev Econ. 2011;16:381–404.
7. Bombelli A, Henry M, Castaldi S, Adu-Bredu S, Arneth A, de Grandcourt A, et al. An outlook on the Sub-Saharan Africa carbon balance. Biogeo-sciences. 2009;6:2193–205.
8. Sabine CL. The following resources related to this article are available online at. Science. 2004;1097403:305.
9. Sjöström M, Zhao M, Archibald S, Arneth A, Cappelaere B, Falk U, et al. Evaluation of MODIS gross primary productivity for Africa using eddy covariance data. Remote Sens Environ. 2013;131:275–86.
10. Jung M, Reichstein M, Margolis HA, Cescatti A, Richardson AD, Arain MA, et al. Global patterns of land-atmosphere fluxes of carbon dioxide, latent heat, and sensible heat derived from eddy covariance, satellite, and meteorological observations. J Geophys Res. 2011;116:1–16. 11. Walther GR. Community and ecosystem responses to recent climate
change. Philos Trans R Soc B Biol Sci. 2010;365:2019–24.
12. Nemani RR. Climate-Driven Increases in Global Terrestrial Net Primary Production from 1982 to 1999. Science. 2003;300:1560–3.
13. Houghton RA, House JI, Pongratz J, van der Werf GR, DeFries RS, Hansen MC, et al. Carbon emissions from land use and land-cover change. Bio-geosciences. 2012;9:5125–42.
14. Lewis SL. Tropical forests and the changing earth system. Philos Trans R Soc B Biol Sci. 2006;361:195–210.
15. Malhi Y, Roberts JT, Betts RA, Killeen TJ, Li W, Nobre CA. Climate change, deforestation, and the fate of the Amazon. Science. 2008;319:169–72. 16. Saleska SR, Didan K, Huete AR, da Rocha HR. Amazon forests green-up
during 2005 Drought. Science. 2007;318:612.
17. Sitch S, Friedlingstein P, Gruber N, Jones SD, Murray-Tortarolo G, Ahlström A, et al. Recent trends and drivers of regional sources and sinks of carbon dioxide. Biogeosciences. 2015;12:653–79.
18. Lewis SL, Sonke B, Sunderland T, Begne SK, Lopez-Gonzalez G, van der Heijden GMF, et al. Above-ground biomass and structure of 260 African tropical forests. Philos Trans R Soc B Biol Sci. 2013;368:20120295. 19. Fisher JB, Sikka M, Sitch S, Ciais P, Poulter B, Galbraith D, et al. African
tropi-cal rainforest net carbon dioxide fluxes in the twentieth century. Philos Trans R Soc B Biol Sci. 2013;368:20120376.
20. Ciais P, Bombelli A, Williams M, Piao SL, Chave J, Ryan CM, et al. The carbon balance of Africa: synthesis of recent research studies. Philos Trans R Soc Math Phys Eng Sci. 2011;369:2038–57.
21. Abdi AM, Seaquist J, Tenenbaum DE, Eklundh L, Ardö J. The supply and demand of net primary production in the Sahel. Environ Res Lett. 2014;9:094003.
22. Mamadou O. Etude des Flux d’Evapotranspiration en Climat Soudanien: comportement comparé de deux couverts végétaux au Bénin. Unversité d’Abomey-Calavi: Université de Grenoble; 2014.
23. Mulindabigwi von V: Influence des systèmes agraires sur l’utilisation des terroirs, la séquestration du carbone et la sécurité alimentaire dans le bas-sin de l’Ouémé supérieur au Bénin. Rheinischen Friedrich-Wilhelms; 2005. 24. Timouk F, Kergoat L, Mougin E, Lloyd CR, Ceschia E, Cohard J-M, et al.
Response of surface energy balance to water regime and vegetation development in a Sahelian landscape. J Hydrol. 2009;375:178–89. 25. Kabat P, Dolman AJ, Elbers JA. Evaporation, sensible heat and canopy
conductance of fallow savannah and patterned woodland in the Sahel. J Hydrol. 1997;188–189:494–515.
26. Culf AD, Allen SJ, Gash JHC, Lloyd CR, Wallace JS. Energy and water budg-ets of an area of patterned woodland in the Sahel. Agric For Meteorol. 1993;66:65–80.
27. Sokpon N, Biaou SH, Ouinsavi C, Hunhyet O. Bases techniques pour une gestion durable des forêts claires du Nord-Bénin: rotation, diamètre minimal d’exploitabilité et régénération. Bois For Trop. 2006;287:45–57. 28. Houéto G, Fandohan B, Ouédraogo A, Ago EE, Salako VK, Assogbadjo AE,
et al. Floristic and dendrometric analysis of woodlands in the Sudano-Guinean zone: a case study of Belléfoungou forest reserve in Benin. Acta Bot Gallica. 2013;159:387–94.
29. Judex M, Thamm H-P, Röhrig J, Schulz O. Impetus Atlas du Bénin, Résul-tats de recherche 2000–2007. Département de Géographie, Université de Bonn, Allemagne; 2009.
30. Mamadou O, Cohard JM, Galle S, Awanou CN, Diedhiou A, Kounouhewa B, et al. Energy fluxes and surface characteristics over a cultivated area in Benin: daily and seasonal dynamics. Hydrol Earth Syst Sci. 2014;18:893–914.
31. Nicholson SE. The West African Sahel: a review of recent studies on the rainfall regime and its interannual variability. ISRN Meteorol. 2013;2013:1–32.
32. Mallet M, Tulet P, Serça D, Solmon F, Dubovik O, Pelon J, et al. Impact of dust aerosols on the radiative budget, surface heat fluxes, heating rate profiles and convective activity over West Africa during March 2006. Atmos Chem Phys. 2009;9:7143–60.
33. Guyot A, Cohard J-M, Anquetin S, Galle S. Long-term observations of turbulent fluxes over heterogeneous vegetation using scintillometry and additional observations: a contribution to AMMA under Sudano-Sahelian climate. Agric For Meteorol. 2012;154–155:84–98.
34. Ozer P, Hountondji Y, Niang AJ, Karimoune S. Laminou Manzo O, Salmon M: Désertification au Sahel: historique et perspectives. Bull Société Géographique Liège. 2010;54:69–84.
35. Janicot S, Caniaux G, Chauvin F, de Coëtlogon G, Fontaine B, Hall N, et al. Intraseasonal variability of the West African monsoon. Atmos Sci Lett. 2011;12:58–66.
36. Lothon M, Saïd F, Lohou F, Campistron B. Observation of the Diur-nal Cycle in the Low Troposphere of West Africa. Mon Weather Rev. 2008;136:3477–500.
37. Ago EE, Agbossou EK, Galle S, Cohard J-M, Heinesch B, Aubinet M. Long term observations of carbon dioxide exchange over cultivated savanna under a Sudanian climate in Benin (West Africa). Agric For Meteorol. 2014;197:13–25. 38. Blanchard M, Peugeot C, Seghieri J. Structure et dynamique saisonnière de
la végétation sur quatre types de couvert végétal représentatifs de la dver-sité du bassin versant de la Donga. HydroSciences Montpellier, Direction Hydraulique, Institut de recherche pour le développement; 2007. p. 50. 39. Curiel Yuste J, Baldocchi DD, Gershenson A, Goldstein A, Misson L, Wong
S. Microbial soil respiration and its dependency on carbon inputs, soil temperature and moisture. Glob Change Biol. 2007;13:2018–35.
40. Davidson EA, Janssens IA, Luo Y. On the variability of respiration in terres-trial ecosystems: moving beyond Q10. Glob Change Biol. 2006;12:154–64. 41. Liu HS, Li LH, Han XG, Huang JH, Sun JX, Wang HY. Respiratory substrate
availability plays a crucial role in the response of soil respiration to envi-ronmental factors. Appl Soil Ecol. 2006;32:284–92.
42. Xu L, Baldocchi DD, Tang J. How soil moisture, rain pulses, and growth alter the response of ecosystem respiration to temperature: RAIN, GROWTH, AND RESPIRATION. Glob Biogeochem Cycles. 2004; 18:n/a–n/a. 43. Williams CA, Hanan N, Scholes RJ, Kutsch W. Complexity in water and car-bon dioxide fluxes following rain pulses in an African savanna. Oecologia. 2009;161:469–80.
44. Williams CA, Albertson JD. Soil moisture controls on canopy-scale water and carbon fluxes in an African savanna: Soil moisture controls on fluxes. Water Resour Res. 2004; 40:n/a–n/a.
45. Loescher HW, Oberbauer SF, Gholz HL, Clark DB. Environmental controls on net ecosystem-level carbon exchange and productivity in a Central American tropical wet forest. Glob Change Biol. 2003;9:396–412. 46. Quansah E, Mauder M, Balogun AA, Amekudzi LK, Hingerl L, Bliefernicht J,
et al. Carbon dioxide fluxes from contrasting ecosystems in the Sudanian Savanna in West Africa. Carbon Balance Manag. 2015;10:1–17.
47. Merbold L, Ardö J, Arneth A, Scholes RJ, Nouvellon Y, De Grandcourt A, et al. Precipitation as driver of carbon fluxes in 11 African ecosystems. Biogeosciences. 2009;6:1027–41.
48. Brümmer C, Falk U, Papen H, Szarzynski J, Wassmann R, Brüggemann N. Diurnal, seasonal, and interannual variation in carbon dioxide and energy exchange in shrub savanna in Burkina Faso (West Africa). J Geophys Res. 2008;113:1–11.
49. Hanan NP, Kabat P, Dolman AJ, Elbers JA. Photosynthesis and carbon balance of a Sahelian fallow savanna. Glob Change Biol. 1998;4:523–38.
50. Friborg T, Boegh E, Soegaard H. Carbon dioxide flux, transpiration and light response of millet in the Sahel. J Hydrol. 1997;188–189:633–50. 51. Kutsch WL, Hanan N, Scholes RJ, McHugh I, Kubheka W, Eckhardt H, et al.
Response of carbon fluxes to water relations in a savanna ecosystem in South Africa. Biogeosci Discuss. 2008;5:2197–235.
52. Aubinet M, Vesala T, Papale D, editors. Eddy Covariance: A Pratical Guide to Measurement and Data Analysis. Dordrecht: Springer; 2012. 53. Tagesson T, Fensholt R, Guiro I, Rasmussen MO, Huber S, Mbow C, et al.
Ecosystem properties of semiarid savanna grassland in West Africa and its relationship with environmental variability. Glob Change Biol. 2015;21:250–64.
54. Yang B, Pallardy SG, Meyers TP, Gu L-H, Hanson PJ, Wullschleger SD, et al. Environmental controls on water use efficiency during severe drought in an Ozark Forest in Missouri, USA. Glob Change Biol. 2010;16:2252–71. 55. Boulain N, Cappelaere B, Ramier D, Issoufou HBA, Halilou O, Seghieri
J, et al. Towards an understanding of coupled physical and biological processes in the cultivated Sahel—2. Vegetation and carbon dynamics. J Hydrol. 2009;375:190–203.
56. Moncrieff JB, Monteny B, Verhoef A, Friborg T, Elbers J, Kabat P, et al. Spatial and temporal variations in net carbon flux during HAPEX-Sahel. J Hydrol. 1997;188–189:563–588. [HAPEX-Sahel].
57. Verhoef A, Allen SJ, De Bruin HAR, Jacobs CMJ, Heusinkveld BG. Fluxes of carbon dioxide and water vapour from a Sahelian savanna. Agric For Meteorol. 1996;80:231–48.
58. Scanlon TM, Albertson JD. Canopy scale measurements of CO2 and water
vapor exchange along a precipitation gradient in southern Africa. Glob Change Biol. 2004;10:329–41.
59. Williams CA, Albertson JD: Contrasting short- and long-timescale effects of vegetation dynamics on water and carbon fluxes in water-limited ecosystems: vegetation controls on dryland fluxes. Water Resour Res. 2005;41:n/a–n/a.
60. Ramier D, Boulain N, Cappelaere B, Timouk F, Rabanit M, Lloyd CR, et al. Towards an understanding of coupled physical and biological processes in the cultivated Sahel—1. Energy and water. J Hydrol. 2009;375:204–16. 61. Ardö J, Molder M, El-Tahir BA, Elkhidir HAM. Seasonal variation of carbon fluxes in a sparse savanna in semi arid Sudan. Carbon Balance Manag. 2008;3:7.
62. Bagayoko F, Yonkeu S, Elbers J, van de Giesen N. Energy partitioning over the West African savanna: multi-year evaporation and sur-face conductance measurements in Eastern Burkina Faso. J Hydrol. 2007;334:545–59.
63. Lhomme J-P, Elguero E. Examination of evaporative fraction diurnal behaviour using a soil-vegetation model coupled with a mixed-layer model. Hydrol Earth Syst Sci. 1999;3:259–70.
64. Gentine P, Entekhabi D, Polcher J. The Diurnal Behavior of evaporative fraction in the soil–vegetation–atmospheric Boundary Layer Continuum. J Hydrometeorol. 2011;12:1530–46.
65. Gentine P, Entekhabi D, Chehbouni A, Boulet G, Duchemin B. Analy-sis of evaporative fraction diurnal behaviour. Agric For Meteorol. 2007;143:13–29.
66. Farah HO, Bastiaanssen WGM, Feddes RA. Evaluation of the temporal vari-ability of the evaporative fraction in a tropical watershed. Int J Appl Earth Obs Geoinf. 2004;5:129–40.
67. Jenerette GD, Scott RL, Huxman TE. Whole ecosystem metabolic pulses following precipitation events. Funct Ecol. 2008;22:924–30.
68. Xu L, Baldocchi DD. Seasonal variation in carbon dioxide exchange over a Mediterranean annual grassland in California. Agric For Meteorol. 2004;123:79–96.
69. Chen S, Lin G, Huang J, Jenerette GD. Dependence of carbon seques-tration on the differential responses of ecosystem photosynthesis and respiration to rain pulses in a semiarid steppe. Glob Change Biol. 2009;15:2450–61.
70. Veenendaal EM, Kolle O, Lloyd J. Seasonal variation in energy fluxes and carbon dioxide exchange for a broad-leaved semi-arid savanna (Mopane woodland) in Southern Africa. Glob Change Biol. 2004;10:318–28. 71. Archibald SA, Kirton A, Van der Merwe MR, Scholes RJ, Williams CA, Hanan
N. Drivers of inter-annual variability in Net ecosystem exchange in a semi-arid savanna ecosystem, South Africa. Biogeosciences. 2009;6:251–66. 72. Saunders MJ, Kansiime F, Jones MB. Agricultural encroachment:
implica-tions for carbon sequestration in tropical African wetlands. Glob Change Biol. 2012;18:1312–21.
73. Delon C, Galy-Lacaux C, Adon M, Liousse C, Serça D, Diop B, Akpo A. Nitrogen compounds emission and deposition in West African eco-systems: comparison between wet and dry savanna. Biogeosciences. 2012;9:385–402.
74. Saxton JE, Lewis AC, Kettlewell JH, Ozel MZ, Gogus F, Boni Y, et al. Isoprene and monoterpene measurements in a secondary forest in northern Benin. Atmos Chem Phys. 2007;7:4095–106.
75. Youssouf I, Lawani M. Les sols béninois: classification dans la base de référence mondiale. 2000.
76. Padonou EA, Assogbadjo AE, Bachmann Y, Sinsin B. How far bowalization affects phytodiversity, life forms and plant morphology in Sub-humid tropic in West Africa. Afr J Ecol. 2012;51:255–62.
77. Giertz S, Junge B, Diekkrüger B. Assessing the effects of land use change on soil physical properties and hydrological processes in the sub-humid tropical environment of West Africa. Phys Chem Earth Parts ABC. 2005;30:485–96.
78. Kaptue Tchuente AT, Roujean J-L, Faroux S. ECOCLIMAP-II: An ecosystem classification and land surface parameters database of Western Africa at 1 km resolution for the African Monsoon Multidisciplinary Analysis (AMMA) project. Remote Sens Environ. 2010;114:961–76.
79. Mayaux P, Massart M, Belward AS. European Commission, Joint Research Centre: A Land Cover Map of Africa = Carte de L’occupation Du Sol de l’Afrique. Luxembourg: EUR-OP; 2003.
80. Aubinet M, Chermanne B, Vandenhaute M, Longdoz B, Yernaux M, Laitat E. Long term carbon dioxide exchange above a mixed forest in the Belgian Ardennes. Agric For Meteorol. 2001;108:293–315.
81. Moureaux C, Debacq A, Bodson B, Heinesch B, Aubinet M. Annual net ecosystem carbon exchange by a sugar beet crop. Agric For Meteorol. 2006;139:25–39.
82. Kolle O, Rebmann C. EDDYSOFT by meteotools: Documentation of Eddy Covariance Software. 2009.
83. Foken T, Wichura B. Tools for quality assessment of surface-based flux measurements. Agric For Meteorol. 1996;78:83–105.
84. Wohlfahrt G, Anfang C, Bahn M, Haslwanter A, Newesely C, Schmitt M, et al. Quantifying nighttime ecosystem respiration of a meadow using eddy covariance, chambers and modelling. Agric For Meteorol. 2005;128:141–62.
85. Falge E, Baldocchi D, Olson R, Anthoni P, Aubinet M, Bernhofer C, et al. Gap filling strategies for defensible annual sums of net ecosystem exchange. Agric For Meteorol. 2001;107:43–69.
86. Seghieri J, Vescovo A, Padel K, Soubie R, Arjounin M, Boulain N, et al. Rela-tionships between climate, soil moisture and phenology of the woody cover in two sites located along the West African latitudinal gradient. J Hydrol. 2009;375:78–89.
87. Gilmanov TG, Wylie BK, Tieszen LL, Meyers TP, Baron VS, Bernacchi CJ, et al. CO2 uptake and ecophysiological parameters of the grain crops of midcontinent North America: Estimates from flux tower measurements. Agric Ecosyst Environ. 2013;164:162–75.
88. Gilmanov TG, Soussana JF, Aires L, Allard V, Ammann C, Balzarolo M, et al. Partitioning European grassland net ecosystem CO2 exchange into gross primary productivity and ecosystem respiration using light response function analysis. Agric Ecosyst Environ. 2007;121:93–120.
89. Stoy PC, Katul GG, Siqueira MBS, Juang J-Y, Novick KA, Uebelherr JM, et al. An evaluation of models for partitioning eddy covariance-measured net ecosystem exchange into photosynthesis and respiration. Agric For Meteorol. 2006;141:2–18.
90. Wohlfahrt G, Bahn M, Haslwanter A, Newesely C, Cernusca A. Estimation of daytime ecosystem respiration to determine gross primary production of a mountain meadow. Agric For Meteorol. 2005;130:13–25.
91. Lasslop G, Reichstein M, Papale D, Richardson AD, Arneth A, Barr A, et al. Separation of net ecosystem exchange into assimilation and respira-tion using a light response curve approach: critical issues and global evaluation: separation of nee into GPP and Reco. Glob Change Biol. 2010;16:187–208.
92. Falge E, Baldocchi D, Tenhunen J, Aubinet M, Bakwin P, Berbigier P, et al. Seasonality of ecosystem respiration and gross primary produc-tion as derived from FLUXNET measurements. Agric For Meteorol. 2002;113:53–74.
93. Aubinet M, Heinesch B, Longdoz B. Estimation of the carbon sequestra-tion by a heterogeneous forest: Night flux correcsequestra-tions, heterogeneity of the site and inter-annual variability. Glob Change Biol. 2002;8:1053–71. 94. Richardson AD, Hollinger DY. A method to estimate the additional
uncer-tainty in gap-filled NEE resulting from long gaps in the CO2 flux record. Agric For Meteorol. 2007;147:199–208.
95. Neftel A, Spirig C, Ammann C. Application and test of a simple tool for operational footprint evaluations. Environ Pollut. 2008;152:644–52. 96. Kormann R, Meixner FX. An analytical footprint model for non-neutral
stratification. Bound Layer Meteorol. 2001;99:207–24.
97. Keenan TF, Hollinger DY, Bohrer G, Dragoni D, Munger JW, Schmid HP, et al. Increase in forest water-use efficiency as atmospheric carbon diox-ide concentrations rise. Nature. 2013;499:324–7.
98. Baldocchi DD, Verma SB, Rosenberg NJ. Water use efficiency in a soybean field: influence of plant water stress. Agric For Meteorol. 1985;34:53–65.