Transport of dissolved Si from soil to river: a conceptual mechanistic model
35
0
0
Texte intégral
(2) 37 . 1. Introduction. 38 . In aquatic systems, dissolved Si (DSi) is an important nutrient. Dissolved Si is mainly delivered to. 39 . the oceans by river discharge: rivers provide more than 80% of the total input of dissolved silicon. 40 . (DSi) into the oceans [136], the rest being provided by aeolian dust input and ocean floor. 41 . weathering. Given the relatively low residence time of DSi in the ocean reservoir (ca. 400 yrs,. 42 . [136]) , the delivery of riverine to the oceans is critical for maintaining primary productivity in the. 43 . world oceans and plays a crucial role in the biological uptake of CO2 through the so-called. 44 . biological carbon pump [76].. 45 . Land-river Si fluxes depend on the relative contribution of different Si sources and on the type of. 46 . processes (e.g. biological, physico-chemical, pedological) occurring along the pathway [125 32].. 47 . The particulate Si fraction in soils and bedrock consists of well-crystallized minerals (e.g. quartz,. 48 . other primary and secondary silicates) and amorphous Si (ASi) [119, 32]. ASi can be subdivided. 49 . in biogenic silica (i.e. plant Si bodies called phytoliths) and non-crystalline inorganic Si fractions. 50 . (i.e. formed by pedogenic processes). In most ecosystems the biogenic constituent is the most. 51 . abundant. These ASi fractions are important for Si delivery: (i) they can be up to 17 times more. 52 . soluble than quartz [54] and their dissolution may therefore constitute the most important source of. 53 . DSi delivered to rivers by groundwater and/or surface and subsurface runoff [62] and (ii) ASi may. 54 . be directly delivered to aquatic systems by physical erosion during erosion events [124, 22].. 55 . Thus, DSi concentrations in rivers will to a large extent be controlled by DSi concentrations in. 56 . soil pore water. DSi concentrations in soil water will have an important effect on DSi. 57 . concentrations in and DSi delivery to rivers: several studies have shown during large runoff events. 58 . often consists for a large part of soil pore water that is pushed out of the soil system by the new. 59 . precipitation Understanding the mechanisms controlling DSi dynamics within soils is therefore. 60 . key to understanding spatial and temporal varitiations in river water and , hence, in Si delivery to. 61 . the ocean.. 62 63 . A wide range of processes other than dissolution control soil pore water DSi concentrations:. 64 . adsorption on Fe-and Al-oxides, polymerization, formation of nanocolloïds, precipitation of. 65 . secondary minerals and uptake by vegetation [41, 137, 32,98, 2778] which complexes the. 66 . comprehension of land-river Si transfer. These processes are described separately by physically. 67 . based equations but models combining all processes do not yet exist. Such a model shoud not. 68 . only consider soil processes but should account for the effects of vegetation as vegetation. 69 . profoundly affects the intensity of the biogeochemical Si cycling [7, 2, 13, 30]. The latter implies. 70 . that land use may strongly affect DSi delivery, as land use changes will not only affect vegetation. 71 . but also soil hydrology and soil chemistry. . Finally, at the landcape scale, geomorphological and. 72 . hydrogeological features as these control which ASi and DSi reservoirs contribute to Si delivery at. 73 . what time. Indeed, the contributions of various reservoirs will not be constant through time but. 74 . will vary depending on hydrological conditions (moisture status) as well as vegetation dynamics.. 75 . Si pools and fluxes in landscapes have previously been discussed in the review of Sommer et al.. 76 . [125]. Street-Perrott and Barker [126] emphasized the importance of coupling the the Si and C. 2.
(3) 77 . cycles, while Cornelis et al. [32] focused their review on the impact of the soil-plant system on. 78 . DSi in weathering-limited and weathering-unlimited environments. While these reviews provide a. 79 . good overview of the state of the art of our knowledge with respect to Si cycling, they do not. 80 . discusss how this knowledge can be integrated in a mechanistic modeling framework that might be. 81 . used to quantitatively predict (changes in) DSi concentrations and fluxes in soils and DSi delivery. 82 . from soils to rivers. Other catchment studies developed empirical equations to calculate the DSi. 83 . concentrations in groundwater and soil pore water based on measurements [122, 62]. These are,. 84 . however, site specific, non-transferable equations.. 85 . . 86 . In this review, the DSi delivery at soil profile scale from a typical podzol soil to the river ise. 87 . analysed. In contrast to earlier work, we establish a framework of mechanistic equations that may. 88 . be used to model DSi transport. An overview is given of all equations describing dissolution,. 89 . adsorption and uptake of Si by plants. We propose these equations to predict expected variations. 90 . of Si concentrations within soil profiles and discuss which further steps are needed to develop a. 91 . fully operational model of DSi production and delivery under different land uses. Finally, we. 92 . discuss how the different processes are affected by land-use and seasonal variations in vegetation. 93 . for catchments with comparable climate, lithology but covered by grassland, cropland or forest.. 94 95 . . 96 . . 97 . . 98 . 2. Sources and sinks of Si in soils. 99 . 2.1.. Typology of Si-particles. 100 . Silica is the second most abundant element in the earth crust and is present in different forms. In. 101 . soils, mineral Si (MSi) is dominant but amorphous Si (BSi) is also present in significant amounts. 102 . [126] (Figure 1). Mineral silicates can be subdivided in different categories: the primary minerals. 103 . formed by magmatic crystallization (quartz, feldspars,…) and the secondary minerals developed. 104 . during soil formation. The secondary phases, concentrated in the clay fraction of soils, can be well. 105 . crystallized like phyllosilicates [73] , micro-crystalline (autigenic quartz, Opal CT, chalcedon) or. 106 . short-range ordered (imogolite, proto-imogolite, allophane) [45, 144, 94]. Amorphous forms of. 107 . mineral Si are non-crystalline inorganic particles forming opal-A or volcanic glasses. Amorphous. 108 . coatings of opal can also cover secondary minerals [98, 19]. Amorphous Si can be of biogenic. 109 . origin. In this biogenic Si pool, the phytogenic Si (including phytoliths) is the most important. 110 . component. Phytoliths are formed by plants who take up DSi from the soil solution , which then. 111 . precipitates as phytoliths in plant roots, stems and leaves/needles. When dead plant material is. 112 . decomposed, the phytoliths are released to the topsoil. Phytoliths are not the only important form. 113 . of ASi in soils: sponge spicules, diatoms and testate amoebae are also important components of. 3.
(4) 114 . biogenic Si ([119, 125], especially in wetlands [128] and forests[4]. A classification of all types of. 115 . Si-particles is presented in Fig. 1.. 116 . Although atmospheric inputs are low in comparison to other Si fluxes in the soil-plant system they. 117 . deserve special attention because they are a net source of DSi for the soil-plant system. Aeolian. 118 . erosion can collect Si-rich dust from soils and potentially transport it to other continental regions. 119 . or the ocean. As wind forces are very variable regionally and the mineralogical composition of. 120 . aeolian dust is dependent on the soil of origin, the process is difficult to quantify at larger scales.. 121 . Atmospheric inputs from aeolian deposition have been estimated to range from 0.04 to 2 kg Si ha-1. 122 . year-1 for temperate and tropical forests in non-volcanic areas [126]. The spread of volcanic ashes. 123 . containing ASi in the form of volcanic glass is generally limited to volcanic regions only, but. 124 . occasionally volcanic dust is dispersed over large areas, depending on the type and magnitude of. 125 . the eruption as wells as on the meteorological conditions at the moment of eruption. ASi input by. 126 . rainfall is of the same order of magnitude than that by dust deposition: the maximum value found. 127 . is 3±2 kg Si ha-1 yr-1 [32].. 128 . . 2.2.. 129 . Si dissolution and weathering. 130 131 . The dissolution of silicates and amorphous Si generally forms monosilicic acid (H4SiO4; DSi):. 132 2. 133 134 135 136 . ⇆. SiO. (1). Dissolution can also lead to the formation of polysilicic acid but its stability is relatively low. Depending on pH, temperature and composition of natural waters, depolymerisation of polysilicic acid takes place in a few hours or days[40]. . 137 138 . In contrast to quartz, which is highly ordered, amorphous silica is a short-range order crystal. 139 . composed of loosely packed silica tetrahedrals. Consequently, the solubility of amorphous silica. 140 . is much higher (1.8-2mM Si under laboratory conditions) than that of quartz (0.10-0.25mM Si). . 141 . It is often assumed that the Si concentration in natural waters is mainly controlled by mineral. 142 . silicate hydrolysis (Equation 1): 45% of the dissolved load in rivers is attributed to mineral (?) Si. 143 . weathering. [130]. [57, 93, 106115]. The mass-balance for a specific element in an aequous. 144 . solution resulting from dissolution of mineral phases can be calculated as follows for for j. 145 . reactants and p product phases:.. 146 . ∑. 147 . Where MTC is the mass-transfer coefficient for any phase (p) in moles, α the stoichiometric. 148 . coefficient of element i in phase p, m the total moles of element i in the initial and final. 149 . solutions [5, 16]. However, the composition of natural waters is not only dependent on mineral. ∆. (2). 4.
(5) 150 . composition: dissolution is also influenced by temperature, reactive surface and pH. Si solubility is. 151 . relatively constant between pH 2 and 8.5 but increases drastically when pH>9 or pH < 2 (?). Bases. 152 . dissolve ASi, imogolite and allophone while acidic conditions enhance the desorption of adsorbed. 153 . Si [119]. Gérard et al. [62] take account of the temperature dependency of the Arrhenius equation. 154 . (Equation 4) as well as pH when calculating the dissolution rate constant for silicate minerals as. 155 . follows:. 156 . /. 1. (3). 157 . with. (4). 158 . in which rd is the dissolution rate (mol kg-1 s-1), kd is the dissolution rate constant (mol m-2 s-1), S is. 159 . the reactive surface of the mineral (m2kgH2O-1), {H+} is the activity of protons in the reacting. 160 . solution, n is an experimental exponent and Q is the ionic activity product of the reaction. The. 161 . temperature dependence of kd is described by /. 162 . (5). 163 . in which. is kd at a given reference temperature, Ea is the apparent activation energy of the. 164 . dissolution reaction (kJ mol-1), R is the gas constant (8.32x10⁻³ kJ mol-1 K-1) and T is the. 165 . temperature (K).. 166 . The equations above describe the mineral dissolution in deionized water: however, the presence of. 167 . electrolytes can increase dissolution rates. Water dipoles attack more easily and efficiently mineral. 168 . surfaces on which cations are adsorbed. To correct for this, the Langmuir adsorption model can be. 169 . integrated [44] in eq. 4: 1. 170 . (6). 171 . with. 172 . Where. 173 . and. 174 . account for adsorbed protons on remaining sites as adsorption is a competitive process[66].. 175 . A further complicatioln is that water acidification by CO2 production (. 176 . organic acids (. 177 . (7) is the fraction of sites occupied by cation A,. the molal concentration of the cation. the equilibrium adsorption coefficient of the cation. The last term of eq. 6 allows to. ) and the presence of. ) also need to be accounted for: [131, 132]:. .. .. (8). 178 . Where rj is the dissolution rate of mineral j, ki is the rate coefficient, M the base cations (Ca2+,. 179 . Mg2+, Na+ and K+), n ,x , y, u and m apparent reaction orders to be determined experimentally.. 180 . Similar to eq. 3, the first term of the equation accounts for the effect of pH and solution. 181 . composition, but adding this time the effect of Al3+. This term stands for formation and. 182 . decomposition of activated surface complexes. The concentrations of base cations and Al are pH-. 5.
(6) 183 . dependent: in acid water the base cations on the exchange complex are replaced by H3O+. and. 184 . Al(OH)3 dissolution is enhanced. After the replacement of exchange complexes by H3O+, an. 185 . alkali-depleted layer enriched in Si and /or Al forms around the mineral. This residual layer will. 186 . dissolve slowly. Al therefore has a complex role in the dissolution of minerals as its concentration. 187 . is not only pH-dependent (like showed in the first term) but also interacts in the residual layer: t. 188 . his interaction is accounted for in the third term of eq. 8. The last two terms calculates the rate. 189 . contribution due to the described acidification factors[5].The presence of CO2 accelerates the. 190 . dissolution by providing protons . Berg and Banwart [X] suggest that at neutral to near basic pH. 191 . weathering will be enhanced by the reactive carbonate complexes sorbed on mineral surfaces.. 192 . Drever and Stillings [46] discussed the effect of organic acids on dissolution rates. Their presence. 193 . can significantly increase dissolution rates drive dissolution rates far from equilibrium by. 194 . lowering the pH but this process seems only to be significant below pH 5. Pokrovski and Schott. 195 . [112] observed that aqueous Si and organic ligands did not easily form complexes. This. 196 . observation implies that the adsorption of organic ligands is rather limited to quartz. Drever and. 197 . Stillings [46] suggest that organic acids influence the silicate weathering indirectly as secondary. 198 . iron and aluminium hydroxides dissolve first. In aluminosilicates the Al-O bounds will break more. 199 . rapidly than the stronger Si-O bounds [108,109, 59,37- 39, 103]. The resulting higher permeability. 200 . induces an accelerated transport thereby increasing weathering.. 201 202 . In the equations above water availability is assumed to be non-limiting. However dissolution and. 203 . hydrolysis are are only possible by contact between water and minerals. It is therefore logical to. 204 . assume that the total weathering amount (?) (Rw) within a soil profile is proportional to the soil. 205 . water content (θ) as well as the time (t) of the weathering processes [5]. As the soil composition. 206 . and water content vary from one horizon to another, the total weathering rate has to be calculated. 207 . for each horizon and finally summed for the whole soil column. ∑. 208 . ∑. .. (9). 209 . It is generally assumed that the weathering processes of silicates are accelerated in the vadose. 210 . zone, especially in the root zone where biological activity is more important [3, 134]. This is. 211 . mainly due to… However, silicate weathering is also known to increase with increasing. 212 . concentrations of the acids H2CO3 and H2SO4 [87, 83]. These acids are produced in the saturated. 213 . zone by mineralization processes of organic compounds and sulfides oxidation respectively [83].. 214 . The effect of H2CO3 is the same process as observed by Berg and Banwart [X] and is is accounted. 215 . for in equation 8 by the third term. However, the of H2SO4 on Si weathering has hitherto never. 216 . been formulated in a similar equation.. 217 218 . 219 . The combination of existing knowledge, as presented above, allows us to propose a new set of. 220 . equations to approximate the amount of Si dissolved in soil from a diverse range of sources:. 221 . 6.
(7) 222 223 . ∑. θ∑. ∑. (10). 224 225 . (11) /. 1. 226 . .. .. SO. k. . (12). 227 228 229 . With. ∑σ k +. 2+. 1 2+. +. ∑σ. (13). 3+. 230 . Where A = Na , Ca , Mg , K and Al . Knowing the fraction of each soil component in the soil. 231 . (α in %), a weighted rate. 232 . a whole soil profile. These deterministic equations can be used to calculate the weathering and. 233 . mobilization potential of DSi to soil water as they are based on known processes affecting the Si. 234 . dissolution rate. Using deterministic equations is a precise but time-consuming approach since a. 235 . lot of parameters need to be known (e.g. precise soil and water compositions, precise data base of. 236 . can be calculated for each soil horizon j. The. is the rate for. ). . 237 238 239 is different for each source type,. 240 . . As. 241 . in other words for each mineral.. has to be calculated for each Si soil component i (. ),. 242 243 . Current approaches modeling DSi dynamics generally ignore the biogenic and pedogenic Si pools. 244 . as potential DSi sources and/or DSi sinks. This strongly contrasts with available field evidence:. 245 . BSi was found to be the principal DSi source in leaching water and stream water in different areas. 246 . [52, 64]. The few studies that have been realized on the reactivity of BSi show complex. 247 . dissolution rates. Saccone et al.[118] tested different Si extraction techniques and concluded that. 248 . phytoliths dissolve more easily in alkaline solutions while adsorbed and mineral Si were. 249 . extractable with acid solutions. The substitution of Si by Al at the surface of BSi particles lowers it. 250 . reactivity [138]. Loucaides et al. [89] showed a positive correlation between deprotonated silanol. 251 . (SiO-) groups, which are present at at the outer surface of phytoliths at pH higher than 2.5‐3 and. 252 . dissolution rates. Given the importance of these processes and and the variable composition. 253 . of the BSi soil pool (phytoliths of different plant species, testae, spicules,…), it can be assumed. 254 . that there is a large range of BSi reactivities [129]. Future research should investigate if BSi. 255 . dissolution is influenced by similar parameters so that eq. 10 may be possibly extended to include. 256 . BSi dissolution and reprecipitation of this Si as ASi.. 257 258 . 7.
(8) 259 . Sinks of DSi . 2.3.. 260 . Si is not only released in the water of natural systems but it can also: (1) be adsorbed to soil. 261 . components; (2) form nanocolloïds by polymerization; (3) take part in neoformation and. 262 . precipitation as secondary minerals; and (4) actively be precipitated in vegetation as phytoliths.. 263 . (1) Monosilicic acid (H4SiO4) sorbs on solid phases, mainly on Fe- and Al-oxides and hydroxides.. 264 . The amount of adsorbed Si increases when pH increases from 4 to 9 [9, 98, 40] and can be. 265 . quantified with a charge distribution model[70]. Thermodynamically the adsorption can be. 266 . calculated as:. 267 . Γ Γ. Γ. ≡. (14). 268 . in which. 269 . and the change of pH at a constant silicate loading, Γ ;. 270 . adsorption over the change of the silicate adsorption; nH is the proton balance in the solution and. Γ. is the ratio between the change of the total concentration of DSi (CSi-tot) Γ Γ. is the ratio of change of the proton. 271 . is the proton co-adsorption ratio. Equation 14 implies that the concentration change is equal to. 272 . the change in H+ adsorption (Γ ) as result of the adsorption of Si at the surface (Γ ) at a given. 273 . constant pH after correction for the mean relative number (nH) of protons present on the species in. 274 . solution at that pH. The nH and Γ are calculated for the chosen reference species of DSi,. 275 . H4SiO40. This is the most common species at pH below 9, which means nH = 0 when the pH <f 9.. 276 . If H3SiO4−1 is the only Si species present in significant concentration at pH>9 values nH will be. 277 . equal to −1 [71, 114].. 278 (2) Monosilicic acid (H4SiO4(mono)) forms critical nuclei that rapidly develop into nanocolloids 279 . (H4SiO4(nano)) by oligomerization. Polymerisation of these oligomers takes place in acidic and. 280 . neutral environments (2<pH<7). Monosilicic acids are negatively charged at higher alkalinity. 281 . values. Electrostatic forces then prevent polymerization except when the presence of metal cations. 282 . allows to neutralize the monomers. If the nanocolloids aggregate or are submitted to processes like. 283 . coalescence, SiO2 precipitates [116, 74, 95, 75] and forms ASi particles. Thus, the relative. 284 . amounts of the different types of Si depend on the environmental conditions. In natural. 285 . environments, up to 65% of total aqueous silica can be composed of nanocolloïdal silica [27].. 286 . High amounts of nanocolloïdal silica are present in environments with low pH (3-4) and at. 287 . neutral pH in combination with a low ionic strength. In acidic environments the concentration of. 288 . monomeric Si is in equilibrium with the concentration of nanocolloïdal Si. Si precipitation is. 289 . rather limited in these conditions in contrast to environments with neutral pH [27]. To simulate the. 290 . concentrations of monomeric (. 291 . supersaturation model (equations 15 and 16) was proposed by Conrad et al. [27]:. and nanocolloïdal SiO2 (. a. /. 292 . 3. (15). 8.
(9) 293 . And: /. 3. 294 (16). 295 296 . With. 297 . rate constant for the formation of critical nuclei,. 298 . order with respect to. 299 . (3) Processes of pedogenic formation of secondary minerals (phyllosilicates, silica and short-range. 300 . ordered aluminosilicates) depend on DSi concentrations in the soil pore water. High Al. 301 . disponibility favorises clay formation [91]: under these conditions, Short-range ordered Al-Si. 302 . compounds (hydroxyaluminosilicates, HAS) are formed in soils with pH >5 [144]. HAS are, an. 303 . amorphous precursor of imogolite [50, 41]. In presence of active organic matter, the formation of. 304 . allophane and imogolite is suppressed as Al preferentially forms complexes with organic matter in. 305 . those conditions. As a consequence, opaline silica precipitates (Huang, 1991). It should be kept in. 306 . mind that for the precipitation of each secondary mineral, specific equilibrium conditions need to. 307 . be reached.. 308 . (4) Plants take up DSi from soil solution especially during the growing season, which can result in. 309 . a decrease of DSi concentrations during spring and summer [56]. This uptake can be higher (active. 310 . uptake) than,r proportional to (passive uptake) or lower than (active exclusion) the predicted. 311 . uptake by water mass transfer. Lower uptake leads to H4SiO4 accumulation in the soil. Cornelis et. 312 . al. [32] reviewed the literature on Si accumulation in plants and showed that both the main source. 313 . and sink for DSi in soil solutions are phytoliths. Farmer et al.[52] showed that the dissolution of. 314 . phytoliths stored in soil were the main contributor to DSi in the river water during winter rains and. 315 . spring snowmelt [52]. However, while there is ample evidence showing that the plant reservoir is. 316 . important, very little quantitative information is at present available with respect to the relative. 317 . contribution of biogenic and mineral Si to DSi in soil water for natural and cultural ecosystems.. 318 . Gérard et al. [63] emphasized this will depend on site-specific conditions.. 319 . To calculate the active uptake of Si the Michaëlis-Menten (Monod) rate (equation 17) can be used:. 320 . the equilibrium concentration of precipitated amorphous SiO2,. is the reaction. is the rate of precipitation and m is the reaction. .. (17). 321 . where ra is the active uptake of Si (mol L-1s-1), kM is the kinetic constant (mol L-1s-1) and KM is the. 322 . half saturation constant (mol L-1). This equation is commonly simplified to a first order rate. 323 . equation (equation 18) by attributing a a very high value to KM.. 324 . For passive uptake ra is equal to:. 325 . (18). 9.
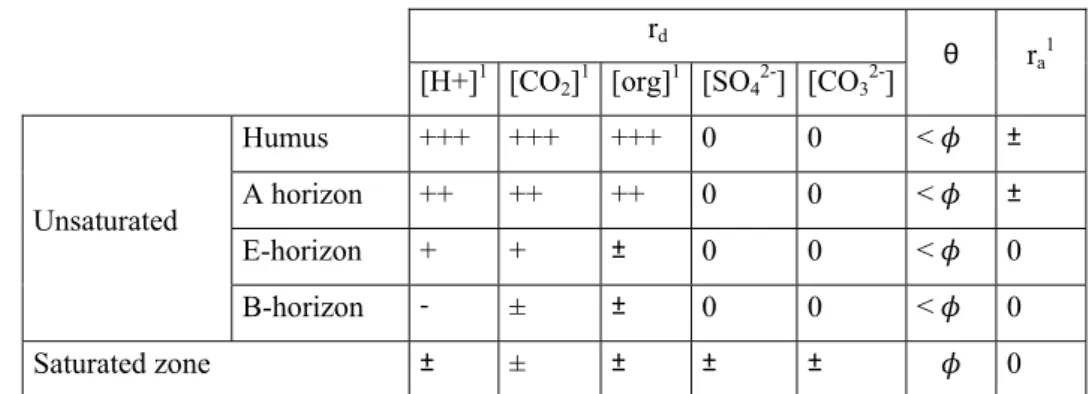
(10) 326 . Which results in a very small value of kM.. 327 . Active uptake will lower the Si concentration in soil pore water and the DSi concentration in. 328 . receiving rivers may therefore be expected to decrease during periods of active DSi uptake by. 329 . terrestrial vegetation.. 2.4.. 330 . Towards an integrated model. 331 332 . [Fig. 1 about here]. 333 . Only a few attempts have been made to simulate the net effect of both sinks and sources on. 334 . the final DSi concentration in the soil solution and such studies were only carried out for. 335 . forested environments. Gérard et al. [63] proposed a conceptual model and simulated it using. 336 . the MIN3P code in which active and passive uptake of Si were integrated. Active uptake was . 337 . assumed to be important, as there was no evidence for another Si sink. . 338 . We propose to estimate the Si concentration by coupling all known equations expressing Si. 339 . dissolution and sink processes (Fig. 2). Firstly, mineral dissolution in a specific soil horizon is. 340 . calculated by obtaining rd from equation 10, which is subsequently by the bulk density ( ), the. 341 . porosity ( ) and the soil moisture (θ) of the soil horizon under consideration. In the case of active. 342 . uptake, the uptake by vegetation (described by ra) has to be accounted for in the root zone using. 343 . eq. ??.The obtained value (rnet in mol L-1 s-1) is then multiplied by the duration of a time step (t in. 344 . s) to obtain the gross increase in DSi concentration, after which losses due to the. 345 . adsorption/precipitation of Si are estimated using eq. ???. The final Si concentration obtained is. 346 . the total of the monomeric and nanocolloidal SiO2. Estimating the relative importance of both. 347 . fraction requires that the monomeric SiO2 is measured, e.g. with the molybdenum blue method. 348 . [73]. Clearly, this Si model needs to be coupled with a water flux model. This is not only. 349 . necessary to estimate active uptake but also to simulate Si fluxes between different soil horizons.. 350 . [Fig. 2 about here]. 351 . 352 . Fig. 3 is a schematic representation of a podzol soil system to which our model was applied,. 353 . whereby passive Si uptake by vegetation is assumed. We assumed steady‐state downward. 354 . water flow at a rate of…. As water is flowing downward through the soil profile, the DSi. 355 . concentration in particular horizon results from the sum of the DSi concentration measured. 356 . in the horizon above and the produced or deposited DSi in the considered horizon.In general,. 357 . the simulated DSi concentration builds up with depth (Fig. 3). The relative importance of the. 358 . parameters (Table 1) from our model (Fig. 2) depend on the active processes in a specific. 359 . horizon, hence they needed to be estimated for each horizon. Simultaneous mobilization of Si. 360 . in the humus layer is expected from the processes: dissolution, transfer with upward. 361 . capillary movement and uptake by roots and mycorrhizal hyphae. Site specific conditions. 362 . will determine the relative importance of these mechanisms [64].The concentration of organic. 10.
(11) 363 . acids, BSi and pCO2 (equation 12) are probably most important in the humus layer and in the root. 364 . zone (A horizon) which should lead to a rapid Si dissolution (Fig. 3). For the humus layer of. 365 . podzolic soils, low molecular weight organic acids (LMWOA) concentrations ranges between. 366 . 0.50145 mM and 2.6445 mM while pH vary between 2.97 and 3.81 and DSi ranges reach 25-353. 367 . µM [140]. . 368 . The uptake by vegetation is active in the root zone. In Fig. 3 the relative values of DSi is. 369 . estimated for a soil with passive uptake by vegetation, the DSi concentration in soil water. 370 . will not be influenced by vegetation (ra=0). In the E‐horizon most soluble particles have been. 371 . leached out and only the most stable minerals are left over, which should lead to no further. 372 . change in DSi concentration in this horizon (Fig. 3). For podzolic soils, LMWOA. 373 . concentrations ranged from 0.00 to 0.45084 mM, pH from 2.59 to 4.04 and DSi from 103 to 1032. 374 . µM in the E-horizon. In the B-horizons of these soils, LMWOA concentrations ranged from 0.00. 375 . to 0.12455 mM, pH from 4.44 to 6.68 [140]. As the acidity is lower in the B-horizon than in the. 376 . overlying horizons, parameters. 377 . dissolution rate (. 378 . water are generally lower in the B-horizon (116-351 µM in [140]) than in the E-horizon. In the B‐. 379 . horizon DSi can be adsorbed due to the higher concentration of Al‐ and Fe‐hydroxides. 380 . (equation 16) and oxides and precipitation of secondary minerals can take place (Fig. 3). The. 381 . concentrations of Al and base cations (equation 12) are probably the most important in the B. 382 . horizon. To complicate the situation the presence of organic acids, pCO2 and BSi needs to be. 383 . accounted for when root zones extent into the E‐ and B‐layers. In that case concentrations of. 384 . organic acids and BSi will be higher over a deeper section of the soil profile. Finally, DSi. 385 . concentrations depend on the importance of each of the processes described. In the upper. 386 . part of the soil profile the poorly known biological and pedogenic processes probably control. 387 . the Si‐cycle.. 388 . Deeper in the soil, geological processes (weathering of minerals) are controlling the Si‐. 389 . transport. Those processes are better known. In the saturated area, sulfates and carbonates. 390 . should be taken into account when using equation 12. In Fig. 3, homogeneous bedrock was. 391 . assumed. . 392 . [Table 1 about here]. 393 . Soil moisture will depend on soil texture: θ will typically range between 0.25-0.45 in silt and. 394 . between 0.1-0.4 in sandy loam. However storage and retention capacities vary through a soil. 395 . profile: the clay richer B-horizon have a bigger retention capacity which provides a higher θ values. 396 . [81]. In this horizon residence time (equation 15) of the water will be higher, which gives. 397 . more time for all processes to take place. In the capillary fringe located just above the. 398 . groundwater level, θ increases drastically (Fig. 3) and approximates saturation, e.g.. 399 . A higher soil moisture will facilitate dissolution as it occurs when water comes in contact. 400 . with the solid phases of the soil (equation 9, 10 & 11) as well as DSi diffusion from capillary. and. (equation 12) diminish resulting in a lower. in equation 12) and in generally lower. Resulting DSi concentrations in soil. (Table 1).. 11.
(12) 401 . to leaching pore water. The relative water content profile represents an average situation, in. 402 . dry or wet conditions the top of the profile certainly differs. . 403 . [Fig. 3 about here]. 404 405 406 . 3. Delivery of Si from the soil to the river. 407 . The approach to describe DSi mobilization depends on the scale of the study. On a global scale. 408 . DSi transport depends on lithology and runoff, although vegetation and temperature have been. 409 . highlighted as potential factors influencing this transport [17, 67,, 79]. This reflects the. 410 . importance of primary mobilization of Si for the intensity of the Si cycle: even though more and. 411 . more studies show the importance of the biological pathways, prime mobilization is an important. 412 . boundary condition for the vegetation and ecosystem filters functioning [129].. 413 . On the ecosystem scale, general biogeochemical mass balances of Si have been established [15,. 414 . 102]. Processes leading to DSi export are excluded from these models. According to Drever and. 415 . Stillings [46], transport controls weathering, which process is essentially important in the saturated. 416 . zone (Fig. 3). Still a lot of different processes appear to influence Si export (Fig. 3). Therefore it is. 417 . necessary to focus on the different hydrological zones: the unsaturated zone and the saturated. 418 . zone.. 419 . The effective transport of the DSi will depend on soil hydraulic parameters like the hydraulic. 420 . conductivity, the porosity, the bulk density and the matrix tortuosity, dispersivities, effective. 421 . diffusion coefficient and adsorption partitioning coefficient.. 422 . Graf and Therrien [66] simulated the transport of DSi with thermohaline groundwater flow at the. 423 . catchment scale in 3D. Since their focus is on groundwater flow, they only consider saturated. 424 . (θ=1) conditions and hence neglect plant uptake. They included in their model the effect of. 425 . adsorption by including a retardation factor. The reactive transport of DSi is expressed in equation. 426 . 18 which assumes fluid incompressibility and constant fluid density[8]. Γ. 427 . (18). 428 . In equation 18, i and j are the dimension and equal to 1, 2 or 3, qi is the Darcy flux (m s-1) which. 429 . depends on the hydraulic conductivity of the soil, C (kg l-3) is the solute concentration, R [-] is the. 430 . retardation factor,. 431 . source/sink term or the net production of H4SiO4. The coefficient of hydrodynamic dispersion. 432 . is detailed in Bear’s equation (equation 19) [8] where α (m) and α (m) are respectively the. 433 . longitudinal and transverse dispersivity, is the matrix tortuosity,. 434 . diffusion coefficient and. 435 . partly due to adsorption. The retardation factor R defined in equation 20[55] depends on the bulk. (m2s-1) is the coefficient of hydrodynamic dispersion, Γ (g l-3 s-1) is the. (m2 s-1) is the free-solution. (-) is the Kronecker delta function. The transport will also be retarded. 12.
(13) 436 . density ρ (g m-3) of the porous medium and the equilibrium distribution coefficient. 437 . a linear Freundlich isotherm.. 438 . 439 . R. 440 . While Graf and Therrien [66] studied the transport of DSi only for the saturated zone, Gérard et al.. 441 . [62] investigated processes controlling DSi on the scale of the soil profile, in the unsaturated zone.. 442 . The DSi concentrations were measured in leachates and in capillary solutions. The seasonality in. 443 . DSi differed between capillary solutions and leaching solutions, maximum DSi values were. 444 . observed in different seasons. The DSi concentrations in capillary solutions were mainly. 445 . controlled by surface weathering. This aqueous Si diffuses then slowly to leaching solutions.. 446 . Gérard et al. [62] suggest that diffusion goes more rapidly in well drained systems, like those. 447 . studied by Berner et al.[12]. In Gérard et al. [63]the flux is simulated based on equation 21 through. 448 . the first 120 cm of a topsoil covered by a forest. In this zone and on this scale the uptake flux (qp. 449 . [s-1]) of the solute (C [mol l-1 s-1]) by vegetation will have an influence on the Si transport. The soil. 450 . moisture is also taken into account here as the topsoil is located in the partially saturated zone and. 451 . since transport can only take place if enough water is available. For the 1D simulation of Si flux. 452 . through vertical soil profiles, the equation for the hydrodynamic dispersion coefficient. 453 . (equation 19) has been simplified (equation 22). Retardation is not taken into account in this model. 454 . since previous research in the same study area pointed out the larger importance of diffusive. 455 . processes [62].. α. α. α| |. (19). 1. (20). Γ. 456 457 . | |. (g-1 m3) for. α. q C. (21). α. (22). 458 . Here, we showed that the scale of the study and the zone of interest have determined the choice of. 459 . parameters. To simulate all processes in a catchment we would have to combine equations 18 and. 460 . 21 and use equation 23. In the partially saturated zone, θ is lower than 1 as opposed to the. 461 . saturated zone where it is equal to 1. The qp will be higher than 0 in the root zone in contrast to the. 462 . zone below the roots where it is equal to 0. For the hydrodynamic dispersion coefficient. 463 . recommended to use equation 19, at least if all parameters can be estimated.. 464 . Γ. q C . . . . it is. (23). 465 . For the soil profile illustrated in Fig. 3, we propose a model as presented in Fig. 4. The DSi is. 466 . calculated for each soil horizon. The relative importance of the internal processes of each horizon. 467 . are illustrated by the thickness of the internal arrows. The water flows with the calculated. 468 . transported concentrations (equation 23) from one horizon to another as illustrated by the dashed. 469 . arrows. While the saturated zone is assumed to have a homogeneous lithology the DSi. 13.
(14) 470 . concentrations calculated in the final box should be similar to the DSi concentrations in the river. 471 . during base flow. Here the transport equation 23 is also used with. 472 . [Figure 4 about Here]. equal to. .. 473 . 4. External forces altering internal dynamics. 474 . 4.1.. Effect of land use. 475 . Land use has an impact on different parameters of the soil-vegetation continuum (soil structure,. 476 . vegetation, hydrology, etc.) and will impact Si dynamics in ecosystems. Evidently, Si export. 477 . fluxes from different ecosystems vary significantly [127, 49, 105]. To take into account the role of. 478 . ecosystem as filter in the Si transport [129], we show for the three most common temperate land. 479 . use types (croplands, forest and grasslands/pastures) how DSi concentrations and controlling. 480 . parameters (equation 12) are influenced by land use (Fig. 5). Most research has focused on Si-. 481 . cycling of tropical and temperate forests [2, 7,56, 63, 26, 22]. Few studies have been realized in. 482 . grasslands [13, 96, 99] and almost no study [110, 124] deals with Si dynamics in cropland. 483 . ecosystems.. 484 . Weathering rates and the internal biogeochemical cycle of Si depend on the type of vegetal cover. 485 . (quality and quantity of roots), biomass and litter, which differ from one land cover to another.. 486 . Plants change soil physical properties by binding fine particles and disintegrating bedrock which. 487 . alters the surface area and the interaction time between minerals and water. Consequently,. 488 . chemical weathering rates, root exudates and cation biocycling increase with plant development. 489 . [84, 10, 4882]. Soil temperature and the susceptibility to erosion depends also on the vegetation. 490 . cover. Finally, vegetation will have an impact on the chemical properties of the soil solution. The. 491 . plants and associated microbiota generate chelating ligands and acidifying products like CO2 and. 492 . organic acids. Roots take up chemical elements that partly and delayed come back to the soil by. 493 . degradation of the litter [24, 102, 15, 28, 47, 141]. Hence, land use management will disturb the. 494 . natural Si-geobiocycling.. 495 . Forests have a thick humus layer covering the root penetrated soil profile. Litterfall restitutes large. 496 . amounts of biologically precipitated Si to the soil system. This implies an increased availability (or. 497 . large pool) of easily dissolvable Si. Consequently, DSi concentrations are high (last column of Fig.. 498 . 5), e.g. 375±126µM in soil water and 423±52 µM in river water at base flow [23]. Forests soils are. 499 . typically acidic but still differ between tree-stand compositions, e.g. pH is lower in coniferous. 500 . forests than in deciduous forests (Johansson et al., 2003). The thick humus layer will also provide. 501 . organic acids and dissolved organic matter to the soil solution[111], which enhances the. 502 . dissolution of Si (equation 12). Moreover, uptake of DSi is quite important, although it is not. 503 . proven that this is an active process in forests [31]: rA was thus neglected for forests in Fig. 5. In. 504 . comparison to their DSi losses, forests are characterized by an important internal biogeochemical. 505 . (re-)cycling of Si [2, 91,100]. In temperate forests, vegetation uptake ranges from 2.3 to 43 kg ha-1. 506 . yr-1, Si restitution by litterfall ranges from 2.1 to 41 kg ha-1 yr-1, while the export by drainage from. 14.
(15) 507 . the catchments ranges only from 0.7 until 28 kg ha-1 yr-1 [7, 30, 97, 63]. Due to this intensive. 508 . internal cycling, the transport of DSi towards the river is delayed [25]. BSi preservation in forest. 509 . soils has been shown for different climates, the stable BSi pool represents an accumulation rate 4. 510 . to 6 kg Si ha-1yr-1 in equatorial rainforests [2] and 0-1 kg Si ha-1yr-1 [7] in temperate deciduous and. 511 . coniferous forest. Weight percentages of ASi determined for a forest soil reached 0.5-1.4% in the. 512 . humus layer (pH 3.8), 0.3-0.6% in the topsoil and 0.3-0.4% at 30 to 45 cm depth (pH 4.5). Soil. 513 . water from topsoil had a pH of 4.12-5.05 and concentrations of dissolved organic carbon of 23.5-. 514 . 69.0 mg/l resulting in DSi concentrations of 30.6-64.5 µM. At 60 cm depth, soil water had a pH of. 515 . 4.75-5.52 and concentrations of dissolved organic carbon of 2.3-3.7 mg/l resulting in DSi. 516 . concentrations of 60.2-80.8 µM at 60 cm depth [29]. Fig. 5 illustrates similar trends trough the soil. 517 . profile: a parallel decrease for ASi and organic acids as well as an increase of pH and DSi with. 518 . depth.. 519 . Soil profiles of grasslands are characterized by shallow roots and a humus layer. Grasses. 520 . accumulate Si actively, this means Si uptake is larger than water uptake [92]. The biological Si. 521 . cycling in grasslands is more or less comparable with the biocycling of forests. However, the Si. 522 . biocycling has greater impact on mineral weathering in grasslands than in forests [13]. The amount. 523 . of soil phytoliths diminishes like soil organic C with depth (Fig. 5). Blecker et al.[13] measured in. 524 . different topsoils 0.2-0.5 g cm-2 soil organic C and 0.1-0.5 g cm-2 phytoliths. For the same soils at. 525 . 70 cm depth, both parameters were ≤0.1 g cm-2. The storage of BSi in grassland soils is relatively. 526 . high compared to forests and varies from 4 to 16 kg Si ha-1yr-1. Different causes have been. 527 . proposed for this relatively low bio recycling. Climatic weathering could be more important in. 528 . forests enhancing dissolution processes [13]. The lower specific surface of phytoliths could also. 529 . explain the lower solubility (10-15 times) of grass BSi in comparison to forest BSi[148]. Due to. 530 . intensive mowing, and possibly cattle grazing of grasslands, a part of the BSi pool is removed. 531 . from the ecosystem [127]. In this case, the ASi accumulation in the soil will not be replenished (or. 532 . restituted) by plant uptake, which could eventually result in depletion of easy dissolvable Si pool.. 533 . In contrast it has also been shown that grazing can lead to higher BSi in grasses [96, 99].. 534 . Resulting DSi concentrations in natural waters are rather low compared with forest (last column in. 535 . Fig. 6), e.g. 108±50µM in soil water and 183±37µM in river water [23].. 536 . In croplands, harvesting, erosion and the use of fertilizers can lead to Si-depletion in soils. For. 537 . some specific tillage technique, roots are only present in growing season and are absent during. 538 . winters due to harvesting. Harvesting prevents litter accumulation and the development of a humus. 539 . layer which leads to low BSi accumulation in cropland soils [101,; 110, 139]. Erosion is important. 540 . in croplands as bare soils are exposed to the wind and precipitation. Soil erosion can be especially. 541 . high during peak-events leading to the removal of ASi from the soil. As a result, dynamics of DSi. 542 . and ASi in river water of cultivated first-order catchments differ between peak flow events and. 543 . baseflow[124]. Resulting DSi concentrations in soil water are rather low, e.g. 106±41 µM and. 544 . 204±63µM for different sites[23]. The use of nitrate fertilizers enhances the weathering of Si as. 545 . nitrification processes releases acids[53].. 15.
(16) 546 . Fig. 5 summarizes the general processes influencing the DSi concentrations for each type of land. 547 . use. Soil temperature is generally lower under forest than under grassland cover. Cropland soils. 548 . have higher temperatures and seasonal variations are more important compared to the other land. 549 . uses [135, 120]. As the measured temperature differences between cropland, grassland and forests. 550 . are in the order of magnitude of a few degrees (°C), these differences will probably not influence. 551 . directly the dissolution of Si but can influence biological activity and thus the uptake of DSi, the. 552 . amount of organic acids, pCO2, etc. In general the pH is lower in forests than in grasslands and. 553 . arable lands. The amount of dissolved organic matter is the highest in forests and lower in. 554 . croplands than in grasslands. The pCO2 in soils was proved to be the highest in arable land,. 555 . followed by grasslands and lowest in forests [1]. The acidity parameters (equation 12) driving. 556 . dissolution are thus different following the land use: in forests organic acids and pH are important. 557 . but in grassland and cropland pCO2 will be more important compared to forests.. 558 559 560 . [Fig. 5 about here]. 4.2.. Seasonal climatic variation. 561 . Seasonal variations of DSi have been observed in water of temperate forested catchments with. 562 . humid winters and dry summers ([88, 105]. In summer, rainfall events are typically more. 563 . intensive. Various explanations are given for the temporal variation in DSi transport [113, 56,105].. 564 . If lithology of the aquifer varies vertically, more weatherable layers can be in contact with high. 565 . groundwater levels and release Si, in which case water chemistry can be correlated with. 566 . groundwater level [113]. The decrease of DSi in natural waters during the growing season can be. 567 . explained by the DSi uptake by vegetation [56] or by the consumption of DSi by diatoms in the. 568 . river [105]. In the first case the decrease will be observed in soil waters in contrast to the second. 569 . case were the decrease is only observed in river water. Gérard et al. [62] observed a significant. 570 . seasonal variation in soil water and connectivity between the soil and river system: DSi. 571 . concentrations in capillary soil solutions were generally ca 35 µM lower during winter than during. 572 . summer.. 573 . The autumn-winter period characterized by:. 574 . -. low evapotranspiration rates which induces low uptake of DSi by passive vegetation,. 575 . illustrated by a weak interaction for forest and grassland or no interaction in cropland in. 576 . Fig. 6;. 577 . -. of the lithologies (equations 9, 10, 11);. 578 579 . -. 582 583 . decaying organic matter releasing BSi into the soil giving a larger fresh ASi stock available, especially in forests where litterfall is important (BSi in Fig. 6);. 580 581 . higher soil moistures (θ in Fig. 6) and groundwater levels which can enhance dissolution. -. polymerization of DSi and complexation of Si with particulate material when water freezes [133].. During spring and summer, other processes are important:. 16.
(17) 584 . -. vegetation, illustrated as important interaction in Fig. 6 ;. 585 586 . -. 591 . higher temperatures increases biological activity which leads to more acid production (pH or H+, [org] and pCO2 in Fig. 6 and equations 6, 7, 8 & 12);. 589 590 . lower soil moistures (θ in Fig. 6) and lower groundwater levels (equations 9,10, 11) limiting unsaturated transport of DSi to the aquifer [23];. 587 588 . higher evapotranspiration rates, which induces dryer soils and higher uptake of DSi by. -. higher acid production results in Si desorption and in a shift of cation exchange equilibria, i.e. base cations are replaced by H+ on the mineral surfaces (equations 6, 7, 8 & 12) [12].. 592 . To conclude, DSi concentrations should generally be lower during winter than during summer as. 593 . acid production will drive a lot of processes enhancing Si dissolution. Transport processes in the. 594 . dry summer will be slower: maximal DSi concentrations can be observed at different times in soil. 595 . capillary soil water, leaching solution and river water due to diffusion processes from capillary to. 596 . leaching solution [62] or due to a long transport time from soil to river.. 597 . [Fig. 6 about here]. 598 . 5. Discussion and conclusions. 599 . This review presents a conceptual model for DSi transport from landsurface, through each soil. 600 . horizon of a typical podzol soil, subsurface until the river for catchments with temperate climate.. 601 . This is the first time a framework of equations is proposed that may be used as a first step to. 602 . develop a mechanistic model for DSi production and transport. The proposed model needs to be. 603 . validated by applying the model on fields. As each field has its own specific characteristics, the. 604 . user of such an equation framework can check which controlling processes and rate limiting. 605 . processes are important in his study case. Based on that analyse the user can simplify the. 606 . framework by dismissing some processes, if needed. Still several unknowns need to be further. 607 . clarified to entirely understand the Si-cycle. On the scale of the soil profile, not all pedogenic. 608 . processes are known. The influence of sulfates in the saturated zone have been observed in. 609 . some study cases [83,87] and should be better studied to determine if it is an important. 610 . process or not. The influence of microbial activity on mineral changes seems difficult to quantify.. 611 . The reactivity of BSi particles in soil profiles have not been well studied, i.e. is BSi reacting like. 612 . mineral Si to pH changes?. 613 . By analyzing the parameters driving DSi production (equation 12), we could state seasonal. 614 . variation of DSi export is linked to the importance of biological activity. Si-cycling is more. 615 . important during spring and summer due to high biological activity inducing for example higher. 616 . acidity production. This results in lower DSi concentrations in soil water during autumn and. 617 . winter compared to spring and summer.. 618 . The BSi storage, the Si-cycling and Si-export differs for the three types of land uses (forest,. 619 . cropland, grassland). It results in high DSi concentrations in the forest rivers. Following the. 620 . analysis of controlling parameters (section 4.1.), relatively high concentrations are expected in. 17.
(18) 621 . grasslands and low concentrations in croplands due to the respectively decreasing BSi storage and. 622 . soil acidity. Nevertheless the data from Clymans [23] show no significant difference between DSi. 623 . in soil water of grassland and cropland. Moreover, the comparison of soil water DSi in different. 624 . catchments with the same land use [23]show different DSi concentrations. This emphasizes the. 625 . importance of determining the site-specific parameters influencing the Si transport. On the. 626 . catchment scale, we emphasized that ecosystem management has an impact on the Si cycle. It is. 627 . not clear in grazed grasslands how the digestion of grasses influences the availability of BSi to the. 628 . Si-cycle. Deforestation, harvesting, mowing, grazing retrieve BSi stored in vegetation from the. 629 . specific ecosystems (forest, cropland or grassland). However the destination of BSi retrieved by. 630 . deforestation, harvesting and mowing is unknown, it might be released in another Si cycle or not.. 631 . This is important to figure out for Si-budget calculations on a large scale. However, some. 632 . parameters (i.e. soil water content, base cations) of our dissolution model are sometimes difficult. 633 . to compare from one land use type to another as they are influenced by site specific factors. 634 . (meteorological conditions, soil mineralogy).. 635 . Struyf et al. [127] proposes a model for the evolution of the Si-cycle and the Si transport during. 636 . baseflow due to land-use changes. This model proposes an increase in DSi export during the. 637 . development of a forest, a relatively constant and high export during the climax phase of the forest. 638 . development. The deforestation will induce a quick increase of Si export [88, 6, 26] on the short. 639 . term (<20yrs; [26]). Likens et al. [88] supposed the deforestation increased the weathering of. 640 . primary minerals, but knowing that ASi is much more soluble than primary silicates, Conley et. 641 . al.[26] proposed three other hypotheses. The excess of DSi can result from the dissolution of ASi. 642 . contained in cut vegetation left on the soil. Another possible explanation is the mobilization of the. 643 . large amount of BSi stored in forest soils[25, 13]. The last hypothesis to explain the excess of DSi. 644 . exported after deforestation is an enhanced leaching due to the re-establishment of vegetation. As. 645 . the ASi amount diminishes after deforestation the long term evolution (500-1000 yrs; 127] of. 646 . landscapes from forest to cropland would generate on the long term a diminishing Si export.. 647 . Clymans et al. [22] observed that historical land use changes resulted in a 50% decrease of BSi. 648 . storage in Swedish soils. This diminishing Si export can be explained by the change in chemical. 649 . and physical properties of soils thus by the change in dissolution driving parameters (equation 12).. 650 . Even if the pH will increase when forest becomes cropland or pasture, the base exchange. 651 . properties will increase. This could have a lowering effect on DSi concentrations of soil water.. 652 . Moreover, the decreasing porosity will diminish infiltration capacity and increase erodability [51,. 653 . 117]. As erodability increases, BSi depletion of soils will start. . 654 . An important question remains: how much DSi exported from out of a catchment comes from BSi. 655 . relatively to MSi? To understand the relative contribution of the biological filter to eventual. 656 . output of DSi, Derry et al.[34] combined Ge/Si ratios with the Si concentrations. Cornelis et. 657 . al. [32]recommended to make a Si mass balance and combine the use of Ge/Si and δ30Si as. 658 . geochemical tracers. These tracers can be used because they are fractionated during the. 659 . biogeochemical cycle which implies that different sources have different tracer’s signatures. 660 . [109]. Germanium concentrations are relatively high in clayey weathering products compared to. 18.
(19) 661 . concentrations measured in phytoliths [104, 86, 121, 14,33]. The light Si isotopes are. 662 . preferentially built-in secondary clay minerals, taken up by plants and adsorbed on Fe-oxides. Due. 663 . to this processes the DSi flowing into the river will be enriched in heavy isotopes [110, 29, 42, 18,. 664 . 36, 35, 60,61] . Si isotopes and element ratios (Si/Mg; Ge/Si) can be good proxies to understand. 665 . which processes (weathering, uptake by diatoms, uptake by terrestrial vegetation) influence the. 666 . seasonal variation of DSi in river water [49, 32]. Using these two elements has several advantages:. 667 . the ratio Ge/Si can be related to the geochemical source of Si and hence sources with similar Si. 668 . concentration can be differentiated. All these approaches are still in early stages of development,. 669 . therefore it is presently difficult to assess different Si sources based on either method. Early results. 670 . are mainly related to small scale isotope fractionation in isolated soil-plant systems, for few. 671 . species only (Musa sp., bamboo, …). On the catchment scale, isotope signatures are still difficult. 672 . to assign, as different biogeochemical mechanisms contribute similarly to isotope ratios. More. 673 . detailed research on these tracers in specific land use types could significantly enhance this. 674 . research.. 675 676 . To assess CO2 consuming processes like Si weathering [20] or diatom uptake, the exact. 677 . quantification of the total amount of Si in soils and total amount of DSi transported from the. 678 . continent to the ocean are essential. In contrast to our proposed model, current approaches. 679 . (e.g.[65]) ignore the biogenic Si pool as a DSi source, DSi sinks like Si uptake by plants or Si. 680 . nucleation and differences due to the land use types. Prediction models of global DSi transport in. 681 . the future will have to take these factors into account as well as the expansion of agriculture. 682 . (Gordon et al., 2008) and the rising number of peak events due to climate change. Transport of. 683 . DSi from soil to river will probably diminish in the future. In this study only three land uses were. 684 . analysed. In urban areas, the Si transport needs to be tackled in a different way, anthropogenic. 685 . point sources (industries) need to be taken into account and as exposed soil is rather scarce, raw. 686 . materials will be sources of Si during runoff events [123].. 687 . To tackle the eutrophication problem the Si:N:P ratios should be considered in order to obtain the. 688 . whole picture. Eutrophication is due to increasing N and P concentrations, while Si concentrations. 689 . would not change [21]. Snowmelt periods need to be analysed carefully as DSi can be diluted in. 690 . rivers during snowmelt periods while nitrates increase enhance eutrophication [68, 69, 149). Since. 691 . we discussed the shifts of DSi transport by land-use changes and these changes can affect also the. 692 . leaching of N [51], the impact of land use changes on the Si:N:P should be further analysed.. 693 694 . Aknowledgements. 695 696 697 698 699 700 701 . Benedicta Ronchi and Wim Clymans would like to thank the Flemish Agency for the promotion of Innovation by Science and Technology (IWT) for funding them personal promotion grant. Eric Struyf acknowledges FWO (Flemish Research Foundation) for funding his postdoc grant. We acknowledge FWO for funding project “Tracking the biological control on Si mobilization in upland ecosystems” (Project nr. G014609N). Floor Vandevenne and Ana Lúcia Pena Barão would like to thank BOF-UA for PhD fellowship funding.. 19.
(20) 702 703 . . 704 . References. 705 706 707 708 709 710 711 712 713 714 715 716 717 718 719 720 721 722 723 724 725 726 727 728 729 730 731 732 733 734 735 736 737 738 739 740 741 742 743 744 745 746 747 748 749 750 751 752 753 754 755 756 . [1] Albertsen M (1977) Labor- und Felduntersuchungen zum gasaustausch zwischen Grundwasser und Atmosphäre über natürlichen und verunreinigten Grundwässern. Thesis, Univ. Kiel. [2] Alexandre A, Meunier J-D, Colin F, Koud J-M (1997) Plant impact on the biogeochemical cycle of silicon and related weathering processes. Geochim Cosmochim Ac 61-3: 677-682 [3] Andrews J, Schlesinger W (2001) Soil CO2 dynamics, acidification, and chemical weathering in a temperate forest with experimental CO2 enrichment. Global Biogeochem Cy 15:149-162 [4] Aoki Y, Hoshino M, Matsubara T (2007) Silica and testate amoebae in a soil under pineoak forest, Geoderma 142(1–2): 29–35 [5] Appelo CAJ, Postma D (1993) Geochemistry, Groundwater, and Pollution. A.A. Balkema, Rotterdam. [6] Bailey SW, Buso DC, Likens GE (2003) Implications of sodium mass balance for interpreting the calcium cycle of a northern hardwood ecosystem. Ecology 84: 471–484 [7] Bartoli, F (1983) The biogeochemical cycle of silicon in two temperate forest ecosystems. Environ Biogeochem Ecol Bull 35: 469– 476. [8] Bear J (1988) Dynamics of fluids in porous media. Elsevier, New York [9] Beckwith RS, Reeve E (1962) Studies on Soluble Silica in Soils. I. The Sorption of silicic acid by soils and minerals. Aust J Soil Res 1 (2): 157 – 168 [10] Berner RA (1992) Weathering, plants and the long-term carbon cycle, Geochim Cosmochim Ac 56: 3225–3231 [11] Berner RA (1995) Chemical weathering and its effect on the atmospheric CO2 and climate In: Chemical weathering rates of silicate minerals, Reviews in mineralogy, Mineralogical Society of America, Washington, DC [12] Berner RA, Rao JL, Chang S, O’Brien R, Keller CK (1998) Seasonal Variability of Adsorption and Exchange Equilibria in Soil Waters. Aquat Geochem 4: 273–290 [13] Blecker SW, McCulley RL, Chadwick OA, Kelly EF (2006) Biologic cycling of silica across a grassland bioclimosequence. Global Biogeochem Cy 20, DOI:10.1029/2006GB002690 [14] Blecker SW, King SL, Derry LA, Chadwick OA, Ippolito JA, Kelly EF (2007) The ratio of germanium to silicon in plant phytoliths: Quantification of biological discrimination under controlled experimental conditions. Biogeochemistry 86: 189–199 [15] Bormann BT, Wang D, Bormann FH, Benoit G, April R, Snyder MC (1998) Rapid, plantinduced weathering in an aggrading experimental ecosystem. Biogeochemistry 43: 129– 155, 1998. [16] Bowser CJ, Jones BF (2002) Mineralogical controls on the composition of natural waters dominated by silicate hydrolysis. Am. J. Sci. 302: 582-662. [17] Bluth GJS, Kump LR (1994) Lithologic and climatologic controls of river chemistry. Geochim Cosmochim Ac 58: 2341-2359. [18] Cardinal D, Gaillardet J, Hughes H J, Opfergelt S, André L (2010) Contrasting silicon isotope signatures in rivers from the Congo Basin and the specific behaviour of organicrich waters. Geophys. Res. Lett. 37 DOI:10.1029/2010GL043413 [19] Chadwick OA, Hendricks DM, Nettleton WD (1987) Silica in duric soils, 2. Mineralogy, Soil Sci Soc Am J 51(4): 982–985. [20] Chadwick OA, Kelly EF, Merritts DM, Amundson RG (1994) Atmospheric Carbon Dioxide Consumption During Soil Development. Biogeochemistry 24 115–127. [21] Cloern JE (2001) Our evolving conceptual model of the coastal eutrophication problem. Mar Ecol-Prog Ser 210: 223–253. [22] Clymans W, Struyf E, Govers G, Vandevenne F, Conley DJ (submitted) Anthropogenic impact on biogenic Si pools in temperate soils. Biogeosciences http://www.biogeosciences-discuss.net/8/4391/2011/bgd-8-4391-2011.pdf. 20.
(21) 757 758 759 760 761 762 763 764 765 766 767 768 769 770 771 772 773 774 775 776 777 778 779 780 781 782 783 784 785 786 787 788 789 790 791 792 793 794 795 796 797 798 799 800 801 802 803 804 805 806 807 808 809 810 811 812 813 814 815 816 817 818 . [23] Clymans W, Govers G (sup.), Van Rompaey, A. (cosup.), Struyf, E. (cosup.) (2012) Land use related silica dynamics in terrestrial ecosystems. Thesis. KULeuven. [24] Cochran MF, Berner RA (1996) Promotion of chemical weathering by higher plants: field observations on Hawaiian basalts. Chemical Geology 132: 71-77 [25] Conley DJ (2002) Terrestrial ecosystems and the global biogeochemical silica cycle. Global Biogeochem. Cy. 16(4) 1121, doi:10.1029/2002GB001894, 2002. [26] Conley DJ, Likens GE, Buso DC, Saccone L, Bailey SW, Johnson CE (2008) Deforestation causes increased dissolved silicate losses in the Hubbard Brook Experimental Forest. Glob Change Biol 14: 1–7 [27] Conrad CF, Icopini GA, Yasuhara H, Bandstra JZ, Brantley SL, Heaney PJ (2007) Modeling the kinetics of silica nanocolloid formation and precipitation in geologically relevant aqueous solutions. Geochim Cosmochim Ac 71: 531–542 [28] Cookson WR, Osman M, Marschner P, Abaye DA, Clark I, Murphy DV, Stockdale EA, Watson CA (2007) Controls on soil nitrogen cycling and microbial community composition across land use and incubation temperature. Soil Biol Biochem 39: 744–756 [29] Cornelis J-T, Delvaux B, Cardinal D, André L, Ranger J, Opfergelt S (2010) Tracing the mechanisms controlling the release of dissolved silicon in forest soil solutions using Si isotopes and Ge/Si ratios. Geochim Cosmochim Ac 74: 3913–3924 [30] Cornelis J-T, Ranger J, Iserentant A, Delvaux B (2010) Tree species impact the terrestrial cycle of silicon through various uptakes. Biogeochemistry 97: 231–245 [31] Cornelis J-T, Delvaux B, Titeux H (2010) Contrasting silicon uptakes by coniferous trees: a hydroponic experiment on young seedlings. Plant Soil 336: 99–106 [32] Cornelis J-T, Delvaux B, Georg RB, Lucas Y, Ranger J, Opfergelt S (2011) Tracing the origin of dissolved silicon transferred from various soil-plant systems towards rivers: a review. Biogeosciences 8: 89–112 [33] Delvigne C, Opfergelt S, Cardinal D, Delvaux B, Andre L. (2009) Distinct silicon and germanium pathways in the soil-plant system: Evidence from banana and horsetail. J. Geophys Res 114, G02013, doi:10.1029/2008JG000899. [34] Derry LA, Kurtz AC, Ziegler K, Chadwick OA (2005) Biological control of terrestrial silica cycling and export fluxes to watersheds. Nature 728: 433 [35] De La Rocha CL, Brzezinski MA, De Niro MJ (2000) A first look at the distribution of the stable isotopes of silicon in natural waters. Geochim Cosmochim Ac 64: 2467–2477 [36] Delstanche S, Opfergelt S, Cardinal D, Elsass F, André L, Delvaux B (2009) Silicon isotopic fractionation during adsorption of aqueous monosilicic acid onto iron oxide, Geochim Cosmochim Ac 73: 923–934 [37] Devidal JL (1994) Solubilité et cinétique de dissolution/précipitation de la kaolinite en milieu hydrothermal. Approche expérimentale et modélisation. Ph. D. Thesis University Paul Sabatier, Toulouse, France. [38] Devidal JL, Dandurand JL, Schott J (1992) In Kharaka, Y. K. and Maest, A. S. (eds) Water Rock Interaction. A. A. Balkema, Rotterdam. [39] Devidal JL, Schott J, Dandurand JL (1997) An experimental study of kaolinite dissolution and precipitation kinetics as a function of chemical affinity and solution composition at 150°C, 40 bars, and pH 2, 6.8, and 7.8. Geochim Cosmochim Ac 61: 5165–5186. [40] Dietzel M (2002) Dissolution of silicates and the stability of polysilicic acid. Geochim Cosmochim Ac 64 (19): 3275–3281 [41] Doucet F, Schneider C, Bones S, Kretchner A, Moss I, Tekely P, Exley C (2001) The formation of hydroxyaluminosilicates of geochemical and biological significance. Geochim Cosmochim Ac 65 (15): 2461–2467 [42] Douthitt CB (1982) The geochemistry of the stable isotopes of silicon. Geochim Cosmochim Ac 46: 1449–1458. [43] Dove PM (1995) Kinetic and thermodynamic controls on silica reactivity in weathering environments, in: chemical weathering rates of silicate minerals. Mineralogical Society of America and the Geochemical Society, Rev Mineral Geochem 31: 235–290 [44] Dove PM (1999) The dissolution kinetics of quartz in aqueous mixed cation solutions. Geochim Cosmochim Ac 63(22): 3715–27. [45] Drees LR, Wilding LP, Smeck NE, Senkayi AL (1989) In: Dixon B, Weed SB (eds), Minerals in Soil Environments, 2nd edn. Soil Sci Soc Am J, Madison, Wisconsin. [46] Drever JI, Stillings LL (1997) The role of organic acids in mineral weathering. Colloid Surface A 120: 167-181. [47] Drever JI, Zobrist J (1992) Chemical-weathering of silicate rocks as a function of elevation in the southern Swiss Alps. Geochim Cosmochim Ac 56: 3209– 3216.. 21.
Figure
![Fig. 5: Relative importance of the parameters (BSi, [org], pCO2, pH, [SO 4 2- ],[CO 3 2- ],θ, r A ) 1131](https://thumb-eu.123doks.com/thumbv2/123doknet/5812461.140269/32.892.187.866.104.324/fig-relative-importance-parameters-bsi-org-pco-ph.webp)
+3
Documents relatifs
And we also determined the positional relation among atomic species in a-Si:F by observing the change of Rutherford backscattering (RBS) spectra of a-Si:F due to
Title: The effect of water on Si and O diffusion rates in olivine and implications for transport properties and processes in the upper mantle.. Authors: Fidel Costa,
These low-frequency properties are modeled by combining (1) a complexation model of the surface properties of clay minerals (kaolinite, illite, and smectite), (2) a polarization
When the marginal cooperative productivity is higher than the marginal damages of productive inputs on soil quality, there exists a long-term optimal equilibrium with optimal
Cette analyse paramétrique vise d’étudier l’effet de la non-linéarité et l’effet du rapport d’élancement du pieu L/d sur le déplacement à la tête du pieu U, pour deux types
Regarding the potential to cause denoxification and denitrification, the McMurdo lidar observations of a solid particle background emphasise the relevance of NAT PSCs in the
As most alternative antiviral strategies for the treatment of influenza infections, including those related to drug repurposing and targeting the host instead of viral determinants,
Si cette interrogation se pose, c’est moins pour prendre le contrepied des remarques précédentes, en remettant en cause la puissance de nos représentations
