ISSN Online: 2327-4344 ISSN Print: 2327-4336
DOI: 10.4236/gep.2021.93016 Mar. 31, 2021 262 Journal of Geoscience and Environment Protection
Assessment of Flood Risk in Cotonou
Areas Surrounding Nokoué Lake
Due to the Effect of Climate
Change
Apollinaire Essèminvo Chokpon1,2*, Pierre Ozer2,3, Emmanuel Lawin1
1Hydrology and Water Resources Management (Laboratory of Applied Hydrology), National Water Institute, Calavi, Benin 2The Hugo Observatory, University of Liege, Liège, Belgique
3Départment of Sciences and Environment Management, University of Liege, Arlon, Belgique
Abstract
Cotonou, like West African cities, experiences recurrent flooding. This work aimed to study the effect of climate change on the risk of flooding in Cotonou’s zoos on the periphery Nokoué Lake. We analysed climate data (rainfall and temperature) in Cotonou over the period 1953 to 2013, the flow of the Ouémé River at Bonou, and the variation in the height (elevation) of Lake Nokoué. The results of the analysis of temperatures over the period 1953-2013 show an upward break from 1987 onwards (+0.7˚C between 1987 and 2013), while for rainfall, no break was observed over the same period. None of the 13 rainfall indices calculated is statistically significant, but they show a relatively stable or declining trend except for the average daily rainfall, the maximum number of consecutive dry days and the 95th percentile, which all show a slightly up-ward trend. We have shown that the rainfall recorded in Cotonou does not reveal any abnormal or exceptional character over the last ten years, on the one hand, and the flooding of Ouémé River influences that of Nokoué Lake, on the other hand. This study shows that the floods observed in this area are more related to the effect of climate change.
Keywords
Risk, Flood, Cotonou, Climate Change, Flooding
1. Introduction
Floods account for more than a quarter of major natural disasters worldwide. How to cite this paper: Chokpon, A. E.,
Ozer, P., & Lawin, E. (2021). Assessment of Flood Risk in Cotonou Areas Surrounding Nokoué Lake Due to the Effect of Climate Change. Journal of Geoscience and Environ- ment Protection, 9, 262-279.
https://doi.org/10.4236/gep.2021.93016
Received: January 14, 2021 Accepted: March 28, 2021 Published: March 31, 2021 Copyright © 2021 by author(s) and Scientific Research Publishing Inc. This work is licensed under the Creative Commons Attribution International License (CC BY 4.0).
http://creativecommons.org/licenses/by/4.0/ Open Access
DOI: 10.4236/gep.2021.93016 263 Journal of Geoscience and Environment Protection
These floods affect all regions of the globe (Ozer, 2008). The countries of West Africa have been affected by many natural disasters for a long time. In recent decades, there has been a significant increase in their frequency and intensity at-tributable to global warming (IPCC, 2012). Floods, droughts, disruption of rainy seasons and heat waves are the most tangible extreme weather events that affect West African populations (DARA, 2013).
The United Nations Environment Program has identified nineteen climatic “hot spots” in West Africa(UNEP, 2011). Benin is one of these hot spots and has been under serious threat in recent decades by flooding especially the pe-riphery of coastal areas. Cotonou is one of the cities directly exposed to the risk of flooding. Recurrent flooding is linked not only to its geographic location, but also has grown in magnitude over time. Despite the damage caused by these floods, there is an increase in habitats in risk areas, especially around Lake Nokoué. These disasters will not be without consequences for the residents. In Benin, in 2009, displacement due to floods affected at least 20,000 people and, in September 2010, 150,000 people lost their homes (Ferris & Stark, 2012). So it is urgent to assess the risks of this phenomenon by the effects of cli-mate change.
2. Material and Method
2.1. Presentation of the Study Area
Cotonou area is located on the coastal strip that stretches between Nokoué Lake and the Atlantic Ocean, made up of alluvial sands with a maximum height of about five meters. It is the only commune of the Littoral department and is bor-dered to the north by the commune of Sô-Ava and Lake Nokoué, to the south by the Atlantic Ocean, to the east by the commune of Sèmè-Kpodji and to the west by that of Abomey-Calavi. It covers an area of 79 km2, 70% of which is located west of the channel (Akomagni, 2006).
Nokoué lake is located south-east of the Beninese lagoon network (6˚25'N, 2˚36'N), Figure 1. It is connected to the Atlantic Ocean by the Cotonou channel over a length of 4.5 km and a width of 300 m. The average surface area of Lake Nokoué is 150 km2 and its average length is 20 km in its East-West direction with a width of 11 km in its North-South direction (Laleye, 1995).
2.2. Material
To conduct this study, we have used R, XLSTAT, EXCEL, STATISTICA, Sphinx and ArcGis 9.3.
The climate data are those collected at Cotonou Airport station. The hydro-metric data (the flow rates of Ouémé at Bonou and temporal variation of No-koué Lake), the annual rainfall maxima in 24 h, 48 h and 72 h as well as the days when Nokoué Lake and the Ouémé at Bonou overflowed are data that we were able to obtain from the General Water Direction of Benin.
DOI: 10.4236/gep.2021.93016 264 Journal of Geoscience and Environment Protection Figure 1. Ouémé-So-Lac Nokoué fluvio-lagunar complex. Source: Personal work. 2.3. Methods
2.3.1. Methodology of Climate Data Analyzing
The analysis of Cotonou climate data (rainfall and temperature) was performed with R, XLSTAT, EXCEL and STATISTICA software. The analysis of the climate data allowed to assess the links between the evolution of flood risks and the cli-mate change observed over the last decades. For this purpose, from the annual and daily rainfall data over the period 1953 to 2013, we have calculated using R and EXCEL software, the annual total rainfall (PTOT), the number of rainy days (JP), the total number of wet days with rainfall of more than 10 mm, 20 mm and 25 mm (Rx10, Rx20 and Rx25), the average rainfall per wet day (SDII), the maximum rainfall obtained in 1 and 5 consecutive days (Rx1 and Rx5). We also studied the maximum number of consecutive dry days (CDD), the maximum number of consecutive rainy days (CWD) and also the number of days with rainfall above the 95th, 99th and 99.5th percentiles (R95p, R99p and R99.5p) which correspond to intense, extreme and very extreme rainfall events respec-tively.
We have also plotted the curves of temperature variation and reduced centred annual rainfall and their smoothed average over 7 years. The smoothed 7-year average centred on the fourth value allowed us to appreciate the large multi-year fluctuations.
In order to have a general view of our study, we carried out a homogeneity test which is nothing other than the Pettitt (1979)test to see if there is a break.
ex-DOI: 10.4236/gep.2021.93016 265 Journal of Geoscience and Environment Protection
treme events. For do this reason, we studied extreme rainfall events over the pe-riod 1953 to 2013, 1953 to 1982, 1963 to 1992, 1973 to 2002 and 1983 to 2012. To characterize the return periods, we used Gumbel’s law (1958). Note that accord-ing to Ozer and Sene (2002), the rainfall values corresponding to a 6-year return period are considered abnormal, those of 10 years very abnormal, those of 30 years exceptional and very exceptional for rainfall with a return period of 100 years.
We also analysed the evolution of the frequency of annual rainfall maxima in 24 h, 48 h and 72 h in Cotonou.
2.3.2. Methodology of Hydrometric Data Analysing
The study of the variations in the heights (dimensions) of Nokoué Lake and the Ouémé flow rates at Bonou was also carried out with R and XLSTAT soft-ware.
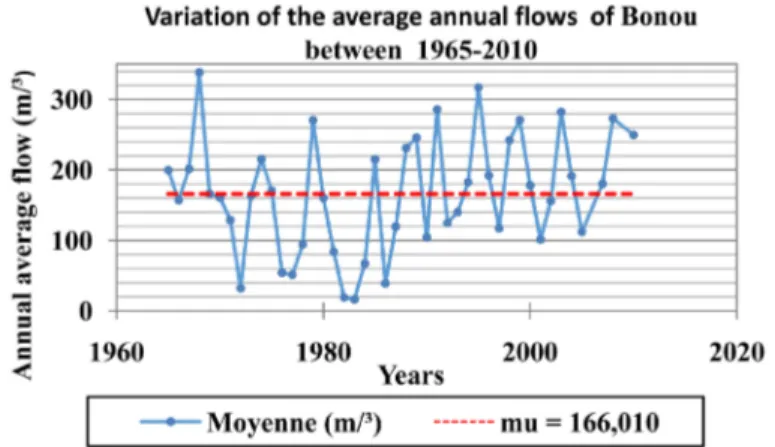
At the first time, we analysed the homogeneity of the flows by applying the test of PETTIT (1979) to see the stability of the flows from the Ouémé to Bonou during the period 1965-2010. We then established correlations between the Ouémé flows at Bonou, the shoreline of Nokoué Lake and the rainfall in Coto-nou to understand the influence of the Ouémé River on Nokoué Lake.
3. Results and Discussion
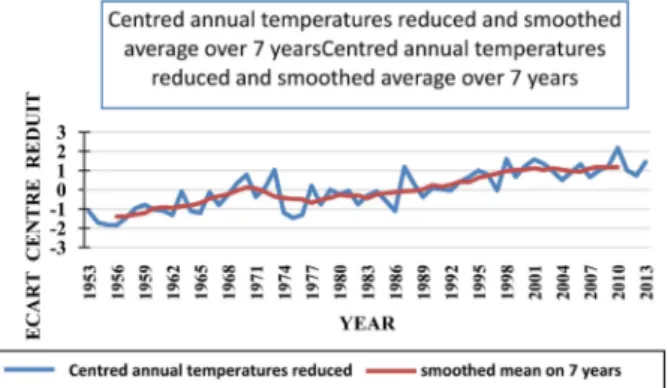
Presentation and Results Analysis Rainfall and Hydrometric Data Results1) Centred annual temperatures reduced and smoothed average over 7 years
Figure 2 shows the variation of the centred annual reduced temperatures (blue curve) and the variation of the smoothed 7-year average (orange curve). When the reduced centred deviation is less than −1, there is a deficit and the temperature is in surplus if the deviation is hight than 1.
Anomalies corresponding to temperature deficits between 1953 and 1957 on one hand and between 1960 and 1962 on other hand can be observed. Subse-quently, deficits were also recorded in 1964, 1965, 1974, 1976 and 1986. On other
Figure 2. Centred annual temperatures reduced and smoothed average annual tempera-tures in Cotonou over the period 1953-2013.
DOI: 10.4236/gep.2021.93016 266 Journal of Geoscience and Environment Protection
hand, temperatures were in surplus in 1973, 1987, 1995 and 1998. The same pat-tern of surpluses is observed from 2000 to 2002, in 2006, from 2008 to 2011 and finally in 2013.
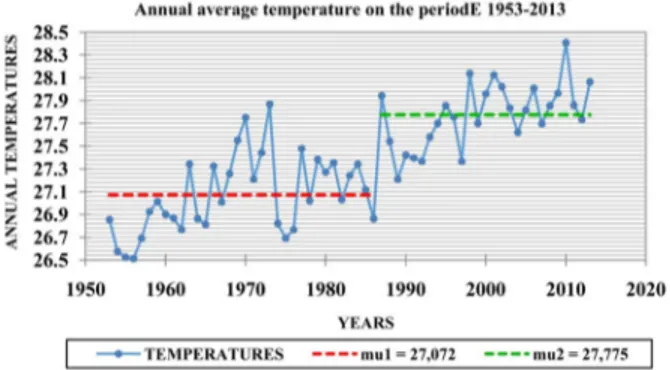
2) Test of homogeneity of the average annual temperature Test Interpretation:
p-value (bilateral) = 0.0001. HO: The data is homogeneous.
Ha: There is a date from which there is a change in the data.
Since the calculated p-value is below the significance level threshold alpha = 0.05 the null hypothesis HO must be rejected and the alternative hypothesis Ha must be retained. The risk of rejecting HO when it is true is 0.01%.
As we have a p-value less than 5%, we can say that the series presents a signif-icant break (Ago et al., 2005).
Figure 3 shows us a very clear break in the annual temperatures observed in Cotonou over the period 1953-2013. We note a first period between 1953 and 1986 corresponding to a less warm period and a second relatively warmer period between 1987 and 2013.
3) Reduced centred rainfall
Analysis of Figure 4 allows us to note that Cotonou is characterised by a series of years with net rainfall deficits or excesses. There was a rainfall deficit in the 1970s, 1973, 1976, 1977, 1980, 1981, 1984, 1998, 2000 and 2001. Rainfall excesses were recorded in 1962, 1963, 1968, 1979, 1987, 1993, 1997 and 2010.
Figure 3. Homogeneity test of the annual temperature in Cotonou between 1953 and 2013.
Figure 4. Reduced centred annual rainfall and smoothed 7-year average in Cotonou over the period 1953-2013.
DOI: 10.4236/gep.2021.93016 267 Journal of Geoscience and Environment Protection
4) Test of rainfall homogeneity Test Interpretation:
p-value (bilateral) = 0.415. HO: The data is homogeneous.
Ha: There is a date from which there is a change in the data.
Figure 5 shows that since the calculated p-value is above the significance level threshold alpha = 0.05 the null hypothesis HO cannot be rejected. The risk of rejecting HO when it is true is 41.51%. As we have a p-value high than 20%, we can say that the series is homogeneous (Ago et al., 2005). So we can deduce that there is no break.
5) Studies of some rainfall indices
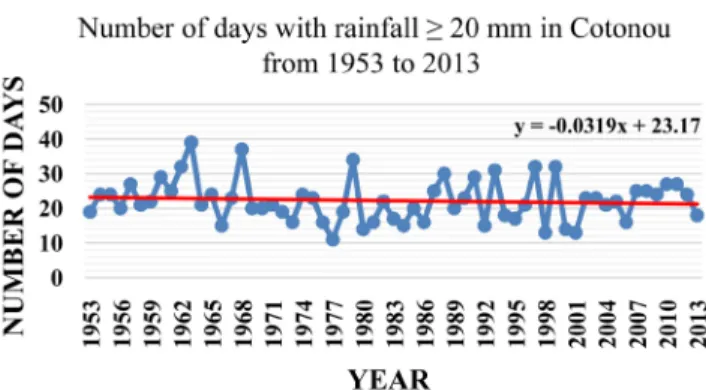
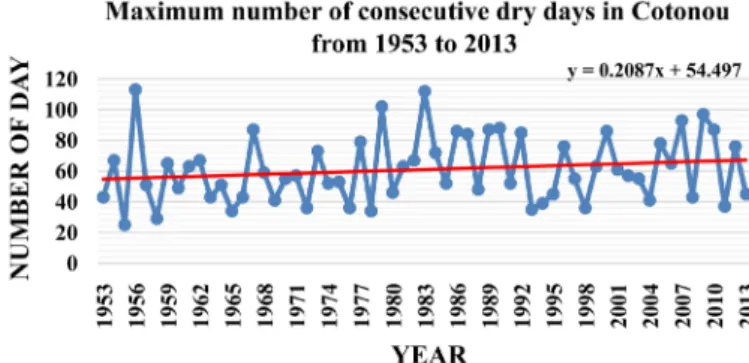
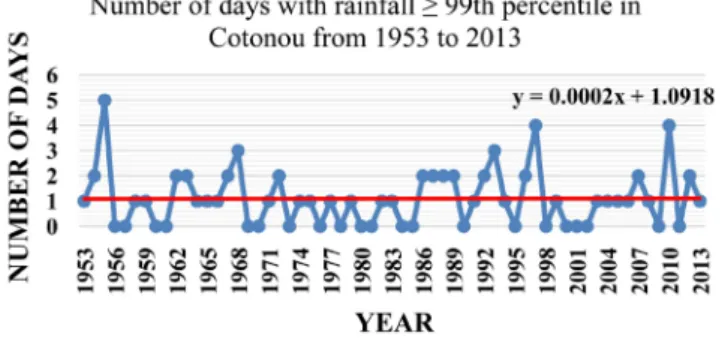
On the different rainfall indices calculated, we note that no index is statisti-cally significant, except for the maximum number of rainy days (CWD) (Figure 6) which has a p-value of 0.084 which is somewhat close. The numbers of days with rainfall ≥ 10 mm, ≥20 mm and ≥25 mm (Figures 7-10) show a relatively downward trend in Cotonou over the period 1953 to 2013. Thereafter, the maximum daily and 5 consecutive days of maximum rainfall (Figure 10 and Figure 11) are declining. There is practically a very slight upward trend in the average rainfall per day in Cotonou over the period 1953-2013 (Figure 12). The maximum number of consecutive dry days shows an upward trend (Figure 13) and the trend in total annual rainfall and the number of rainy days remains sta-ble (Figure 14 and Figure 15). It can also be noted that the number of days with precipitation ≥ 95th percentile (Figure 16) shows a trend that appears to be in-creasing, whereas the number of days with precipitation ≥ 99th and ≥99.5th percentile (Figure 17 and Figure 18) show a relatively stable trend.
Figure 5. Annual rainfall variation analyzed by the Pettitt test.
Figure 6. Trend in the maximum number of consecutive rainy days in Cotonou from 1953 to 2013.
DOI: 10.4236/gep.2021.93016 268 Journal of Geoscience and Environment Protection Figure 7. Evolution of the trend in the number of days with rainfall ≥ 10 mm in Cotonou from 1953 to 2013.
Figure 8. Evolution of the trend in the number of days with rainfall ≥ 20 mm in Cotonou from 1953 to 2013.
Figure 9. Evolution of the trend in the number of days with rainfall ≥ 25 mm in Cotonou from 1953 to 2013.
DOI: 10.4236/gep.2021.93016 269 Journal of Geoscience and Environment Protection Figure 11. Trend in maximum rainfall over 5 consecutive days in Cotonou from 1953 to 2013.
Figure 12. Evolution of the trend in the average rainfall per rainy day in Cotonou from 1953 to 2013.
Figure 13. Trend in the maximum number of consecutive dry days in Cotonou from 1953 to 2013.
DOI: 10.4236/gep.2021.93016 270 Journal of Geoscience and Environment Protection Figure 15. Evolution of the trend in the number of rainy days in Cotonou from 1953 to 2013.
Figure 16. Evolution of the trend in the number of days with rainfall ≥ 95th percentile in Cotonou from 1953 to 2013.
Figure 17. Evolution of the trend in the number of days with rainfall ≥ 99th percentile in Cotonou from 1953 to 2013.
Figure 18. Evolution of the trend in the number of days with rainfall ≥ 99.5th percentile in Cotonou from 1953 to 2013.
DOI: 10.4236/gep.2021.93016 271 Journal of Geoscience and Environment Protection
6) Study of extreme rainfall events in Cotonou and its relation to flooding Figure 19 shows that the rainfall corresponding to the return periods of 6, 10, 30 and 100 years are 140.8, 155.9, 187.2 and 220.7 mm respectively.
Figure 20 displays that the rainfall corresponding to the return periods of 6, 10, 30 and 100 years are 150.0 mm, 167.3 mm, 203.1 mm and 241.6 mm respec-tively.
We note that the rainfall corresponding to the return periods of 6, 10, 30 and 100 years are 143.2 mm, 159.3 mm, 192.5 mm and 228.2 mm respectively (Figure 21).
Figure 19. Return period of maximum daily rainfall in Cotonou from 1953 to 2013.
Figure 20. Return period of maximum daily rainfall in Cotonou from 1953 to 198.
DOI: 10.4236/gep.2021.93016 272 Journal of Geoscience and Environment Protection
Figure 22 shows that the rainfall corresponding to the return periods of 6, 10, 30 and 100 years are 136.2 mm, 151.1 mm, 181.9 mm and 214.9 mm respective-ly.
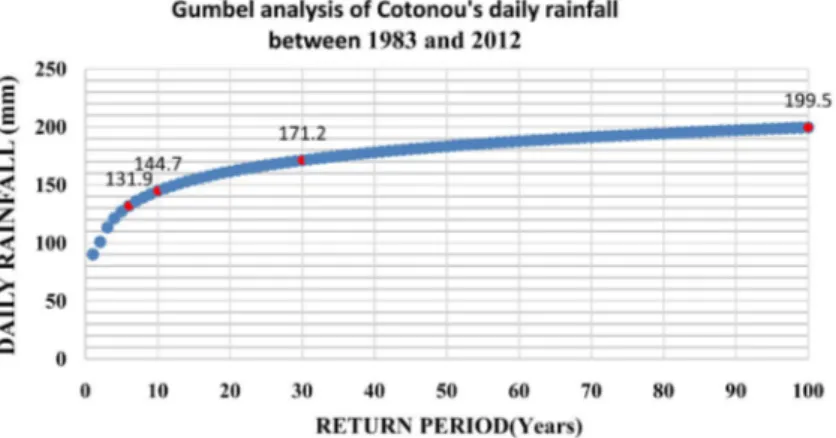
The rainfalls corresponding to the return periods of 6, 10, 30 and 100 years are 131.9 mm, 144.7 mm, 171.2 mm and 199.5 mm respectively (Figure 23).
Figure 24 shows us that 10 abnormal rainfall events (greater than or equal to the 140.8 mm threshold) were recorded over the period 1953-2013. Taking into account the last thirty years between 1983 and 2013, only two abnormal rainfall events were recorded, none of which occurred in the last ten years (2004-2013).
Figure 22. Return period of maximum daily rainfall in Cotonou from 1973 to 2002.
Figure 23. Return period of maximum daily rainfall in Cotonou from 1983 to 2012.
Figure 24. Distribution of rainfall above the 6-year return period threshold value (140.8 mm).
DOI: 10.4236/gep.2021.93016 273 Journal of Geoscience and Environment Protection
7) Trends in the frequency of annual maximum rainfall in 24, 48 and 72 hours in Cotonou
The analysis of Figure 25 allows us to say that the maximum annual rainfall in 24 h, 48 h and 72 h is mainly recorded in the month of June. These heavy rainfalls concentrated in time are infrequent (<5%) from August to March, or even non-existent during the months of November and December, which cor-respond to the dry season.
8) Analysis of the relationship between the flooding of the Ouémé River in Bonou and the floods in Cotonou
Figure 26 shows that since the calculated p-value is above the significance level threshold alpha = 0.05. We cannot reject the null hypothesis HO. The risk of rejecting HO when it is true is 5.32%.Since we have a p-value between 5 and 20%, we can say that the break is not very significant (Ago et al., 2005). Thus we can deduce that the flow series is not perfectly homogeneous.
p-value (bilateral) = 0.053. HO: The data is homogeneous.
Ha: There is a date from which there is a change in the data.
9) Analysis of the variation in the maximum coastline at Bonou and the number of overflow days of Ouémé at Bonou
Figure 25. Changes in the frequency of annual maximum rainfall in 24, 48 and 72 hours in Cotonou between 1953 and 2013.
DOI: 10.4236/gep.2021.93016 274 Journal of Geoscience and Environment Protection
After analysing Figure 27, it can be seen that when the hydrometric scale reaches 8 m, the river overflows at Bonou. On the graph, Ouémé did not over-flow at Bonou in 30% of cases, with a minimum observed in the 1990s (10%) and a maximum in the driest decades of the 1970s and 1980s (50%). For the rest of the years in the period 1951-2010, the river overflowed (42 years out of 60%, or 70%). It should be noted that the hightest number of days of overflow was 111 days and has been recorded in 1963 and the maximum peak observed at Bonou is 10.23 m recorded in 2010.
10) Correlation between the peak high water level at Bonou and the number of days of overtopping
Analysis of Figure 28 shows a positive correlation between flood heights and the number of days of overflow of Ouémé River (R2 = 0.70).
11) Correlation between the overflow of Nokoué Lake and that of Ouémé at Bonou
Figure 29 shows that the overflow of Ouémé coincides with the overflow of Nokoué Lake. This allows us to understand the influence that Ouémé at Bonou could have on Nokoué Lake in Cotonou.
Figure 27. Change in maximum instantaneous rankings in Bonou as a function of the number of overflow days from 1951 to 2010.
Figure 28. Correlation between flood heights and the number of overflow days of Ouémé at Bonou.
DOI: 10.4236/gep.2021.93016 275 Journal of Geoscience and Environment Protection Figure 29. Evolution of the overflows of Nokoué Lake and Ouémé at Bonou between 2001 and 2010.
The analysis of Figure 30 shows that there is a good positive correlation be-tween the overflow of Ouémé at Bonou and the overflow of Nokoué Lake, con-firming the influence of the overflow of Ouémé at Bonou on Nokoué Lake in Cotonou.
12) Analysis of the evolution of rainfall and water level in Nokoué Lake Analysis of Figure 31 allows us to say that rainfall reaches a main peak in June and a secondary peak in October, corresponding respectively to the big and small rainy seasons in Cotonou. The curve for Nokoué Lake shows a low water period from December to July and a strong peak in October as well. It should be noted that the lake is still in low water level and does not peak in June, when the rainy season reaches its peak in Cotonou, but rises gradually to reach the big peak in October.
13) Analysis of the evolution of the flow at Bonou and the water level of Nokoué Lake
Figure 32 display that we have two curves that have a similar evolution. The flow of Ouémé at Bonou reaches a peak in September while the curve of the wa-ter level in Nokoué Lake reaches its maximum in October. It can therefore be deduced that the flooding of Ouémé River at Bonou precedes that of Nokoué Lake and that only the flow of Ouémé River controls the level of Lake Nokoué.
4. Discussion
A break in the series of temperature data recorded in Cotonou over the period 1953 to 2013 was observed in 1987, splitting two homogeneous periods: one tween 1953 and 1986 (27.1˚C) and the other relatively warmer by +0.7˚C be-tween 1987 and 2013 (27.8˚C). This recent increase in temperature is global (IPCC, 2013) and is observed in the same order of magnitude elsewhere in West Africa. Cotonou is therefore definitely affected by global warming.
Moreover, the study of rainfall in Cotonou shows us that there is no break, and therefore no obvious change over the period 1953 to 2013. We carried out an analysis of the rainfall data by calculating 13 rainfall indices. None of these indices shows a statistically significant trend. Except for the index of the maxi-mum number of consecutive rainy days (CWD) which is close (p-value = 0.084)
DOI: 10.4236/gep.2021.93016 276 Journal of Geoscience and Environment Protection Figure 30. Correlation between the overflow of Nokoué Lake and Ouémé at Bonou be-tween 2001 and 2010.
Figure 31. Evolution of annual rainfall and water level in Lake Nokoué between 2001 and 2010.
Figure 32. Evolution of the average monthly flow of Ouémé at Bonou and the water level in Nokoué Lake between 2001 and 2010.
with a decreasing trend. The numbers of days with rainfall ≥ 10 mm, ≥20 mm and ≥25 mm (Rx10, Rx20 and Rx25), the daily maximum rainfall and the 5 con-secutive days (Rx1 and Rx5) show a relatively decreasing trend. The 99th and 99.5th percentiles for extreme and very extreme rainfall events are stable. When it is known that the frequency of flood risk is increasing and that all these rain-fall indices have shown a relatively stable or decreasing trend, it can be deduced that climate change does not have too much influence on flooding in Cotonou.
The graphs analysis characterising the return periods of abnormal (6 years), very abnormal (10 years), exceptional (30 years) and very exceptional (100 years) rainfall over the periods 1953-2013, 1953-1982, 1963-1992, 1973-2002 and
DOI: 10.4236/gep.2021.93016 277 Journal of Geoscience and Environment Protection
1983-2012 enabled us to understand that the different thresholds of torrential rainfall decrease over time and therefore, a priori, that extreme rainfall decreas-es. Taking the last 30 years over the period 1953 to 2013, only two abnormal rains (1997 and 2003) have been recorded and none in the last ten years. How-ever, we found that floods are becoming more and more frequent in the study area. It is true that heavy rains are still observed today, but both their frequency and their return period are less important now than in the past. Nevertheless, while it is plausible from this analysis that the floods are not caused by the ex-treme daily rains recorded in Cotonou, it can be deduced that the floods in the study zone are caused by the accumulation of low intensity rains. However, it should be noted that Cotonou has experienced non-abnormal rainfall, which has nevertheless caused flooding in the study zone. The city experienced flooding in June 2007 and the maximum rainfall recorded during the month was 95.3 mm on 28 June 2007. Even if we take the cumulative rainfall for five consecutive days, i.e. from 24 to 28 June 2007, we obtain a rainfall of 129.1 mm, which cor-responds to a return period of 4 years, and is therefore quite normal. Then let us also take the example of the recent flooding in Cotonou on 2 June 2015. The en-tire city and its surroundings were flooded, making the roads impassable. The maximum rainfall recorded that day was 118.4 mm (http://www.ogimet.com/), which is quite normal if we refer to the return period calculated over the period 1983-2012, the threshold of which was 131.9 mm. This rain corresponds to a re-turn period of 4 years. The Beninese press in its entirety has relayed this flood-ing. As an example, the daily newspaper “24 h au Bénin” of June 3, 2015, states the following: “Would nature be against the current municipal council of Co-tonou? There are many reasons to answer in the affirmative. Indeed, the floods that are often decried in Cotonou have resumed ... Almost all the streets of Co-tonou were under water. The neighbourhoods of Akpakpa, Zogbo, Agla, Gbégamey and Mènontin suffered the fury of the waters. It took almost five (05) hours of rain to make Cotonou, the beloved but also hated city, unliveable for its inhabitants... Many point an accusing finger at those in charge of Cotonou’s town hall. For them, the city’s sanitation policy is a bitter failure ... In any case, water has driven many citizens from their dormitories”. However, the rain rec-orded in Cotonou on 02 June 2015 in 6 hours (00 h to 6 h) and 12 hours (00 h to 12 h) was respectively 35 mm and 105 mm (http://www.ogimet.com/). From then on, it is obvious that rain that is not abnormal creates floods in the study area. These low rainfall events associated with the nature of Cotonou’s soil, which has a sub-surface water table, can lead to flooding. In fact, the intensity of extreme rainfall is nowadays decreasing, but the frequency of flooding is in-creasing.
The various analyses and correlations that have been carried out with the flows of Ouémé River at Bonou, the shoreline of Nokoué Lake and the rainfall in Cotonou have enabled us to understand that the Ouémé River has a strong in-fluence on the rise in the level of Nokoué Lake. And since we know that the Bonou station receives all the water from the large Ouémé watershed, we can
DOI: 10.4236/gep.2021.93016 278 Journal of Geoscience and Environment Protection
expect a strong flow of river water at the Bonou station that directly influences the lake’s rise in level. This is confirmed by the variation curve of rainfall and the height of Nokoué Lake. Since Nokoué Lake reaches its maximum peak between September and October, when rainfall in Cotonou is lower, this corresponds to the great (and only) rainy season in the central and northern parts of the coun-try, from which Ouémé receives most of the water. Thus, the lake's flooding is strongly influenced by the waters of Ouémé at Bonou. In fact, if Nokoué Lake, which is the last receptacle of water from Ouémé, overflows, it will occupy the entire flood plain which is already occupied by populations. It should also be pointed out that the lake is increasingly filled by the acadja system (branches deposited in the lake to serve as spawning grounds for fish), which could accen-tuate the overflow of Nokoué Lake. Cledjo and Ogouwale (2006) have shown that “acadjas decompose and are deposited in the bottom of Nokoué Lake” They also pointed out that “the accumulation of water hyacinth piles, household waste and the decomposition of the acadjas contribute enormously to the silting of the lake”. Thus, it is clear that the depth of Nokoué Lake has decreased sharply in recent decades. The filling of the lake will have a strong influence on flooding since the lake will no longer be able to contain the water from Ouémé River that feeds it.
5. Conclusion
In view of the work above, the study of climate indices shows that none of the indices is statistically significant. In fact, it can be seen that the indices in general have shown a trend that is either stable or declining. Nevertheless, there is a slight upward trend in indices such as the number of dry days, the average rain-fall per rainy day and the 95th percentile characterising intense rainrain-fall. The study of extreme rainfall led to the conclusion that floods are not related to local extreme rainfall events. The analysis of Ouémé river flows in Bonou and the variation of the coast of Nokoué Lake coupled with the rainfall in Cotonou al-lowed us to understand that the flooding of Ouémé has a strong influence on the flooding of the lake and directly on the study area.
Conflicts of Interest
The authors declare no conflicts of interest regarding the publication of this paper.
References
Ago, E. E., Petit, F., & Ozer, P. (2005). Analyse des inondations en aval du barrage de Nangbeto sur le fleuve Mono (Togo et Bénin). Geo-Eco-Trop, 29, 1-14.
Akomagni, L. A. (2006). Monographie de la ville de Cotonou, Cabinet Afrique Conseil (47 p).
Cledjo, P. F. G. A., & Ogouwale, E. (2006). Climate, Anthropic Pressure, Environmental Impacts and Dynamics of the Biological Resources of Lake Nokoué Article (12 p). IPCC (2013). Climate Change 2013: Summary for Policymakers, Technical Summary and
DOI: 10.4236/gep.2021.93016 279 Journal of Geoscience and Environment Protection Frequently Asked Questions (203 p). Contribution of Working Group I to the Fifth Assessment Report of the Intergovernmental Panel on Climate Change.
Gumbel, E. J. (1958). Statistics of Extremes. New York: Columbia University Press. https://doi.org/10.7312/gumb92958
Laleye, P. (1995). Ecologie comparée de deux espèces de Chrysischtys, poissons siluriformes (Claroteidae) du complexe lagunaire lac Nokoué-lagune de Porto-Novo au Bénin (152 p. + Appendices). PhD Thesis. Belgium: University of Liège.
Ozer, P. (2008). Introduction aux risques naturels, Cours GRN 2007-2008 (59 p). Ozer, P., & Sene, S. (2002). Evolution pluviométrique et relation inondations-events
pluviux au Sénégal. Bulletin de la société géographique de Liège, 42, 27-43.
Pettitt, A. N. (1979). A Non-Parametric Approach to the Change-Point Problem. Applied Statistics, 28, 126-135. https://doi.org/10.2307/2346729
DARA (2013). Risk Reduction Index (RRI) in West Africa Analysis of the Conditions and Capacities for Disaster Risk Reduction in Cape Verde, Gambia, Ghana, Guinea, Niger, and Senegal (223 p). DARA, Madrid, Spain.
IPCC (2012). Managing the Risks of Extreme Events and Disasters to Advance Climate Change Adaptation (582 p). In C. B. Field, V. Barros, T. F. Stocker, D. Qin, D. J. Dok-ken, K. L. Ebi, M. D. Mastrandrea, K. J. Mach, G. K. Plattner, S. K. Allen, M. Tignor, & P. M. Midgley (Eds.), A Special Report of Working Groups I and II of the Intergo-vernmental Panel on Climate Change. Cambridge, UK, and New York, NY: Cambridge University Press.
UNEP (2011). Sécurité des moyens d’existence. Changements climatiques, migrations et conflits au Sahel (108 p). Genève, Suisse: Programme des Nations Unies pour l’Environnement.
Ferris, E., & Stark, C. (2012). Internal Displacement in West Africa: A Snapshot (23 p). Washington DC, USA: The Brookings Institute.