COMMUNAUTÉ FRANÇAISE DE BELGIQUE ACADÉMIE UNIVERSITAIRE WALLONIE-EUROPE UNIVERSITÉ DE LIÈGE -GEMBLOUX AGRO-BIO TECH
BODY CONDITION SCORE AND MILK FATTY ACIDS AS INDICATORS OF
DAIRY CATTLE REPRODUCTIVE PERFORMANCES
CATHERINE BASTIN
Essai présenté en vue de l’obtention du grade
de docteur en sciences agronomiques et ingénierie biologique
Promoteur : Nicolas Gengler 2013
Copyright
Aux termes de la loi belge du 30 juin 1994, sur le droit d’auteur et les droits voisins, seul l’auteur a le droit de reproduire partiellement ou complètement cet ouvrage de quelque façon et forme que ce soit ou d’en autoriser la reproduction partielle ou complète de quelque manière et sous quelque forme que ce soit. Toute photocopie ou reproduction sous autre forme est donc faite en violation de la dite loi et des modifications ultérieures.
Catherine BASTIN. (2013). Body condition score and milk fatty acids as indicators of dairy cattle reproductive performances. (PhD Dissertation in English). Gembloux, Belgium, Gembloux Agro-Bio Tech, University of Liège, 120p., 23 tabl., 21 fig.
Abstract
Improving cow fertility by means of genetic selection has become increasingly important over the last years in order to overcome the decline in dairy cow fertility that has taken place over the past decades. However, fertility traits are difficult to measure and have low heritabilities. Consequently, indicator traits are of interest for breeding value estimation for fertility especially if these traits are easier to measure, have higher heritabilities and are well correlated with fertility. Therefore, the objective of this thesis was to investigate the opportunity of using either fatty acid contents (FA) in milk predicted by mid-infrared spectrometry or body condition score (BCS; i.e., a subjective measure of the amount of metabolizable energy stored in a live animal) as indicator traits of female fertility. Research conducted on BCS and fertility records from Canadian Ayrshire and Holstein cows indicated that BCS was heritable and showed a low to moderate favorable genetic correlation with fertility suggesting that higher BCS would be related to better fertility. Also, based on results obtained on Walloon data, selection for higher nadir BCS was suggested as useful to change BCS curve over the lactation and improve fertility. Furthermore, using records from Walloon Holstein cows, FA were demonstrated to be moderately heritable. Genetic correlations among FA and fertility were low to moderate and changed over the lactation. Overall, the pattern of genetic correlations of fertility with BCS and FA substantiated the known relationship between energy balance status and fertility. Body fat mobilization in early lactation induces BCS loss. Also, the release of long-chain FA in milk from the body fat mobilization inhibits de novo FA synthesis in the mammary gland, leading to a decrease of short- and medium- chain FA. To conclude, this research has shown that traits based on BCS and milk FA profile fulfill criteria to be considered as indicator traits to improve indirectly fertility of dairy cows.
Catherine BASTIN. (2013). Utilisation de la note d’embonpoint et de la composition en acides gras du lait en tant qu’indicateurs des performances de reproduction chez la vache laitière. (Thèse de doctorat en anglais). Gembloux, Belgique, Gembloux Agro-Bio Tech, Université de Liège, 120p., 23 tabl., 21 fig.
Résumé
Au cours des dernières années, la sélection génétique est devenue un outil incontournable pour améliorer la fertilité des vaches laitières dans le but ultime de contrôler la détérioration des performances de reproduction qui a été observée chez la vache laitière durant les dernières décennies. Cependant, la fertilité est un caractère difficile à mesurer et faiblement héritable. C’est pourquoi, des caractères indicateurs peuvent être utilisés pour l’estimation des valeurs d’élevage pour la fertilité. De tels caractères indicateurs sont d’autant plus intéressants s’ils sont facilement mesurables, plus héritables que la fertilité et bien corrélés à celle-ci. L’objectif de cette thèse était donc d’étudier la possibilité d’utiliser soit les taux d’acides gras (AG) dans le lait prédits par la spectrométrie en moyen infrarouge soit la note d’embonpoint (BCS; à savoir, une mesure subjective de la quantité d’énergie métabolisable chez un animal vivant) comme caractères indicateurs de la fertilité. Les recherches menées sur les données BCS et fertilité provenant de vaches Holstein et Ayrshire au Canada ont indiqué que le BCS est héritable et que la corrélation génétique entre le BCS et la fertilité est faible à modérée et suggère qu’un BCS plus élevé est associé à une meilleure fertilité. De plus, sur base de résultats obtenus sur les données wallonnes, il a été démontré que la sélection pour une hausse du minimum de la courbe de BCS au cours de la lactation permettrait d’améliorer la fertilité. Par ailleurs, grâce à une étude menée sur des données provenant de vaches Holstein wallonnes, il a été établi que les AG sont modérément héritables. Les corrélations génétiques entre les AG et la fertilité étaient faibles à modérées et variaient au cours de la lactation. L’ensemble des corrélations génétiques de la fertilité avec le BCS et les AG confirment l’association entre la balance énergétique et la fertilité. En effet, la mobilisation des réserves corporelles en début de lactation induit une perte de BCS. De plus, la libération dans le lait d’AG à longues chaines provenant des réserves corporelles inhibe la synthèse de novo dans la glande mammaire provoquant une diminution du taux en AG à courtes et moyennes chaines. Pour conclure, ces recherches ont démontré que des caractères basés sur le BCS et le profil en AG du lait répondent à tous les critères pour être considérés comme des caractères indicateurs permettant une amélioration indirecte de la fertilité des vaches laitières.
Acknowledgments
Over these last 6 years, I have learned a lot and I owe this to many people. This work would not have been achieved without the help, the support, the knowledge and the advices of a great number of people to whom I would like to express here my sincerest gratitude.
First, I would like to acknowledge the supervisor of this thesis, Pr. Nicolas Gengler, for his support and guidance through this work. Thank you for offering me the opportunity to train, to collaborate with many people, to travel around the world and, after all, to learn a lot.
I would like to extend my sincerest gratitude to all my jury members: Pr. Frédéric Francis (President of the jury, Gembloux Agro-Bio Tech, University of Liège), Filippo Miglior (Canadian Dairy Network and University of Guelph, Canada), Carlo Bertozzi (Walloon Breeding Association, Belgium), Joseph Flaba (Gembloux Agro-Bio Tech, University of Liège and Service Public of Wallonia, SPW-DGARNE), and Hélène Soyeurt, Pr. André Théwis, and Pr. Yves Beckers from Gembloux Agro-Bio Tech, University of Liège. I am very grateful to Filippo Miglior, reviewer of this manuscript. Thank you for your kindliness. Thank you for encouraging me all over these years; I am not sure I would have made it to this point without your support. Thank you for organizing my scientific stay in Guelph; it has been an extremely enriching experience. I also would like to acknowledge Hélène Soyeurt for her contribution to this work, especially in the fatty acids research. I wish to thank Pr. Yves Beckers, reviewer of this manuscript, for his helpful comments. I am also grateful to Pr. Rodolphe Palm as a member of my thesis committee.
I wish to thank colleagues throughout the quantitative genetics community for helping me through the various challenges experienced during this thesis. Special thanks to:
Donagh Berry (Teagasc, Moorepark, Ireland) for his contribution either as a reviewer or as a co-author of most of the papers in this thesis. Thank you so much for your valuable and very helpful comments;
all the co-authors of the paper presented in this thesis. In addition to the people that have been acknowledged above, I am very grateful to Alain Gillon (Walloon Breeding Association) for his appreciated help in the research and analyses conducted throughout this work and to Sarah Loker (Livestock Improvement Corporation, New Zealand) for her contribution to many papers of this thesis. I also would like to acknowledge Xavier Massart (Walloon Breeding Association), Sylvie Vanderick (Gembloux Agro-Bio Tech, University of Liège) and Asheber Sewalem (Canadian Dairy Network);
Jérémie Vandenplas (Gembloux Agro-Bio Tech, University of Liège) for his contribution to the last chapter of this thesis involving the selection index theory. Many thanks for your time and your invaluable help.
Jarmila Johnston (Canadian Dairy Network) and Pr. Larry Schaeffer (University of Guelph, Canada) for their helpful comments during my stay at University of Guelph. Also, I would like to acknowledge the different partners of the research we are conducting for Walloon dairy farmers: the Walloon Breeding Association, the Comité du Lait de Battice and the
Acknowledgments
Walloon Agricultural Research Center. I am also grateful to Valacta (Québec, Canada) for providing BCS data for the research conducted in Chapters 3 and 4.
Furthermore, I acknowledge the financial support:
of the Public Service of Wallonia (Service Public de Wallonie - Direction Générale Opérationnelle de l’Agriculture, des Ressources naturelles et de l’Environnement; previously Ministère de la Région Wallonne - Direction Générale de l’Agriculture) through the OptiVal and OptiVal+ projects,
of the National Fund for Scientific Research (FNRS, Brussels, Belgium), and Wallonie-Bruxelles International (CGRI-DRI, WBI) through grants provided for scientific stay at University of Guelph,
from the European Commission, Directorate-General for Agriculture and Rural Development (Grand Agreement 211708) and from the Commission of the European Communities (FP7, KBBE-2007-1) through the RobustMilk project.
Finally, I am infinitely grateful to the people who took the time to read and correct the various drafts of the chapters from this thesis: Frédéric Colinet, Marie-Laure Vanrobays, Pierre Faux, Héloïse Bastiaanse, Christopher Marcq, Alain Gillon, Marie Dufrasne and Bernd Buske. Also, many thanks to Geneviève Jean for her advised help in the editing of the final document.
A ma famille, à mes chers amis et collègues …
Parce que les remerciements, c’est, comme beaucoup d’entre nous, ce que je préfère lire dans une thèse. Parce que si cette partie ne fait pas au moins 2 pages et ne fait pas référence à quelques privates jokes, c’est beaucoup moins drôle. Parce que, pour la plupart d’entre vous, c’est sans doute la première chose que vous lirez dans ce travail. Parce que, pour la majorité d’entre vous, c’est sans doute la seule chose que vous lirez dans ce travail. Parce que, si vous n’avez pas encore trouvé votre nom dans la première partie des remerciements, vous le trouverez sans doute ici. Parce que finalement, cette thèse c’est un peu l’aboutissement du travail de ces dernières années et que d’une manière ou d’une autre, par votre amitié, votre bienveillance, votre présence ou vos encouragements, vous avez contribué à la réalisation de ce travail. Merci.
A tous les collègues, stagiaires et étudiants qui sont passés ou restés pour quelques semaines, quelques mois ou plusieurs années. A tous ceux qui, au final, ont joyeusement contribué à la surpopulation des bureaux! Aux gens d’en bas et en particulier Geneviève. Merci pour ta disponibilité et ton amitié. A ‘mes’ étudiants et stagiaires: Afef, Lucie et Bruno, j’ai beaucoup appris avec vous. A l’équipe des généticiens. Fred, merci pour tes conseils avisés, ta bienveillance et ton amitié, tout cela m’a été très précieux au cours de ces années et plus particulièrement au cours de ces derniers mois. Alain, tu resteras un des meilleurs office mates ever, merci pour ta zénitude à toutes épreuves. Pas d’offense, Marie et Jérémie, vous êtes aussi de supers office mates! Pierre, nous ferons le bilan de notre pari le jour de la défense publique, mais j’espère bien avoir gagné sur la plate couture de la pointe de l’épée! Catherine, Eloah et Maïté, votre passage en zootechnie a finalement été bref mais si on me proposait à nouveau une expérience professionnelle (ou un voyage à Athens) avec vous, ce serait avec grand plaisir. Il y a aussi l’OptiMIR team : Hana, Aurélie, Laura et Amaury et puis ceux qui ont été brièvement mes office mates à l’Athéna: Thibault, Gil et Valérie W. ainsi que les expatriés du Luxembourg (Valérie A.), des stats (Hélène) ou du bureau d’en bas (Hedi). Sans oublier: Marie-Laure, Sylvie, Purna, Elisabeth, Coraline et Bernd. Merci à vous tous pour les bons moments passés à Gembloux mais aussi à Southport, San Antonio, Dublin, Scarborough, Athens, Niagara Falls, Montréal, Riga, Liepzig, Belfast (If we ever meet again), New Orleans, Wageningen, Stavanger, Phoenix, Bratislava et Indianapolis! Waw! Que de voyages, que de souvenirs, que de soirées mémorables avec vous ! Merci les amis ! Ces années, ça a été du travail et du stress aussi, des réunions à rallonges, des GT weekends au mess, des after au Poco Loco et un nombre incalculable de rapports, de PV et de power-points ! Mais tout cela aurait été beaucoup moins drôle sans vous. Genetics is magic !
Il me tient finalement à cœur d’encourager tous les doctorants en plus ou moins début ou en plus ou moins fin de thèse. S’il est certain qu’une fin de thèse n’est jamais tout à fait sereine, vous apprendrez que lorsqu’on sort l’expression magique ‘Je suis en fin de thèse’, ça vous attire toute la compassion du monde, ou du moins toute la compassion des gens qui sont passés par là. Bonne chance les amis!
A ma famille, à mes chers amis et collègues …
A mes chers co-kotteurs, les p’tis, Jérôme et Amaury. A mes colocs Lorraine et Gino. Merci pour tous ces bons moments passés ensemble, merci d’avoir été des oreilles attentives et bienveillantes. A tous les amis de l’aventure gembloutoise (je n’oserais vous citer tous ici). A mes précieux amis, Virginie, Pierre, Noëlle, Sylvie, Christopher et Ellen. A ma best friend ever ever, Héloïse. Parce que vous êtes là quand j’ai besoin d’une oreille attentive ou quand j’ai besoin d’encouragements. Parce que vous me rappelez ce qui est réellement important quand il le faut. Parce que même si vous êtes loin (la Nouvelle-Zélande, le Gabon ou Malmédy quand même), vous êtes là. Parce que notre amitié a maintenant plus de 10 ans et que je me souviens comment chacune d’entre elles a commencé. Parce que si on connait Du côté de chez Swann, on connait tout de la chanson française. Parce que je n’en finirais pas de citer toutes les anecdotes et les souvenirs qui nous lient. Parce que j’ai partagé des moments rares avec vous. Merci.
A ma famille bien sûr. Merci pour votre soutien et vos encouragements. A mes parents qui m’ont appris bien des choses sur l’agronomie bien avant que je ne fréquente la Faculté de Gembloux. Merci de m’avoir appris la persévérance et le goût du travail bien fait. A Coralie, mon expert ès gastronomie et Luc, mon expert IT. Merci d’être toujours là pour moi. A Stéphanie, Vincent, Anne-Françoise, David, Sylvain et Alexandre.
A ceux qui nous ont quittés, aussi. A la veille de décrocher ce nouveau diplôme, j’ai une pensée pour mon grand-père qui, il y a bien longtemps, me disait que je deviendrai docteur, tout comme sa grand-tante dont je suis l’homonyme. Eh bien … nous y voilà!
Catherine Bastin Juillet 2013
Contents - Table des matières
List of abbreviations ... 1
Chapter 1. General introduction ... 3
Context ... 5
Aim of the thesis ... 6
Outline ... 6
Framework ... 7
References ... 7
Chapter 2. Genetics of BCS as an indicator of dairy cattle fertility: a review ... 9
Introduction ... 11
Body condition score: definition, target values, and factors of variation ... 11
Genetic variability of body condition score ... 13
Genetic correlations of body condition score with other traits ... 16
Genetic correlations with non-fertility traits ... 16
Genetic correlations with fertility ... 19
Body condition score as an indirect predictor of fertility ... 20
Alternatives to body condition score ... 21
Conclusions ... 22
Acknowledgements ... 22
References ... 22
Chapter 3. Genetic relationships between BCS and reproduction traits in Canadian Holstein and Ayrshire first-parity cows ... 27
Introduction ... 29
Materials and methods ... 29
Data editing ... 29
Models and genetic parameter estimation ... 33
Results and discussion ... 35
Data ... 35
Variance components, heritabilities, and genetic correlations among BCS ... 36
Genetic correlations between BCS and fertility traits ... 39
Genetic correlations between BCS and calving traits... 42
Use of BCS in selection programs ... 44
Conclusions ... 45
Acknowledgments ... 45
References ... 45
Chapter 4. Short communication: Genetic relationship between calving traits and body condition score before and after calving in Canadian Ayrshire second-parity cows ... 49
Acknowledgments ... 57
References ... 58
Chapter 5. Genetic evaluation for body condition score in the Walloon Region of Belgium ... 59
Introduction ... 61
Materials and methods ... 61
Data ... 61
(Co)variance estimation and model... 62
Contents – Table des matières
Results and Discussion ... 64
Heritabilities and genetic correlations ... 64
Comparison among EBV1 to EBV7 ... 65
Conclusion ... 66
Acknowledgments ... 67
References ... 67
Chapter 6. Phenotypic and genetic variability of production traits and milk fatty acid contents across days in milk for Walloon Holstein first-parity cows. ... 69
Introduction ... 71
Materials and methods ... 72
Data editing ... 72
Model and genetic parameter estimation ... 73
Results and discussion ... 75
Data... 75
Variation of FA contents in milk over DIM ... 75
Variances and heritabilities ... 77
Approximate genetic correlations among production traits and FA ... 79
Conclusions ... 84
Acknowledgments ... 85
References ... 85
Chapter 7. Genetic correlations of days open with production traits and contents in milk of major FA predicted by mid-infrared spectrometry ... 89
Introduction ... 91
Materials and methods ... 92
Data editing ... 92
Model ... 93
Genetic parameters ... 94
Results and discussion ... 95
Conclusions ... 99
Acknowledgments ... 99
References ... 100
Chapter 8. General discussion, conclusion and future prospects ... 103
About the selection for fertility ... 104
BCS and milk FA fulfill conditions to be considered as indicator traits for fertility ... 104
Accuracy in selection for fertility using BCS and milk FA as indicator traits ... 106
Including BCS and milk FA in breeding programs ... 108
Consequences on milk production traits... 108
Selection for BCS ... 109 Selection for FA ... 110 General conclusion ... 111 Implications ... 112 Future research ... 112 Summary ... 113 References ... 114 List of tables ... 117 List of figures ... 119
1
List of abbreviations
BCS Body condition score
CE Calving ease
CEd Direct calving ease CEm Maternal calving ease
CS Calf survival
CSd Direct calf survival CSm Maternal calf survival
CTFS Days between calving and first service
DIM Days in milk
DO Days open
EB Energy balance
EBV Estimated breeding value EBVd Daily estimated breeding value
FA Fatty acid
FSTC Days between first service and conception LCFA Long chain fatty acid
MCFA Medium chain fatty acid MUFA Monounsaturated fatty acid
NRR Non return rate at first insemination
PR Pregnancy rate
PUFA Polyunsaturated fatty acid
RPD Ratio of (standard error of) prediction to (standard) deviation R²cv Coefficient of determination of the cross-validation
SCFA Short chain fatty acid SCS Somatic cell count SFA Saturated fatty acid UFA Unsaturated fatty acid
5
Context
Dairy production systems that use cows selected, managed, and fed for high milk production levels have suffered decline in cow fertility over the past decades (e.g., Lucy, 2001; Walsh et al., 2011). A multitude of studies conducted on Holstein cows under various production systems documented decrease in conception success following insemination and deterioration in reproductive performance expressed as intervals. Decline in first-service conception rate has been addressed by Lucy (2001). Extension of interval from calving to conception, of interval from first to successful insemination, and of calving interval has been reported (e.g., González-Recio et al., 2004; VanRaden et al., 2004; Dillon et al., 2006; Liu et al., 2008). In the Walloon Region of Belgium, calving interval has increased from 396 days in 1994 to 417 days in 2008 (Laloux et al., 2009).
Optimal fertility is vital for profitable dairy production systems (De Vries, 2006; Inchaisri et al., 2010). In support of the objective of one calf per year per cow that is observed for instance in seasonal grass-based milk production systems, farmers aim for a 3-month interval from calving to conception. Besides, extended lactation practices may be considered as a way to manage high yielding dairy cows: milk production is prioritized, first service is postponed and calving interval is extended. In all circumstances, good fertility in dairy cows can be defined as the accomplishment of pregnancy at the desired time (Pryce et al., 2004); success of conception after first insemination should be addressed in all dairy production systems. In 2004, González-Recio et al. stated that an increase of one unit in the number of inseminations per service period would reduce profitability by 67.32 USD per year per cow.
Fertility is a multi-factorial trait and its deterioration has been caused by a network of genetic, physiological, environmental, and managerial factors (Walsh et al., 2011). Hence, improving dairy cow fertility through genetic selection has become increasingly important in recent years since it was established that declining fertility cannot be arrested solely by improved management (Veerkamp and Beerda, 2007). Most dairy cattle populations have, by now, routine genetic evaluation systems for female fertility (INTERBULL, 2012a) and such fertility traits have been nearly unanimously included in national breeding goals (Miglior et al., 2005). Furthermore, international genetic evaluations for female fertility are available since 2007 (INTERBULL, 2012b). Genetic evaluations for fertility traits may provide useful selection tools 1) to help farmers to monitor the fertility of their cows and 2) to assess and enhance the genetic trend of the population as a whole (Banos et al., 2004).
However, direct selection for female fertility, might be complicated by the following factors: 1) the difficulty in collecting large amounts of relevant direct fertility records, especially for unfertile animals (e.g., no calving interval records for animals that are unfertile), 2) the long time period required to validate some phenotypes (e.g., calving interval) and its subsequent effect on generation interval and thus genetic gain, and 3) the generally low heritability of most traditional fertility phenotypes (from 0.01 to 0.05; Veerkamp and Beerda, 2007). These factors contribute to low accuracy of estimated breeding values (i.e., genetic merit of animals), especially for cows and young bulls. Therefore, indicator traits could be very useful to supplement the prediction of genetic merit for female fertility as long as these traits are easier to measure, are recorded earlier in the cow’s lactation, are heritable, and are genetically correlated with fertility (Shook, 1989).
6
Because energy balance has been presented as one of the most important factors influencing fertility (Butler and Smith, 1989; Walsh et al., 2011), traits related to the extent and the duration of the postpartum negative energy balance are of great interest as indicator traits to enhance indirect genetic improvement of reproductive performances. Negative energy balance occurs for about 2 to 4 months following calving, when nutrient requirements for growth, activity, maintenance, and lactation exceed the ability of the cow to consume energy in the feed. In response to the energy deficit, cows mobilize tissue reserves. Several traits have been associated with energy balance state of dairy cows: body condition score (BCS), body weight (Coffey et al., 2001) and various metabolic and endocrine blood and milk traits such as levels of ketone bodies, non-esterified fatty acids (FA), milk fat:protein ratio and milk FA (de Vries and Veerkamp, 2000; Reist et al., 2002; Stoop et al., 2009).
Body condition score is a subjective measure of the amount of metabolizable energy stored in a live animal (Edmonson et al., 1989) and it has been widely accepted by scientists and producers as the most practical method for assessing changes in energy reserves in dairy cattle (Bewley and Schutz, 2008). Besides, milk FA profile is thought to be related to energy balance status of cows in early lactation (Stoop et al., 2009). At initiation of lactation, when cows are in negative energy balance, adipose FA are mobilized and incorporated in milk, causing an increase of C18 FA proportion in milk fat and a consequent inhibition of de novo synthesis of FA by the mammary gland (Palmquist et al., 1993). Therefore, BCS and milk FA appear as traits of great interest to improve indirectly reproductive performances of dairy cows.
Aim of the thesis
This thesis aimed to investigate the opportunity of using BCS and milk FA as indicator traits of female fertility. Towards this objective, the genetic variability of BCS and milk FA and their genetic correlations with reproductive performances were studied and a genetic evaluation for BCS in the Walloon Region of Belgium was developed.
Outline
This manuscript is a compilation of published scientific papers and is structured as follows. First, a literature review on the genetic variability of BCS and its genetic correlations with traits of economic importance is provided in Chapter 2. Genetic correlations among BCS and reproduction traits (both fertility and calving traits) were then estimated using records from Canadian Holstein and Ayrshire cows (Chapters 3 and 4). In Chapter 5, the development of a genetic evaluation for BCS in the Walloon Region of Belgium was investigated. Chapter 6 describes phenotypic and genetic variability of milk FA. Genetic correlations between fertility and FA were estimated in Chapter 7. Finally, Chapter 8 compiled results obtained through this work and explored the opportunity of using BCS and milk FA as indicator traits of female fertility in dairy cows. Also, a general conclusion and future prospects were drawn.
7
Framework
This thesis was initiated in the framework of the OptiVal and OptiVal+ projects financed by the Public Service of Wallonia (Service Public de Wallonie - Direction Générale Opérationnelle de l’Agriculture, des Ressources naturelles et de l’Environnement; previously Ministère de la Région Wallonne - Direction Générale de l’Agriculture) and jointly conducted by the Animal Science Unit of Gembloux Agro-Bio Tech, University of Liège (GxABT - ULg, Gembloux, Belgium; previously Faculté universitaire des Sciences Agronomiques de Gembloux) and the Research and Development department of the Walloon Breeding Association (AWE asbl, Ciney, Belgium). The objective of these projects was to develop management tools, based on performance recording data, to support dairy farmers in their daily decisions. Three directions were explored during the projects: fine-tuning feeding, monitoring changes in functional morphology, and fertility management. Moreover, the collaboration with the Canadian Dairy Network (CDN, Guelph, Canada) and the Center for the Genetic Improvement of Livestock at University of Guelph (CGIL, Guelph, Canada) allowed the work on Canadian data (from Valacta, Québec). This work was financed by the Public Service of Wallonia, the National Fund for Scientific Research (FNRS, Brussels, Belgium), and Wallonie-Bruxelles International (CGRI-DRI, WBI). Finally, this thesis also took advantages from beneficial interactions with the FP7 European project RobustMilk: “Innovative and practical breeding tools for improved dairy products from more robust dairy cattle”.
References
Banos, G., S. Brotherstone, R. Thompson, J.A. Woolliams, E. Wall, and M.P. Coffey. 2004. Calculation of multiple-trait sire reliability for traits included in a dairy cattle fertility index. Anim. Sci. 79:1-9.
Bewley, J.M. and M.M. Schutz. 2008. Review: An interdisciplinary review of body condition scoring for dairy cattle. The Prof. Anim. Sci. 24:507-529.
Butler, W.R., and R.D. Smith. 1989. Interrelationships between energy balance and postpartum reproductive function in dairy cattle. J. Dairy Sci. 72:767-783.
Coffey, M.P, G.C. Emmans, and S. Brotherstone. 2001. Genetic evaluation of dairy bulls for energy balance traits using random regression. Anim. Sci. 73:29-40.
de Vries, M.J., and R. F. Veerkamp. 2000. Energy balance of dairy cattle in relation to milk production variables and fertility. J. Dairy Sci. 83:62-69.
De Vries, A. 2006. Economic value of pregnancy in dairy cattle. J. Dairy Sci. 89:3876-3885. Dillon, P., D.P. Berry, R.D. Evans, F. Buckley, and B. Horan. 2006. Consequences of genetic
selection for increased milk production in European seasonal pasture based systems of milk production. Livest. Sci. 99:141-158.
Edmonson A.J., I.J. Lean, L.D. Weaver, T. Farver, and G. Webster. 1989. A body condition scoring chart for Holstein dairy cows. J. Dairy Sci., 72:68-78.
Inchaisri C., R. Jorristma, P.L.A.M. Vos, G.C. van der Weijden, and H. Hogeveen. 2010. Economic consequences of reproductive performance in dairy cattle. Theriogenology 74:835-846.
INTERBULL. 2012a. Description of National Genetic Evaluation Systems for dairy cattle traits as applied in different INTERBULL member countries. Accessed on November 23, 2012. http://www-interbull.slu.se/national_ges_info2/framesida-ges.htm.
INTERBULL. 2012b. INTERBULL Routine Genetic Evaluation for Female Fertility Traits. Accessed on November 23, 2012. http://www-interbull.slu.se/Female_fert/framesida-fert.htm.
8
González-Recio, O., M.A. Pérez-Cabal, and R. Alenda. 2004. Economic value of female fertility and its relationship with profit in Spanish dairy cattle. J. Dairy Sci. 87:3053-3061.
Laloux, L., C. Bastin, and L. Devroede. 2009. Un intervalle vêlage court: un objectif intéressant pour les hautes productrices? Wallonie Elevage 2:14-16.
Liu, Z., J. Jaitner, F. Reinhardt, E. Pasman, S. Rensing, and R. Reents. 2008. Genetic evaluation of fertility traits of dairy cattle using a multiple-trait animal model. J. Dairy Sci. 91:4333-4343.
Lucy, M.C. 2001. ADSA Foundation Scholar Award: Reproductive loss in high-producing dairy cattle: where will it end? J. Dairy Sci. 84:1277-1293.
Miglior, F., B.L. Muir, and B. J. Van Doormaal. 2005. Selection indices in Holstein cattle of various countries. J. Dairy Sci. 88:1255-1263.
Palmquist, D.L., A.D. Baulieu, and D.M. Barbano. 1993. Feed and animal factors influencing milk fat composition. J. Dairy Sci. 76:1753-1771.
Pryce, J.E., M.D. Royal, P.C. Garnsworthy, and I.L. Mao. 2004. Fertility in the high-producing dairy cow. Livest. Prod. Sci. 86:125-135.
Reist, M., D. Erdin, D. von Euw, K. Tschuemperlin, H. Leuenberger, Y. Chilliard, H.M. Hammon, C. Morel, C. Philipona, Y. Zbinden, N. Kuenzi, and J.W. Blum. 2002. Estimation of energy balance at the individual and herd level using blood and milk traits in high-yielding dairy cows. J. Dairy Sci. 85:3314-3327.
Shook. G.E. 1989. Selection for disease resistance. J. Dairy Sci. 72:1349-1362.
Stoop, W.M., H. Bovenhuis, J.M.L. Heck, and J.A.M. van Arendonk. 2009. Effect of lactation stage and energy status on milk fat composition of Holstein-Friesian cows. J. Dairy Sci. 92:1469-1478.
VanRaden, P.M., A.H. Sanders, M.E. Tooker, R.H. Miller, H.D. Norman, M.T. Kuhn, and G.R. Wiggans. 2004. Development of a national genetic evaluation for cow fertility. J. Dairy Sci. 87:2285-2292.
Veerkamp, R. F., and B. Beerda. 2007. Genetics and genomics to improve fertility in high producing dairy cows. Theriogenology 68S:S266-S273.
Walsh, S.H., E.J. Williams, and A.C.O. Evans. 2011. A review of the causes of poor fertility in high milk producing dairy cows. Anim. Reprod. Sci. 123:127-138.
Chapter 2. Genetics of BCS
as an indicator of dairy cattle fertility: a review
Outline
Body condition score is a subjective measure of the amount of metabolizable energy stored in a live animal. Over a range of studies, BCS has been proposed as a useful indicator trait for dairy cattle fertility. Therefore, the objective of this Chapter was to review the genetic parameters of BCS as well as its genetic association with other traits of economic importance, especially fertility. As a first step in the research strategy of this thesis, this Chapter also focuses on the genetic selection of BCS in order to indirectly improve reproductive performances of dairy cows.
From: Bastin, C., and N. Gengler. 2013. Genetics of BCS as an indicator of dairy cattle fertility: a review. Biotechnol. Agron. Soc. Environ. 17:65-76.
10
Abstract
Genetics of BCS as an indicator of dairy cattle fertility: a review
Body condition score (BCS) is a subjective measure of the amount of metabolizable energy stored in a live animal. Change in BCS of dairy cows is considered to be an indicator of the extent and the duration of postpartum negative energy balance. Although change in BCS over lactation is lowly heritable, heritability estimates of level of BCS range from 0.20 to 0.50. Also, BCS tends to be more heritable in mid-lactation indicating that genetic differences are more related to how well cows recover from the negative energy balance state. BCS measurements are generally highly correlated within and between lactations. Genetic correlations with BCS are unfavorable for milk, fat, and protein yield, suggesting that genetically superior producers tend to have lower BCS, especially during the lactation. Genetic correlations are generally moderate and favorable with fertility indicating that cows with higher levels of BCS would have a greater chance to conceive after insemination and fewer number of days when not pregnant. Because direct selection to improve fertility might be complicated by several factors, selection for higher levels of BCS, especially in mid-lactation, appears to be a good option to indirectly improve fertility in dairy cows.
Keywords: Dairy cows, body condition, energy balance, heritability, fertility, genetic correlation
Résumé
La note d’embonpoint chez la vache laitière: variabilité génétique et lien avec la fertilité (synthèse bibliographique)
La note d’embonpoint (BCS) est une mesure subjective de la quantité d’énergie métabolisable chez un animal vivant. Les changements de BCS donnent des indications quant à l’importance et la durée de la balance énergétique négative postpartum chez la vache laitière. Bien que la perte de BCS au cours de la lactation présente une faible héritabilité, l’héritabilité du BCS varie en moyenne entre 0,20 et 0,50. De plus, le BCS est plus héritable en milieu de lactation, ce qui indique que les différences génétiques sont davantage liées à la manière dont les vaches reviennent en balance énergétique positive. Les mesures de BCS sont hautement corrélées au sein et à travers les lactations. Les corrélations génétiques entre le BCS et les rendements en lait, matière grasse et protéines sont défavorables et suggèrent que les vaches qui sont génétiquement de hautes productrices ont tendance à avoir un BCS plus faible, et plus particulièrement au cours de la lactation. Les corrélations génétiques sont modérées et favorables entre le BCS et la fertilité et suggèrent que des vaches qui présentent un BCS plus élevé, d’une part, ont plus de chances de concevoir après l’insémination et d’autre part, présentent un nombre plus faible de jours où elles ne sont pas gestantes. Étant donné que la sélection directe pour la fertilité peut être compliquée par une série de facteurs, la sélection pour des niveaux plus élevés de BCS, et plus particulièrement en milieu de lactation, apparait comme une bonne option pour améliorer indirectement la fertilité des vaches laitières.
Mots-clés : Vache laitière, état corporel, bilan énergétique, héritabilité, fertilité, corrélation génétique
11
Introduction
In general, dairy cows experience a negative energy balance (EB) for about 2 to 4 months following calving when nutrient requirements for growth (especially in first-parity cows), activity, maintenance and lactation exceed the ability of the cow to consume energy in the feed. In response to the energy deficit, cows mobilize tissue reserves. During lactation, dry matter intake increases at a slower rate than milk production, exacerbating negative EB. About 2 to 4 months after calving, dry matter intake increases to a point where energy input is greater than energy output, resulting in a positive EB for the remainder of the lactation (Bewley et al., 2008).
Although negative EB in early lactation is a normal physiological state (i.e., all mammals are designed to convert body stores of energy to milk during lactation; Bewley et al., 2008), it is commonly assumed that duration and magnitude of negative EB both have an impact on reproductive performance of dairy cows. Butler et al. (1989) indicated that negative EB and rate of mobilization of body reserves in early lactation appear to be directly related to the interval from calving to first ovulation and to a lower conception rate. Also, de Vries et al. (2000) reported that a lower nadir of EB is correlated with a delay in the postpartum start of luteal activity. Furthermore, Friggens et al. (2007) provided evidence that body energy change is environmentally and genetically driven and suggested that genetic selection could affect EB profiles. Therefore, recording EB on a routine basis could enhance improvement of fertility and hence address one of the greatest challenges of the modern dairy industry, which is to overcome the decline in cow fertility that has taken place over the past five decades (Veerkamp et al., 2007). Direct measures of EB are primarily based on individual cow feed intake and milk output. However, measurement of individual feed intake is expensive and unfeasible in a commercial population. Therefore, indirect indicators of EB, such as body condition score (BCS) change, are commonly used. Body condition score is a subjective measure of the amount of metabolizable energy stored in a live animal (Edmonson et al., 1989) and it is recognized by animal scientists and producers as being a useful trait to customize feeding strategies and manage dairy cattle health and fertility.
After an overview of the definition and the interest in BCS, this paper will focus on the genetic variability of BCS in dairy cows. Furthermore, the genetic association of BCS with other traits of economic importance and especially reproductive performance will be examined. Finally, the selection of BCS in order to indirectly improve the fertility of dairy cows will be considered.
Body condition score: definition, target values, and factors of
variation
Body condition scoring has been widely accepted as the most practical method for assessing changes in energy reserves in dairy cattle (Bewley et al., 2008). This technique is accomplished by the visual or tactile observation (or both) of a cow by a trained professional (Edmonson et al., 1989; Roche et al., 2004). Body condition can be scored by dairy farmers, veterinarians, field staff, or classifiers. It can be recorded once or several times over the lactation. Although it is a subjectively measured trait that only assesses subcutaneous fat stores, previous studies have indicated that BCS could be accurate enough to assess the relative amount of body fat mobilization (Waltner et al., 1994; Bewley et al., 2008).
12
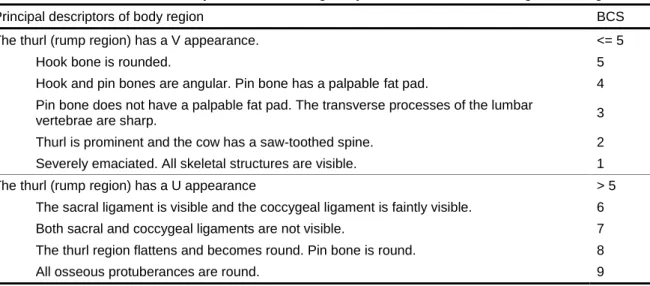
During the last 25 years, various BCS systems have been described and researched throughout the world (Bewley et al., 2008). The scale used to measure BCS differs between countries, but low values generally reflect emaciation and high values reflect obesity (Roche et al., 2009a). Edmonson et al. (1989) developed a 5-point chart system used in the United States describing changes in conformation with body condition change for eight body locations identified as important for predicting BCS. In the Walloon Region of Belgium, dairy cows are assigned a BCS based on a nine-point scale with unit increments as used for the linear scoring system. The decision chart (Table 1), adapted from the five-point scale described by Ferguson et al. (1994), is mainly based on the observation and the tactile appraisal of the thurl region, the pin and hip bones and the sacral and coccygeal ligaments with scoring of 1 (= emaciated cows) to 9 (= obese cows). Table 1. Decision chart for body condition scoring dairy cows in the Walloon Region of Belgium
Principal descriptors of body region BCS
The thurl (rump region) has a V appearance. <= 5
Hook bone is rounded. 5
Hook and pin bones are angular. Pin bone has a palpable fat pad. 4 Pin bone does not have a palpable fat pad. The transverse processes of the lumbar
vertebrae are sharp. 3
Thurl is prominent and the cow has a saw-toothed spine. 2
Severely emaciated. All skeletal structures are visible. 1
The thurl (rump region) has a U appearance > 5
The sacral ligament is visible and the coccygeal ligament is faintly visible. 6
Both sacral and coccygeal ligaments are not visible. 7
The thurl region flattens and becomes round. Pin bone is round. 8
All osseous protuberances are round. 9
Mao et al. (2004) suggested that the change in a cow’s BCS over time is determined by changes in intake, in utilization of energy intake for yield, growth and maintenance, and in body tissue deposition and mobilization. Typically, the intercalving profile of BCS is a mirror image of the milk lactation profile, declining to a nadir at 40 to 100 days after calving as milk production peaks and tissue reserves are mobilized to compensate for negative EB, before replenishing lost body reserves as the milk lactation profile declines (Roche et al., 2007b). However, the shape of this profile could be influenced by the system of production; New Zealand cows grazing fresh pasture exhibit a W-shaped BCS profile (Roche et al., 2007b), declining for a second time in mid-lactation when pasture quality and quantity decline, before increasing again in late mid-lactation (Roche et al., 2009b; Roche et al., 2009c).
An extensive review of the literature by Roche et al. (2009a) summarized the phenotypic association between BCS (at calving, nadir and changes during the lactation) and milk production or fertility traits. They indicated that the association between BCS and milk production and fertility traits is generally nonlinear. Health and reproductive disorders arise from having cows that are either too thin (especially in early lactation) or too fat (especially before calving). Although low BCS during lactation or excessive loss of body condition in early lactation often result in impaired health and reproductive performances (Pryce et al., 2001; Reksen et al., 2002; Roche et al., 2007a), it has been reported that greater BCS at calving exacerbates BCS lost postcalving and negative EB problems instead of overcoming them (Garnsworthy, 2006; Roche et al., 2007b). Body condition score could therefore be considered an intermediate optimum trait (Loker, 2011). The ideal BCS is the level of body fat that allows the cow to optimize milk
13 production while simultaneously minimizing metabolic and reproductive disorders (Bewley et al., 2008). The ideal BCS is highly dependent on lactation stage and on the production system in which cows are managed. Phenotypic target values for BCS as recommended by the Walloon Breeding Association (on a 9-point scale) are 4 to 6 between 0 and 45 days in milk (DIM), 4 to 5 between 46 and 300 DIM, and 5 to 6 after 300 DIM and during dry-off (Massart, 2011). Furthermore, an efficient BCS management strategy should also consider changes in BCS. Monitoring changes in body condition through a scoring system is probably of greater value than identifying absolute, snapshot measures of body condition (Bewley et al., 2008).
Body condition score profiles vary among cows and many herd- or cow-level factors contribute to this variation. Factors associated with feeding level or diet type are of primary importance. Berry et al. (2006) showed that cows on higher feeding levels mobilized less BCS in early lactation than cows on lower feeding levels. Roche et al. (2009a) indicated that stocking rate, level of concentrates, or diet type (grazed grass or total mixed ration) affect BCS. Among others, parity, age within parity, season of calving, year of calving, breed, and genetics are all cow-level factors that impact BCS profiles (Koenen et al., 2001; Pryce et al., 2001; Berry et al., 2006). Within lactation, loss in BCS tends to increase with increasing parity and first-parity cows are generally managed to calve in greater BCS than later-parity cows (Berry et al., 2006; Bewley et al., 2008). Also, Koenen et al. (2001) showed that BCS increased as calving age increased. Differences in BCS profile among breeds and a heterosis effect have also been reported (Koenen et al., 2001; Mao et al., 2004; Pryce et al., 2006). Finally, as BCS is a subjectively scored trait, the effect of BCS assessor is of importance (Veerkamp et al., 2002) and it is often considered a “nuisance factor” (Roche et al., 2009a) that has to be considered and corrected for.
Genetic variability of body condition score
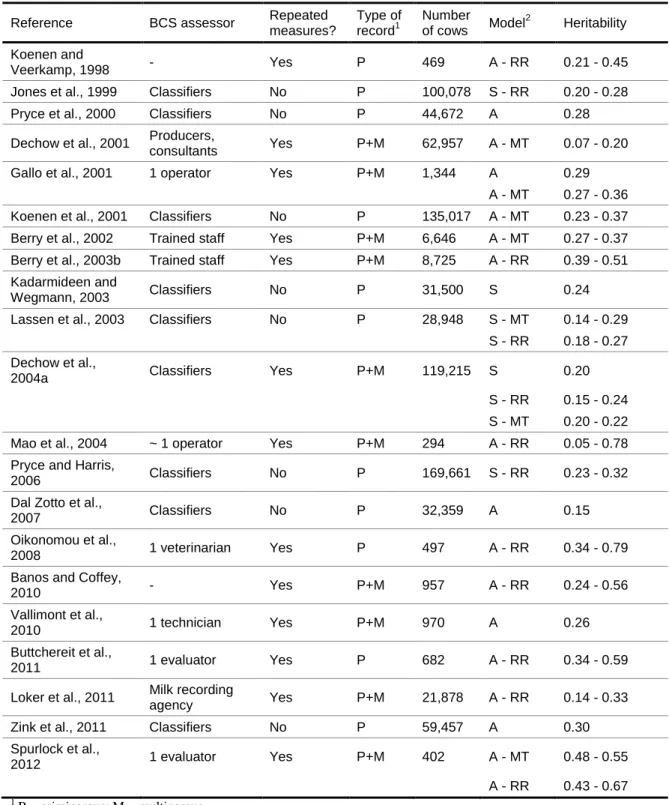
Several studies investigated the genetic variability in BCS traits and provided evidence that differences in BCS profiles among cows are partly genetically driven. Although it is not exhaustive, Table 2 provides an overview of the variety of studies that estimated genetic parameters for BCS. Estimates of heritability ranged from 0.05 to 0.79 but most of the studies reported heritabilities ranging from 0.20 to 0.50. Studies differ in the origin of data (field data or data from research herds), breed, number and stage of lactation being examined, definition of traits (e.g., scales used for scoring body condition), as well as the data edits, model used to estimate genetic parameters and heritability definition (i.e., daily vs. lactation).
Field data involve a large data set of BCS generally assessed by classifiers with one record per lactation while a data set from research herds generally includes several measurements of BCS by one assessor on a limited number of cows in a limited number of herds. Heritability estimates tend to be lower for field data (e.g., Lassen et al., 2003; Dal Zotto et al., 2007) than for research herd data (e.g., Oikonomou et al., 2008; Spurlock et al., 2012). This tendency could be attributed to the high variability among herds and BCS evaluators in field data while environmental conditions are more controlled in research herds. Furthermore, heritability estimates tend to be higher in studies in which BCS was assessed by a limited number of trained operators (Gallo et al., 2001; Berry et al., 2003a) than in studies in which BCS was assessed by producers or by a large number of evaluators (Dechow et al., 2001).
14
Table 2. Overview of heritability estimates for body condition score (BCS) from various studies
Reference BCS assessor Repeated
measures? Type of record1 Number of cows Model 2 Heritability Koenen and Veerkamp, 1998 - Yes P 469 A - RR 0.21 - 0.45
Jones et al., 1999 Classifiers No P 100,078 S - RR 0.20 - 0.28
Pryce et al., 2000 Classifiers No P 44,672 A 0.28
Dechow et al., 2001 Producers,
consultants Yes P+M 62,957 A - MT 0.07 - 0.20
Gallo et al., 2001 1 operator Yes P+M 1,344 A 0.29
A - MT 0.27 - 0.36
Koenen et al., 2001 Classifiers No P 135,017 A - MT 0.23 - 0.37
Berry et al., 2002 Trained staff Yes P+M 6,646 A - MT 0.27 - 0.37 Berry et al., 2003b Trained staff Yes P+M 8,725 A - RR 0.39 - 0.51 Kadarmideen and
Wegmann, 2003 Classifiers No P 31,500 S 0.24
Lassen et al., 2003 Classifiers No P 28,948 S - MT 0.14 - 0.29
S - RR 0.18 - 0.27 Dechow et al.,
2004a Classifiers Yes P+M 119,215 S 0.20
S - RR 0.15 - 0.24 S - MT 0.20 - 0.22
Mao et al., 2004 ~ 1 operator Yes P+M 294 A - RR 0.05 - 0.78
Pryce and Harris,
2006 Classifiers No P 169,661 S - RR 0.23 - 0.32
Dal Zotto et al.,
2007 Classifiers No P 32,359 A 0.15
Oikonomou et al.,
2008 1 veterinarian Yes P 497 A - RR 0.34 - 0.79
Banos and Coffey,
2010 - Yes P+M 957 A - RR 0.24 - 0.56
Vallimont et al.,
2010 1 technician Yes P+M 970 A 0.26
Buttchereit et al.,
2011 1 evaluator Yes P 682 A - RR 0.34 - 0.59
Loker et al., 2011 Milk recording
agency Yes P+M 21,878 A - RR 0.14 - 0.33
Zink et al., 2011 Classifiers No P 59,457 A 0.30
Spurlock et al., 2012 1 evaluator Yes P+M 402 A - MT 0.48 - 0.55 A - RR 0.43 - 0.67 1 P = primiparous; M = multiparous 2
A = animal; MT = multitrait (BCS taken at different periods of the lactation are considered different traits); RR = random regression; S = sire
Hence, Dechow et al. (2003) indicated that heritability for BCS increased from 0.14 to 0.19 after edits on BCS data to eliminate data with no BCS assessors or data scored inconsistently when compared with other BCS assessors’ data. These authors expected that the heritability estimate for BCS would increase as BCS assessors became more accustomed to evaluating cows for this trait. Dechow et al. (2004b) estimated a genetic correlation of 0.85 (with a standard error not greater than 0.06) between classifier recorded BCS and producer and herd-consultant recorded BCS, indicating that these traits are very similar but not exactly the same. Moreover, to alleviate
15 differences in the range of scoring by different BCS assessors, some studies suggested preadjusting BCS records using the phenotypic standard deviation within classifier (Jones et al., 1999; Pryce et al., 2000; Koenen et al., 2001).
Although BCS can be considered the same trait over the lactation with a constant genetic variance (Pryce et al., 2000; Kadarmideen et al., 2003; Dal Zotto et al., 2007; Zink et al., 2011), most studies hypothesized that the variation in BCS might be controlled by different genes across DIM. In such studies, genetic parameters were estimated using either multitrait models (BCS measured at different periods treated as separate traits) or random regression models (Table 2). Using these two last approaches on the same data, Lassen et al. (2003), Dechow et al. (2004a), and Spurlock et al. (2012) reported heritability estimates in the same range. Koenen et al. (1998), Veerkamp et al. (2001), and Berry et al. (2003b) investigated different orders of Legendre polynomials to model the additive genetic component and calculated the eigenvalues of the additive genetic covariance matrix to determine the contribution of each extra term to the overall variation in the curve. Using a quadratic random regression model, the first eigenfunction accounted for 71% (Berry et al., 2003b), 98% (Veerkamp et al., 2001), and 99% (Koenen et al., 1998) of genetic variance. Little advantage of using Legendre polynomials of order 3 instead of order 2 has been reported (Berry et al., 2003b).
Using either a random regression or multitrait model, genetic variance and heritability of BCS tend to vary across days in milk (Table 2). Various trends of genetic variances for BCS have been presented. The paucity of data at the beginning and the end of the lactation and the mathematical behavior of polynomials at data extremities might contribute to the large genetic variation at the peripheries of lactation in some studies (Berry et al., 2003b; Oikonomou et al., 2008). However, the majority of studies found lower genetic variance in early lactation than in the rest of the lactation (e.g., Koenen et al., 1998; Koenen et al., 2001; Veerkamp et al., 2001; Dechow et al., 2004a; Loker et al., 2011), suggesting that cows are more different in their rate of immediate recovery from negative EB than when they lose condition. Furthermore, Mao et al. (2004) reported that the genetic variance of BCS was the highest around 120 DIM, when energy expenditure and intake supposedly reach a balance during lactation and they concluded that BCS curves differ genetically between cows in shape and in height. Likewise, several authors found that heritability estimates peaked in midlactation (Gallo et al., 2001; Koenen et al., 2001; Berry et al., 2002, 2003b; Dechow et al., 2004a; Loker et al., 2011). Finally, heritability of BCS was generally lower in first-lactation than in later lactations (Dechow et al., 2001; Loker et al., 2011). Heritabilities reported in Table 2 are for Holstein cows with the exception of estimates from Koenen et al. (2001; Holstein and Red-and-White), Mao et al. (2004; Holstein, Jersey, and Danish Red), Pryce et al. (2006; Holstein, Jersey, and crossbred), and Dal Zotto et al. (2007; Brown Swiss). Koenen et al. (2001) found lower heritability estimates for Red-and-White heifers (0.23 to 0.32) than for Holstein cows (0.28 to 0.37) while Dal Zotto et al. (2007) obtained a relatively low heritability (0.15) for BCS of Brown Swiss cattle. These results suggest that BCS might be under stronger genetic control in Holstein than in other breeds. However, Mao et al. (2004) reported higher heritability estimates for Jersey (0.55 to 0.78) and Danish-Red (0.58 to 0.70) than for Holstein (0.30 to 0.60). Nevertheless, the latter results were obtained from data collected in a single experimental herd that contained 294 cows and these estimates are probably subject to large standard errors.
Body condition score measures are generally highly correlated within and between parity. Genetic correlations among parities ranged between 0.77 and 1.00 (Dechow et al., 2001; Loker et al.,
16
2011) suggesting that selection based on first lactation BCS would be effective for later parities as well. Genetic correlation estimates between BCS measured at different points during the lactation are generally strong, especially between adjacent periods (Koenen et al., 2001; Loker et al., 2011). However, in some studies (Jones et al., 1999; Dechow et al., 2001; Gallo et al., 2001), BCS in early lactation appears to be genetically less similar to BCS in other periods. Jones et al. (1999) indicated that the correlation between BCS before 30 DIM and BCS from 151 to 210 DIM was 0.63. In the study from Dechow et al. (2001), the genetic correlation between BCS at calving and BCS before dry-off was 0.69. Roche et al. (2009a) concluded that much of the variation observed in BCS at different stages of the cow’s life would be under the influence of similar genes. However, Berry et al. (2003c) found genotype by environment interactions for BCS implying that genes that influence BCS may differ according to the nutritional (i.e., concentrate feeding level, grazing severity, and silage quality) or milk yield (i.e., herd-year mean milk yield) environment. As a consequence of the strong correlations among different BCS measurements over the lactation, little genetic variation in BCS change is expected in comparison to the variation in level of BCS. Heritability estimates for BCS change are actually lower than for BCS level and vary from 0.01 to 0.10 (Pryce et al., 2001; Berry et al., 2002; Dechow et al., 2002).
Genetic correlations of body condition score with other traits
An overview of various studies presenting genetic correlation estimates between BCS and production, type and body weight, diseases, and fertility traits is given in Table 3. In general, the direction of correlations did not change between studies although the magnitude of correlations varied. Also, it should be noted that high standard errors have been reported for some correlation estimates.
Genetic correlations with non-fertility traits
Over a range of studies, milk, fat, and protein yields had unfavorable genetic correlations with BCS. Clearly, cows that are genetically superior producers tend to have lower BCS, especially during the lactation. Genetic correlations with BCS were on average -0.37 for milk yield, -0.27 for fat yield, and -0.31 for protein yield (Table 3). Negative correlations of a similar magnitude have been also reported for test-day milk, fat, and protein yields, and fat and protein contents (Veerkamp et al., 1997; Toshniwal et al., 2008; Loker et al., 2012). Greater BCS change in early lactation is also expected for genetically superior producers (Pryce et al., 2001; Berry et al., 2002; Dechow et al., 2002; Berry et al., 2003a). There was a tendency for BCS measured in early lactation to give the weakest correlations with milk yield (Veerkamp et al., 2001; Berry et al., 2003a; Loker et al., 2012). From these results, Dechow et al. (2001) concluded that cows that are efficient producers of milk, direct more nutrients towards milk production and less toward body reserves during the lactation and thus, tend to have lower BCS during the lactation. Nevertheless, the genetic relationships between BCS and production traits are not 1, indicating that, using appropriate indexes, both traits could be improved by genetic selection.
17 Table 3. Overview of genetic correlation estimates between body condition score (BCS) and production, type, body weight, diseases, and fertility traits from various studies
Trait Average genetic correlation with BCS1 Range Reference2 Production Milk yield -0.37 -0.63 to -0.12 3, 5, 6, 7, 8, 10, 12, 14, 17, 18, 19 Fat yield -0.27 -0.43 to -0.03 3, 5, 6, 10, 12, 14, 18, 19 Protein yield -0.31 -0.54 to -0.06 3, 5, 6, 10, 12, 14, 18, 19 Somatic cell score -0.12 -0.17 to -0.08 18, 19, 24
Type and body weight
Dairy form, dairy character,
angularity -0.65 -0.77 to -0.35 1, 11, 12, 13, 15, 16, 17 Strength 0.45 0.17 to 0.72 11, 12 Stature 0.20 0.13 to 0.28 1, 11, 12 Heart girth 0.28 0.21 to 0.34 4, 12 Body depth 0.20 -0.05 to 0.40 1, 11, 12 Body weight 0.55 0.42 to 0.67 1, 7, 19, 21, 25 Diseases Mastitis -0.52 -0.61 to -0.25 13, 16, 23
Diseases other than mastitis -0.19 -0.22 to -0.15 13, 16, 23 Fertility
Days to first heat -0.41 - 5
Days to commencement of
luteal activity -0.84 - 9
Days to first service -0.48 -0.63 to -0.35 3, 5, 6, 10, 14, 18, 20, 22
Days to last service -0.44 - 6
Days to conception, days
open -0.38 -0.46 to -0.30 17, 22
Days from first service to
conception 0.01 - 10
Days from first to last service -0.46 -0.62 to -0.30 20, 22
Calving interval -0.39 -0.53 to -0.14 2, 5, 6, 8, 14, 20 Number of services -0.22 -0.37 to -0.06 3, 6, 10, 20 Conception at first service 0.22 0.16 to 0.28 6, 10
Conception rate at first service 0.60 - 20
Pregnant 63d after the start of
the breeding season 0.37 - 10
Presented for mating within 21d from the planned start of mating
0.49 - 19
Calving rate within 42d from
the planned start of calving 0.43 - 19
1
Correlations have been averaged first within studies and second among studies. 2 1=Veerkamp and Brotherstone, 1997; 2=Pryce et al., 2000; 3=Dechow et al., 2001; 4=Gallo et al., 2001; 5=Pryce et al., 2001; 6=Veerkamp et al., 2001; 7=Berry et al., 2002; 8=Pryce et al., 2002; 9=Royal et al., 2002; 10=Berry et al., 2003a; 11=Dechow et al., 2003; 12=Kadarmideen and Wegmann, 2003; 13=Lassen et al., 2003; 14=Wall et al., 2003; 15=Dechow et al., 2004a; 16=Dechow et al., 2004b; 17=Dechow et al., 2004c; 18=Kadarmideen, 2004; 19=Pryce and Harris, 2006; 20=De Haas et al., 2007; 21=Toshniwal et al., 2008; 22=Zink et al., 2011; 23=Koeck et al., 2012; 24=Loker et al., 2012; 25=Spurlock et al., 2012.
18
In contrast to these studies, Pryce et al. (2006) found a genetic correlation between BCS and 270-d fat changing from mo270-derately positive in early lactation to negative in late lactation. They observed the same trend in protein yield, and, to a lesser extent, in milk yield. Pryce et al. (2006) concluded that under the pastoral production systems typical in New Zealand, cows that have high BCS in early lactation (in spring) are more likely to have higher total yields of fat and protein because they have more reserves available for production in the autumn when feed resources are limited.
Several studies investigated the genetic relationships between BCS and conformation traits. Overall, traits related to dairyness of cows such as dairy form, angularity or udder traits are generally negatively correlated with BCS. Since dairy form (or angularity) is a subjective type evaluation trait described by the openness and the angle of the ribs and the flatness of bones, it could be considered a similar trait, yet opposite, to BCS. On average the genetic correlation between BCS and dairy form was -0.65 (Table 3); with the exception of Kadarmideen et al. (2003) who reported a genetic correlation of -0.35, most of the studies reported relatively strong estimates ranging from -0.77 to -0.61. Furthermore, genetic relationships between BCS and udder type traits have been reported to be unfavorable but low to moderate (Veerkamp et al., 1997; Dechow et al., 2003; Kadarmideen et al., 2003).
In opposition to dairyness traits, traits related to body size, body development, and body weight were generally positively correlated with BCS. Genetic correlations with BCS were on average 0.45 for strength, 0.20 for stature, 0.28 for heart girth, and 0.20 for body depth (Table 3). Moreover, Veerkamp et al. (1997) showed that the accuracy of selection for BCS using an index combining stature, chest width, body depth, angularity, and rump width would be 0.88, suggesting that BCS could be predicted from the type traits with little loss in accuracy. Dechow et al. (2003) concluded that cows with a higher BCS have more body fat and muscle and thus appear to be stronger, have somewhat larger body dimensions and weigh more. Moderate to strong genetic correlations between BCS and body weight have been documented with average estimates ranging from 0.42 to 0.67 (Table 3). From their results, Berry et al. (2002) proposed that some breeding indices pursuing a reduction in body weight to increase animal efficiency may also lead to reducing animals’ BCS, assuming no cognizance of other traits associated with BCS.
Overall, cows with high merit for BCS are genetically less susceptible to diseases. On average, the genetic correlation between BCS and the occurrence of diseases other than mastitis was -0.19 (Table 3). Nevertheless, estimates vary across studies according to the trait considered (from -0.64 to 0.27; Lassen et al., 2003; Dechow et al., 2004b; Koeck et al., 2012). The strongest genetic associations were found for ketosis, displaced abomasum, mastitis and metritis in Koeck et al. (2012) and for metabolic and digestive disease, displaced abomasum, and mastitis in Dechow et al. (2004b). Correlations between BCS and mastitis ranged from -0.61 to -0.25 indicating that animals with higher BCS are genetically more resistant to mastitis. This is corroborated by the weak negative genetic correlation between BCS and somatic cell score, which is considered an indicator of udder health (lower values of somatic cell score are desirable). This correlation was -0.12 on average (Table 3).
19 Genetic correlations with fertility
Over a range of studies, favorable, moderate to strong genetic relationships have been documented between BCS and fertility (Table 3); cows that have genetically lower levels of BCS, on average, experience more reproductive difficulties.
Negative genetic correlations between BCS and interval reproductive traits (i.e., number of days between two events such as calving, heat, insemination, conception or subsequent calving) have been reported. Genetically low BCS tend to be associated with delayed first estrus, and negative correlations have been found between BCS and the number of days to first heat (-0.41; Pryce et al., 2001) and the number of days to commencement of luteal activity (-0.84; Royal et al., 2002). Cows with low BCS may not maintain energy levels that are sufficient to activate ovarian function or display estrus and they are therefore likely inseminated for the first time at a later date (Dechow et al., 2001). Likewise, cows genetically inclined to maintain BCS in early lactation are inseminated earlier in the lactation (Dechow et al., 2002). The number of days to first service actually showed moderate to strong negative correlations with BCS, ranging from -0.63 to -0.35 with an average of -0.48 (Table 3). Over a range of interval traits within the same study, the number of days to first service often showed the strongest genetic correlation with BCS (Veerkamp et al., 2001; Berry et al., 2003a; Wall et al., 2003). Negative genetic correlations of BCS with calving interval, number of days to last service, number of days from calving to conception and days between first and last services have also been reported and range on average from -0.39 to -0.46 (Table 3). Overall, it suggests that lower BCS levels during the lactation would increase the number of days when the cow is not pregnant.
Moderate favorable genetic relationships have been reported between BCS and traits reflecting pregnancy status of the cow after the first insemination or within a specific time interval. Conception (rate) at first service, pregnant 63d after the start of breeding season, presented for mating within 21 days from the planned start of mating, and calving rate within 42 days from the planned start of calving were all positively genetically correlated with BCS, with the correlations ranging from 0.22 to 0.60 (Table 3). Negative genetic correlations between BCS and number of services per cow have been reported (Table 3), ranging from -0.37 to -0.06. These estimates suggest that cows with genetically higher BCS would have a greater chance to conceive after insemination.
Although the direction of correlations between BCS and fertility traits generally did not change over the lactation, studies reported that the magnitude of correlations varied according to the lactation stage. Dechow et al. (2001), Berry et al. (2003a) and de Haas et al. (2007) reported that BCS in mid-lactation had the strongest relationship with fertility. Because genetic correlations between fertility and BCS could depend on lactation stage, it might be expected that the BCS change is correlated with reproductive performance. Despite the fact that estimates are quite variable and are subject to high standard errors, unfavorable low to moderate genetic correlations between fertility and BCS loss in early lactation have been reported (Pryce et al., 2001; Dechow et al., 2002; Berry et al., 2003a), indicating that greater BCS loss in early lactation is correlated with poorer fertility.
In early lactation, cows are in negative EB. Consequently, they mobilize body tissue to sustain milk production and their BCS decreases. Therefore, they may be yielding milk at the expense of reproduction. Hence, Dechow et al. (2001; 2002) included mature equivalent milk yield as a covariable in the model to adjust the genetic correlation between BCS and fertility for milk