EFFET DE L'ÂGE DES PEUPLEMENTS SUR L'ERREUR D'ÂGE ET L'ESTIMATION DE LA PRODUCTIVITÉ CHEZ L'ÉPINETTE NOIRE (PICEA
MARIANA (Mill.) B.S.P.)
MÉMOIRE PRÉSENTÉ
COMME EXIGENCE PARTIELLE DE LA MAÎTRISE EN BIOLOGIE
EXTENTIONNÉE DE
L'UNIVERSITÉ DU QUÉBEC À MONTRÉAL
PAR
WILLIAM MARCHAND
Mise en garde
La bibliothèque du Cégep de l’Témiscamingue et de l’Université du Québec en Abitibi-Témiscamingue a obtenu l’autorisation de l’auteur de ce document afin de diffuser, dans un but non lucratif, une copie de son œuvre dans Depositum, site d’archives numériques, gratuit et accessible à tous.
L’auteur conserve néanmoins ses droits de propriété intellectuelle, dont son droit d’auteur, sur cette œuvre. Il est donc interdit de reproduire ou de publier en totalité ou en partie ce document sans l’autorisation de l’auteur.
Warning
The library of the Cégep de l’Témiscamingue and the Université du Québec en Abitibi-Témiscamingue obtained the permission of the author to use a copy of this document for non-profit purposes in order to put it in the open archives Depositum, which is free and accessible to all.
The author retains ownership of the copyright on this document. Neither the whole document, nor substantial extracts from it, may be printed or otherwise reproduced without the author's permission.
Je tiens en premier lieu à remercier ma directrice, Atmie DesRochers, qui m'a donné l'opportunité de vivre cette aventure et qui a su me guider et me conseiller tout au long de ces deux années.
Je remercie également Line Blackburn, Émilie Desjardins, René Samson et André Bérubé pour leur aide précieuse lors de la phase de terrain de ce projet.
Mes remerciements vont aussi aux membres de mon comité de maîtrise, Brian Harvey et Igor Drobyshev, ainsi qu'à Hubert Morin et Sylvie Gauthier qui ont accepté d'évaluer ce mémoire.
Merci égalem ent à Ahmed Laamrani, Suzanne Brais, Nicole Fenton, Steve Cumming, Alain Leduc, Yves Bergeron, Daniel Lesieur, Émilie Tarroux et Francine Tremblay pour leur aide et leurs commentaires tout au long du processus d'écriture de ce m émoire. Merci aussi à Marc Mazerolle pour toute l'aide concernant l 'analyse statistique.
Enfin j e tiens à remercier les partenaires financiers de ce proj et, sans qui ce travail n 'aurait pas été possible : le CRSNG, le FRQNT et les industries Tembec, représentées par Geneviève Labrecque et Louis Dumas.
TABLE DES MATIÈRES
LISTE DES FIGURES ... v
LISTE DES TABLEAUX ... vi
LISTE DES ABRÉVIATIONS, SIGLES ET ACCRONYMES ... vii
RÉSUMÉ ... ... ... ... ... viii
CHAPITRE I INTRODUCTION GÉNÉRALE ... 1
1.1 Contexte et problématique ... 1
1.2 État des connaissances ... 2
1.3 Objectifs et hypothèses de départ ... ... ... ... 6
1.4 Méthodologie ... ... ... ... 6
1.5 Références bibliographiques ... 9
CHAPITRE II EFFECT OF STAND AGE ON AGING ERROR AND PRODUCTIVITY ESTIMATION OF BLACK SPRUCE STANDS ... 13
2.1 Abstract ... 14
2.2 Introduction ... 16
2.3 Methods ... 18
2.3.1 Study Sites ... 18
2.3.2 Field measurements and sample collection ... 21
2.3.3 Dendrochronological analysis ... ... ... 22
2.3.4 Data analyses ... ... ... ... 22
2.4 Results and discussion ... 28
2.4.2 Effect of aging error on the estimation of productivity ... .... 35 2.5 Management implications .... ... ... ... 46 2.6 Acknowledgements ... 48 2.7 Literature cited ... 49 CHAPITRE III CONCLUSION GÉNÉRALE .... ... ... ... 57 3.1 Résultats majeurs ... ... ... ... 57
3.2 Travaux futurs et implications pour 1 'aménagement forestier ... 59
LISTE DES FIGURES
Figure Page
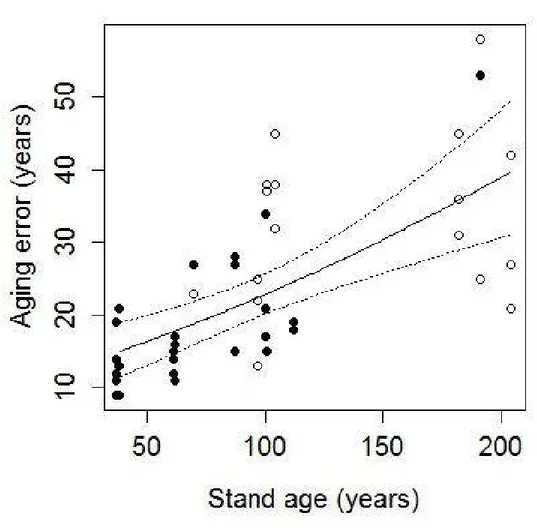
2.1 Map of the studied stands ... 19 2.2 Predicted values given by the set of candidate mo dels ( continuous line) and
observed values (filled circles: trees aged with root collar; open circles: trees without root collar) of aging error as a function of stand age ... 34 2.3 Height-growth curves for each stand. For readability, stands were grouped
into 5 age classes: (A) 20-50 years, (B) 51-75 years, (C) 76-100 years, (D) 101-150 years, (E) > 150 years ... 36 2.4 Predicted (continuous lines) and observed values (filled circles: stands aged
from trees with root collar; open circles: stands aged from trees without root collar) of SI difference (difference between SI derived from Pothier and Savard (1998) and from stem analysis curves) based on the entire set of candidate models, as a function of (A) aging error; (B) Stand age. Dashed lines represent 95% confidence intervals ... 39 2.5 Volume-Age curves according to Pothier and Savard (1998) model. For
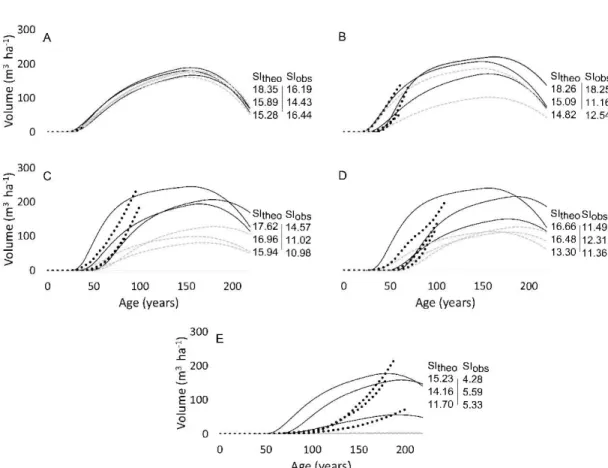
readability, stands were grouped into 5 age classes : (A) 20-50 years, (B) 51-75 years, (C) 76-100 years, (D) 101-150 years, (E) > 150 years ... 42 2.6 Predicted (continuous lines) and observed values (filled circles: stands aged
from trees with root collar; open circles: stands aged from trees without root collar) of differences between volumes derived from Pothier and Savard ( 1998) models (V theo) and from stem analysis values (Vobs) based on the entire set of candidate models as a function of (A) Stand age and (B) SI difference (difference between site index from Pothier and Savard (Sitheo) and from stem analysis (Siobs)). Dashed lines represent 95% confidence intervals ... 45
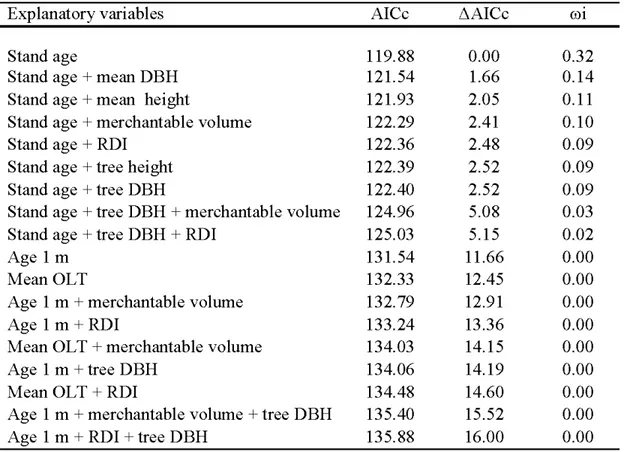
Tableau Page 2.1 Stand characteristics ... 20 2.2 Model selection based on the Akaike Information Criterion (AICc).
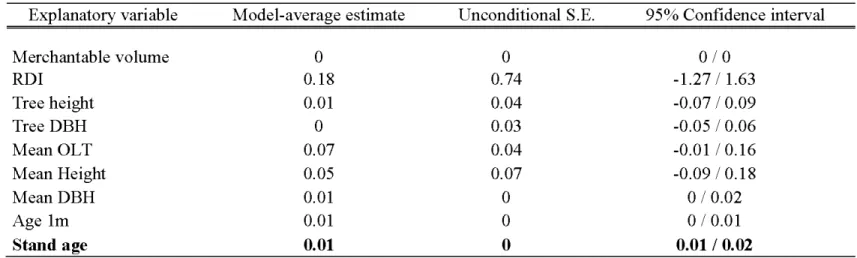
Response variable is root-square of aging error. ... 32 2.3 Multi model inference based on AICc for models linking root square of
aging error with explanatory variables ... 33 2.4 Model selection based on the Akaike Information Criterion corrected for
small sample sizes (AICc) ... 37 2.5 Multi model inference based on Akaike Information Criterion corrected for
small sample sizes (AICc) for models linking SI difference with explanatory variables ... 38 2.6 Model selection based on the Akaike Information Criterion corrected for
small sample sizes (AICc) ... 43 2.7 Multi model inference based on Akaike Information Criterion corrected for
small sample sizes (AICc), for models linking the difference between Vtheo and V stem (il V) with explanatory variables ... 44
LISTE DES ABRÉVIATIONS, SIGLES ET ACCRONYMES DHP (DBH) IQS (SI) RDI AAC OLT AI Cc
Diamètre à Hauteur de Poitrine (Diameter at Breast Height)
Indice de Qualité de Station (Site Index)
Relative Density Index Annual Allowable Cut Organic Layer Thickness
L'épinette noire (Picea mariana (Mill.) BSP) développe continuellement ses racines adventives. Le collet de 1 'arbre se retrouve englobé à l'intérieur de la souche et localisé sous la surface du sol. Un âge déterminé par un décompte de cernes au niveau du sol ou à 1 rn de hauteur sur la tige est donc sous-estimé. Cette sous-estimation de 1' âge devrait augmenter avec 1 'âge du peuplement par la croissance continue des racines adventives et 1 'enfouissement progressif de la base de la tige sous son propre poids. Or, une sous-estimation de l'âge des arbres devrait entrainer une surestimation de leur productivité. Le but de cette étude était d'évaluer l'effet de l'âge du peuplement sur l'erreur d'estimation de l'âge et l'estimation de la productivité. Trois arbres de quinze peuplements âgés de 37 à 204 ans, non paludifiés et régénérés naturellement après feu ont été excavés et leur souche récoltée. Les sections de souche ont été interdatées jusqu'au collet et l'âge total a été comparé à un décompte de cernes à 1 rn de hauteur. Les courbes de hauteur et volume obtenues par analyse de tiges ont été comparées à celles dérivées des modèles de Pothier et Savard (1998). La différence entre l'âge réel et celui à 1 rn variait de 9 à 58 ans et augmentait avec l'âge du peuplement. Les indices de qualité de station (IQS ; hauteur à un âge de 50 ans) étaient significativement surestimés quand 1' âge à 1 rn était utilisé, et la surestimation augmentait avec 1 'erreur d'âge et l'âge du peuplement. L'utilisation de l'âge à 1 rn a induit une mauvaise modélisation des trajectoires de croissance en hauteur et volume. La croissance juvénile réelle en hauteur et volume était plus lente que celle prédite avec l'âge à 1 m. Les années de croissance englobées dans la souche font que les semis n'accumulent aucune hauteur pendant les premières années de vie. La sénescence des peuplements semblait également survenir plus tardivement. De plus, la croissance juvénile des arbres les plus vieux était plus lente que celle des arbres plus jeunes, possiblement à cause de conditions de croissance moins favorable s. Bien que les valeurs prédites de volumes ne différaient pas significativement des valeurs observées par analyse de tige, les modèles de croissance devraient être ajustés en utilisant l'âge pris au collet ou le temps depuis le dernier feu, afin de considérer les premières années de croissance et obtenir une meilleure estimation de la productivité.
Mots-clés: Picea mariana, erreur d'estimation de l'âge, âge du peuplement, estimation de la productivité, indice de qualité de station, racines adventives.
CHAPITRE I : INTRODUCTION GÉNÉRALE
1.1 Contexte et problématique
L'épinette noire (Picea mariana (Mill.) B.S.P.) est l'espèce dominante des forêts boréales de 1 'Abitibi-Témiscamingue, principalement retrouvée dans le domaine bioclimatique de la pessière à mousses. Elle forme des massifs forestiers qui représentent près de 28 % de la superficie du Québec (Rowe 1972). Cette essence est particulièrement convoitée par les industries papetières et de sciage du fait de la très bonne qualité de sa fibre, longue, élastique et très résistante (Singh 1987, Alteyrac et
al. 2006). Son bois dense, solide et facile à travailler, est utilisé pour la production de bois d'œuvre et d'ingénierie, et permet également de produire facilement un papier de bonne qualité (Liu et al. 2007). Dans un contexte où les arbres sont récoltés de plus en plus loin des usines de transformation et où leur diamètre est moindre comparativement aux récoltes passées, il paraît important de s'interroger sur la pérennité de cette ressource et sur les méthodes de gestion qui permettraient d'assurer une production continue de bois sur le long terme.
Selon Garet et al. (2012), l'âge des arbres et des peuplements serait un bon indicateur de l'intégrité écologique des forêts. Une matrice forestière composée de peuplements d'âges variés serait aussi garante d'une ressource forestière pérenne. L'âge habituellement utilisé pour le calcul des possibilités forestières est celui mesuré à 1 rn de hauteur (Pothier et Savard 1998). Dans un contexte de coupe avec protection de la régénération et des sols, cette méthode d'évaluation de l'âge est valable, puisque les arbres résiduels auront bien souvent déjà atteint une hauteur de 1 m. Pour l'épinette noire, la régénération préétablie après coupe sera alors majoritairement issue de marcottage. Les semis établis après feu, par contre, présenteront une croissance juvénile très lente et atteindront une hauteur de 1 rn plusieurs dizaines d'années après la perturbation. Or, il a été mis en évidence, chez l'épinette noire, une sous-estimation de l'âge mesuré au-dessus de la surface du sol comparativement à l'âge réel de l'arbre
(DesRochers et Gagnon 1997). Ces différences proviennent d'une mauvmse localisation du collet (interface tige/racines) qui, chez 1 'épinette et d'autres espèces résineuses, se retrouve enfoui dans le sol (DesRochers et Gagnon 1997, Parent et al. 2000). La sous-estimation de l'âge pourrait impliquer une surestimation de la productivité des forêts avec comme conséquence possible une gestion inadaptée des peuplements sur le long terme. De plus, cela pourrait fausser les interprétations de la dynamique de régénération des peuplements en laissant croire par exemple que l'établissement des arbres par graines se fait sur une longue période de temps après feu.
1.2 État des connaissances
L'épinette noire présente plusieurs adaptations au milieu boréal. Son mode de régénération par graines issues de cônes semi-sérotineux est une adaptation aux feux de forêt, perturbation majeure modelant le paysage boréal. Cette méthode de multiplication, libérant un grand nombre de graines lors du passage d'un feu, permet une régénération rapide du peuplement (Gagnon et Morin 2001 ). Le substrat laissé après brûlis, à dominante minérale et riche en éléments nutritifs, facilite la germination et la croissance des semis (Landhaüsser et Wein 1993 ). Cela fait de 1' épinette noire une espèce pionnière s'installant dans les cinq années suivant le feu (St-Pierre et al. 1992, Gagnon et Morin 2001). Une reproduction végétative par marcottage des branches basses intervient également (Krause et Morin 2005). La formation de racines adventives sur la tige est, quant à elle, une adaptation aux conditions pédologiques de la forêt boréale, caractérisées par des sols humides et froids, présentant par endroit une grande quantité de mousse (Fenton et al. 2005, Tarroux et al. 2014). Les racines adventives vont se substituer au système racinaire initial (Esau 1967, Krause et Morin 2005). Leur développement assure un bon ancrage de l'arbre au sol, et une bonne absorption des minéraux et de 1' eau. De même, 1 'arbre bénéficiera d'une meilleure oxygénation dans les substrats gorgés d'eau puisque ces structures se développent en surface (Gewehr et al. 2014). Une croissance horizontale du semis sur le substrat humide est souvent observée pendant les premières années. Elle permettrait à l'arbre
3
de développer son système racinaire adventif. (DesRochers et Gagnon 1997, Parent et
al. 2000). La croissance juvénile en hauteur peut alors être très lente en milieu boréal (Van Bogaert et al. 2015). Burns et Honkala (1990) indiquent même des taux de croissance en hauteur de 2,5 cm par an dans les environnements fortement paludifiés. Le collet peut être localisé par la différence anatomique visible entre la moelle de la tige et le cylindre vasculaire central de la racine (Esau 1967). Il est généralement admis que cette interface soit localisée au niveau du sol, avec les racines en dessous et la tige au-dessus. Cependant, puisque l'épinette noire développe un système racinaire adventif sur la tige elle-même, le collet est donc localisé sous ces racines. (DesRochers et Gagnon 1997, Parent et Morin 2002). Or, les premiers cernes de croissance apparaissent uniquement sur la section de tige la plus proche du collet et ne sont donc pas visibles sur les sections situées plus haut. Ainsi, un décompte des cernes sur les parties aériennes de la tige sous-estimera l'âge de l'arbre. DesRochers et Gagnon ( 1997) ont observé une différence d 'une vingtaine d'années entre l 'âge mesuré au niveau du sol et l'âge réel de l'arbre, soit celui trouvé le plus près du collet, correspondant à l ' année de germination du semis. Des études sur d'aut res essences ont donné des résultats comparables, la sous-estimation pouvant atteindre plus de 20 ans chez le sapin baumier Abies balsamea (Parent et al. 2000), 37 ans chez l'épinette blanche Picea g lauca (Gutsell et Johnson 2002), et 26 ans chez l'épinette de N orvège
Picea abies (Niklasson 2002). De plus, l 'enfouissement de la partie basse de la tige va
induire un phénomène de défilem ent inverse (reversed taper), caract érisé par un arrêt de croissance radiale dans les parties souterraines de la tige (DesRochers et Gagnon 1997, Matison et Brümelis 2008, Wilmking et al. 2012). Ce phénomène se traduit par une absence de formation des cernes les plus récents sur les sections de tige souterraines (Fayle 1968, Peters et al. 2002). Ainsi, peu importe la section considérée, il est presque impossible de déterminer l' âge exact de l 'arbre sans effectuer d' interdatationjusqu' au collet (DesRochers et Gagnon 1997).
Plusieurs auteurs ont tenté de développer des corrections applicables à l'âge obtenu sur une section aérienne de tige. Tandis que Wong et Lertzman (200 1) et Pothier et Savard (1998) ont estimé une moyenne d'âge nécessaire à de jeunes arbres (gaules) pour atteindre la hauteur de carottage, Henry et Swan (1974) ajoutent à l'âge trouvé un nombre d'années moyen obtenu à partir de carottes prises au niveau du sol et de la hauteur de carottage. Ces correctifs manquent de fiabilité puisque l'épinette a une croissance très hétérogène tout au long de sa vie, selon la région d'étude, et cela même à l'échelle du peuplement. De plus, les années de croissance correspondant aux cernes sous le niveau du sol ne sont pas prises en compte. D'autres auteurs ont tenté de modéliser l'âge selon différents paramètres physiques de l'arbre (Leak 1985, Wong et Lertzman 2001, Matthes et al. 2008, Fraver et al. 2011) mais se sont également heurtés à la variabilité de la croissance de l'épinette et des conditions qui l'influencent. L'inclusion, au sein des modèles, de variables caractérisant le site (climat, caractéristiques édaphiques ou hydrologiques, végétation du sous-bois) permettrait d' étendre leur aire d'application, afin de pouvoir prédire, avec un seul modèle, l' âge d'arbres poussant sur des sites aux conditions environnementales très différentes (Matthes et al. 2008, Rohner et al. 2013).
L'âge entre en compte dans le calcul de divers paramètres permettant de modéliser la productivité des forêts. L'indice de qualité de station (IQS), défini comme la hauteur atteinte par un arbre à un âge de référence (l'âge de 50 ans est souvent utilisé), fournit une mesure relative du rendement potentiel de chaque peuplement (Doucet et Côté 2009). Cette valeur sert de base à la modélisation des paramètres compilés dans les tables de production, dont la hauteur dominante et le volume marchand (Pothier et Savard 1998). Différents modèles ont été utilisés au fil du temps (Boudoux 1978, Pothier et Savard 1998), dont l'ajustement se base soit sur des données issues de placettes temporaires, de placettes permanentes, ou encore d'analyse de tiges. L'élaboration de ces modèles est sujette à controverses. Les arbres utilisés pour construire ces équations n'ont peut-être pas été dominants (ou co-dominants) toute leur vie, et auraient atteint ce statut à la suite d'une perturbation secondaire (Harper et al.
5
2003, Raulier et al. 2003). Une période d'oppression, en ralentissant la croissance des arbres, pourrait conduire à l'obtention de courbes qui ne représenteraient pas le plein potentiel du peuplement (Raulier et al. 2003). Ouzennou et al. (2008) proposent un indice afin de prendre en considération la diversité diamétrale au sein d'un même peuplement. Cet indice semblerait améliorer la précision des modèles notamment pour les régions où la densité de peuplements inéquiens est forte (Ouzennou et al. 2008, Pothier et Auger 2011). Pothier et Mailly (2006) préconisent l'utilisation d'un indice permettant de modéliser la perte de volume due à la mortalité occasionnée par la tordeuse des bourgeons de l'épinette. D'autres remarques concernent l'utilisation des données d'analyse de tige, ou de placettes temporaires, ne permettant pas de suivre les variabilités temporelles de croissance et de statut social. Pour cette raison, Raulier et al. (2003) recommandent 1 'utilisation de placettes-échantillons permanentes.
L'âge à 1 rn (ou celui au Diamètre à Hauteur de Poitrine [DHP]), même s'il ne correspond pas à l'âge total de l 'arbre, est toujours utilisé dans certaines équations de modélisation de la croissance d'un peuplement (Pothier et Savard 1998, Carmean et al. 2006, Homagain 2011, Pothier et Auger 2011). La période de croissance juvénile, absente des sections à 1 rn de hauteur, est ignorée ou sous-estimée. Ainsi, Pothier et Savard (1998) estiment qu'il faut au maximum 7 années à un arbre croissant en conditions difficiles pour atteindre 1 rn de hauteur. Cette valeur est bien inférieure aux résultats de Van Bogaert et al. (2015), qui ont observé qu' il fallait en moyenne 25 ans à un arbre pour atteindre 1 rn de hauteur dans un environnement boréal au nord du 49e parallèle. Cette utilisation d'un âge sous-estimé, outre un effet sur les calculs de possibilité forestière, entraîne aussi une mauvaise interprétation de la dynamique de régénération des peuplements. Certaines études, portant sur des peuplements matures d'épinettes noires et se basant sur un âge mesuré au-dessus du sol pour étudier la période de régénération après feu, ont conclu que l'épinette mettrait entre 5 et 25 ans pour se régénérer (Sirois et Payette 1989, Lieffers 1996, Bergeron 2000). Ces résultats sont contradictoires avec ceux d'autres études portant sur des peuplements jeunes et montrant une régénération rapide et sur une courte période après feu (St-Pierre et al.
1992, Duchesne et Sirois 1995, Côté et al. 2014). Le plus grand laps de temps observé
pour les peuplements matures serait dû aux erreurs d'estimation de l'âge des arbres
(DesRochers et Gagnon 1997). Des études récentes, comme celle de Garet et al. (2012)
ou encore Fourrier et al. (20 13) préconisent ainsi 1 'utilisation d'une variable temporelle
basée sur le nombre d'années depuis le dernier feu plutôt que sur l'âge à 1 rn, afin d'estimer au mieux l'âge d'un peuplement.
1.3 Objectifs et hypothèses de départ
Cette étude visait dans un premier temps à déterminer l'influence de l'âge du peuplement sur l'erreur d'âge des arbres (la différence d'âge observée entre 1 rn de hauteur et le collet). Nous supposons que, plus le peuplement est vieux, plus l'erreur d'âge sera grande, car le système racinaire adventif se développe tout au long de la vie des arbres. Dans un second temps, l'effet de ces sous-estimations sur les estimations de la qualité du site (IQS) et de la productivité (volume marchand) des peuplements d' épinette noire a été étudié. Nous supposons que ces deux paramètres sont surestimés lorsque 1 'âge à 1 rn est utilisé dans le calcul à la place de 1 'âge total.
1.4 Méthodologie
Les peuplements étudiés sont localisés en forêt boréale, dans les régions de l' Abitibi et du Nord du Québec, dans les domaines bioclimatiques de la pessière à mousses et de la sapinière à bouleau blanc, entre le nord de La Sarre et le nord de Senneterre. Ils ont été choisis en terrain peu paludifié (épaisseur de matière organique inférieure ou égale à 25 cm), principalement sur des sols bien drainés où l'eau ne s'accumule pas, afin d'éviter les biais liés à l'accumulation de matière organique. Ils ont également été sélectionnés de façon à être séparés d'au moins 500 rn les uns des autres. Le choix s'est aussi porté sur des peuplements d'âges variés, afin d'obtenir un gradient d'âge (de moins de 50 ans à plus de 150 ans). L'âge a été estimé dans un premier temps à partir de cartes de feux et de carottes récoltées sur des peupliers faux-trembles (Populus tremuloides) et des pins gris (Pinus banksiana), espèces à croissance initiale rapide et
7 dépourvues de racines adventives. La présence de charbon de bois dans le sol, ainsi que l'absence de traces de plantation (arbres anormalement alignés, souches d'arbres coupés) ont été vérifiées afin de s'assurer de l'origine naturelle des peuplements. Des placettes circulaires de 11,25 rn de rayon ( 400 m2) ont été délimitées dans chacun
des peuplements sélectionnés. À l'intérieur de ces placettes, l'espèce et le DHP ont été relevés pour tous les arbres ayant atteint la taille commerciale (9 cm au DHP). L'épaisseur de matière organique a été mesurée au centre et à chaque point cardinal. Trois arbres ont été sélectionnés selon la méthode traditionnelle d'échantillonnage du Ministère des Ressources Naturelles (MRNF 20 11). Les arbres choisis ont été excavés en sectionnant les racines latérales à la tronçonneuse pour pouvoir en récolter la souche. Leur hauteur a été mesurée, et des sections ont été prélevées à 0 rn, 0,3 rn, 1 rn, puis à 9 intervalles réguliers sur la longueur de tige restante (intervalles situés à des hauteurs entre 10% et 90% de la hauteur résiduelle, qui correspond à la hauteur totale de l'arbre à laquelle on soustrait 1 rn (Chhin et al. 2010)). La souche a été débitée en sections de 2 cm et 1 'ensemble des sections (tige et souche) a été séché et préparé afin de faire apparaître les cernes de croissance. Les sections de souches ont été interdatées jusqu'au collet en suivant la méthode du skeleton plot de façon à obtenir l'âge réel des arbres (Swetnam et al. 1985). Les sections de tige ont été scannées puis les cernes y ont été mesurés sur deux rayons à l'aide du logiciel WinDendroTM (Regent Instruments Inc., QC, Canada, 2008). Une analyse de tige a été réalisée à 1' aide du logiciel WinStem TM (Regent Instruments Inc., QC, Canada, 2008) de façon à obtenir la croissance en hauteur et en volume de l'arbre.
Le Chapitre 2 présente cette étude sous la forme d'un article scientifique. L' influence de l'âge du peuplement sur les différences d'âge observées entre 1 rn de hauteur et le collet y est notamment discutée. Une comparaison est réalisée entre des courbes de hauteur et volume prédites selon les équations actuellement utilisées au Québec et des courbes d' analyse de tige obtenues à partir de nos arbres échantillons. Le Chapitre 3 présente les conclusions générales de 1' étude, ainsi que certaines perspectives et implications sur le plan de l'aménagement forestier. Dans le cadre de cette étude, j'ai
participé, avec l'aide de Line Blackburn, à la sélection des peuplements et à la récolte des arbres, ainsi qu'à la découpe des souches. J'ai également effectué le traitement de l'ensemble des galettes (séchage et sablage). J'ai réalisé le travail de laboratoire dans son intégralité, à savoir l'interdatation des galettes de souche jusqu'au collet racinaire et la partie analyse de tige. J'ai également effectué les analyses statistiques des données, ainsi que la rédaction du manuscrit avec l'aide de ma directrice Annie DesRochers, qui l'a relu, corrigé et complété.
9 1. 5 Références bibliographiques
Alteyrac, J., Cloutier, A., Ung, C.H., Zhang, S.Y., 2006. Mechanical properties in relation to selected wood characteristics of black spruce. Wood and Fi ber Science 38, 229-237.
Bergeron, Y., 2000. Species and stand dynamics in the mixed woods of Quebec's southern boreal forest. Ecology 81, 1500-1516.
Boudoux, M., 1978. Empirical yield tables for jack pine. The Forestry Chronicle 54, 216-219.
Burns, R.M., Honkala, B.H., 1990. Silvics of North America V.1 Conifers. Washington, DC: United States Department of Agriculture Forest Service, 675 p. Carmean, W., Hazenberg, G., Deschamps, K.C., 2006. Polymorphie site index curves for black spruce and trembling aspen in northwest Ontario. The Forestry Chronicle 82,
231-242.
Chhin, S. , Hogg, E.T., Lieffers, V.J. , Huang, S., 2010. Growth-climate relationships vary with height along the stem in lodgepole pine. Tree Physiology 30, 335-345. Côté, D., Lupi, C., Gagnon, R. , Lord, D., Morin, H. , 2014. Growth dynamics of successive post-fire cohorts of black spruce: Is site potential reduced ? The Forestry Chronicle 90, 96-104.
DesRochers, A. , Gagnon, R., 1997. Is ring count at ground level a good estimation of black spruce age? Canadian Journal of Forest Research 27, 1263-1267.
Doucet, R. , Côté, M., 2009. Manuel de fore sterie (2è éd.). Québec Éditions MultiMondes. 1544 p.
Duchesne, S., Sirois, L. , 1995. First phase of post fire regeneration of subarctic conifer stands. Canadian Journal of Forest Research 25, 307-318.
Esau, K., 1967. Plant anatomy (2è éd.). New York: John Wiley & Sons, 767 p.
Fayle, D.C.F. , 1968. Radial growth in tree roots; distribution-timing-anatomy. Toronto, Ont.: University of Toronto, Faculty of Forestry, 183 p.
Fenton, N. , Lecomte, N., Légaré, S. , Bergeron, Y., 2005. Paludification in black spruce
(Picea mariana) forests of eastern Canada: Potential factors and management
Fourrier, A., Pothier, D., Bouchard, M., 2013. A comparative study oflong-term stand growth in eastern Canadian boreal forest: Fire versus clear-cut. Forest Ecology and Management 310, 10-18.
Fraver, S., Bradford, J.B., Palik, J., 2011. Improving tree age estimates derived from increment cores: a case study of red pine. Forest Science 57, 164-170.
Gagnon, R., Morin, H., 2001. Les forêts d'épinette noire du Québec dynamique, perturbations et biodiversité. Le Naturaliste Canadien 125, 26-35.
Garet, J., Raulier, F., Pothier, D., Cumming, S.G., 2012. Forest age class structures as indicators of sustainability in boreal forest: Are we measuring them correctly ? Ecological Indicators 23, 202-210.
Gewehr, S., Drobyshev, I., Berninger, F., Bergeron, Y., 2014. Soil characteristics mediate the distribution and response of boreal trees to climatic variability. Canadian Journal of Forest Research 44, 487-498.
Gutsell, S.L., Johnson, E. A., 2002. Accurately ageing trees and examining their height-growth rates: implications for interpreting forest dynamics. Journal ofEcology 90, 153-166.
Harper, K., Boudreault, C., DeGrandpré, L., Drapeau, P., Gauthier, S., Bergeron, Y., 2003. Structure, composition, and diversity of old-growth black spruce boreal forest of the Clay Belt region in Quebec and Ontario. Environmental Reviews 11, S79-S9 8. Henry, J.D., Swan, J.M.A., 1974. Reconstructing fore st history from live and dead plant material-An approach to the study of fore st succession in southwest New Hampshire. Ecology 55, 772-783.
Homagain, K., 2011. Growth and yield comparisons for red pine, white spruce and black spruce plantations in northwestern Ontario. The Forestry Chronicle 87, 494-503. Krause, C., Morin, H., 2005. Adventive-root development in mature black spruce and balsam fir in the boreal fore sts of Quebec, Canada. Canadian Journal of Forest Research 35, 2642-2654.
Landhaüsser, S.M. , Wein, W.R., 1993. Postfire vegetation recovery and tree establishment at the arctic treeline: climate-change vegetation-response hypotheses. Journal of Ecology 81, 665-672.
Leak, W.B. , 1985. Relationships of tree age to diameter in old-growth northern hardwoods and spruce-fir. Research Note NE-329. USDA Forest Service, Northeastern Forest Experiment Station, 4 p.
11
Lieffers, V., 1996. Semi-natural and intensive silvicultural systems for the boreal mixedwood forest. The Forestry Chronicle 72, 286-292.
Liu, C., Zhang, S.Y., Cloutier, A., Rycabel, T., 2007. Modeling lumber bending stiffness and strength in natural black spruce stands using stand and tree characteristics. Forest Ecology and Management 242, 648-655.
Matison, R., Brümelis, G., 2008. Effect ofburial by sand on Scots pine (Pi nus sylvestris
L.) radial growth on seacoast wooded dunes at Cape Kolka, Latvia. Acta Universitatis
Latviensis 745, 131-144.
Matthes, U., Kelly, P.E., Larson, D.W., 2008. Predicting the age of ancient Thuja
occidentalis on cliffs. Canadian Journal of Forest Research 38, 2923-2931.
MRNF, 2011. Normes d'inventaire forestier. Les placettes-échantillons temporaires. Québec : Ministère des Ressources Naturelles et de la Faune, Direction des Inventaires Forestiers, 213 p.
Niklasson, M., 2002. A comparison ofthree age determination methods for suppressed Norway spruce: implications for age structure analysis. Forest Ecology and Management 161, 279-2 88.
Ouzennou, H. , Pothier, D., Raulier, F., 2008. Adjustment ofthe age-height relationship for uneven-aged black spruce stands. Canadian Journal of Forest Research 38,
2003-2012.
Parent, S. , Morin, H., 2002. Reply : Effects of adventitious roots on age determination in balsam fir regeneration. Canadian Journal of Forest Research 32, 1296-1300. Parent, S., Morin, H., Messier, C., 2000. Effects of adventitious roots on age determination in balsam fir (Abies balsamea) regeneration. Canadian Journal of Forest Research 30, 513-51 8.
Peters, V. S., Macdonald, S.E., Dale, M.R. , 2002. Aging discrepancies of white spruce affect the interpretation of static age structure in boreal mixedwoods. Canadian Journal of Forest Research 32, 1496-1501.
Pothier, D. , Auger, 1., 2011. NATURA-2009: un modèle de prévision de la croissance à l'échelle du peuplement pour les forêts du Québec. Mémoire de recherche forestière n°. 139. Québec: Gouvernement du Québec, Ministère des Ressources Naturelles et de la Faune, Direction de la recherche forestière, 58 p.
Pothier, D., Mailly, D. , 2006. Stand-level prediction ofbalsam fir mortality in relation to spruce budworm defoliation. Canadian Journal of Forest Research 36, 1631-1640.
Pothier, D., Savard, F., 1998. Actualisation des tables de production pour les principales espèces forestières du Québec. RN98-3054. Québec : Ministère des Ressources naturelles, Gouvernnement du Québec, 183 p.
Raulier, F., Lambert, M.C., Pothier, D., Ung, C.H., 2003. Impact of dominant tree dynamics on site index curves. Forest Ecology and Management 184, 65-78.
Rohner, B., Bugmann, H., Bigler, C., 2013. Towards non-destructive estimation oftree age. Forest Ecology and Management 304, 286-295.
Rowe, J.S., 1972. Les régions forestières du Canada. Publication n° 1300F. Ottawa: Environnement Canada, Service Canadien des Forêts, 172 p.
Singh, T., 1987. Wood density variations in thirteen canadian tree species. Wood and Fiber Science 19, 362-369.
Sirois, L., Payette, S., 1989. Postfire black spruce establishment in subarctic and boreal Quebec. Canadian Journal of Forest Research 19, 1571-1580.
St-Pierre, H., Gagnon, R., Bellefleur, P., 1992. Régénération après feu de l'épinette noire (Picea mariana) et du Pin gris (Pinus banksiana) dans la forêt boréale, Québec. Canadian Journal of Forest Research 22, 474-481.
Swetnam, T., Thompson, M., Kennedy Sutherland, E., 1985. Using dendrochronology to measure radial growth of defoliated trees. Washington D.C. : USDA Forest Service, Agriculture Handbook 639, 39 p.
Tarroux, E., DesRochers, A. , Girard, J.-P., 2014. Growth and root development of black and white spruce planted after deep planting. Forest Ecology and Management 318, 294-303.
Van Bogaert, R., Gauthier, S. , Raulier, F., Saucier, J.-P. , Boucher, D., Robitaille, A., Bergeron, Y., 2015. Exploring forest productivity at an early age after fire: a case study at the northern limit of commercial forests in Quebec. Canadian Journal of Forest Research 45, 579-5 93 .
Wilmking, M., Hallinger, M., Van Bogaert, R., Kyncl, T., Babst, F., Hahne, W., Juday, G.P., de Luis, M., Novak, K., Vôllm, C., 2012. Continuously missing outer rings in woody plants at their distributional margins. Dendrochronologia 30, 213-222.
Wong, C.M., Lertzman, K.P., 2001. Errors in estimating tree age: implications for studies of stand dynamics. Canadian Journal ofF orest Research 31, 1262-1271.
CHAPITRE II: EFFECT OF STAND AGE ON AGING ERR OR AND PRODUCTIVITY ESTIMATION OF BLACK SPRUCE STANDS*
William Marchand & Annie DesRochers
Institut de Recherche sur les Forêts, Université du Québec en Abitibi-Témiscamingue 341 Principale Nord, Amos (QC) J9T 2L8, Canada
William Marchand, William.Marchand@uqat.ca, (1) 819 218 3549
Annie DesRochers, Annie.Desrochers@uqat.ca, (1) 819 732-8809 poste 8327
2.1 Abstract
Black spruce (Picea mariana (Mill.) BSP) continuously expands its adventitious
rooting system, meaning that the root collar is amalgamated into the stump and located below ground. Tree age determined by ring counts at ground lev el or 1 rn height on the stem is thus underestimated. This age underestimation would increase with stand age because of the continuous growth of adventitious roots and the sinking of the stem under its own weight. Tree age underestimation would lead to productivity overestimation. The goal ofthis study was to evaluate the effect of stand age on aging error of trees and productivity estimation. Three trees within each of fifteen non paludified and naturally regenerated black spruce stands aged 37-204 years were excavated to harvest the stump and locate the root collar. Stump sections were cross-dated down to the root collar to obtain trees' total age which was then compared to a ring count done at 1 rn height. Height and volume growth curves obtained by stem analysis were compared with those derived from Pothier and Savard's (1998) models. Age difference between total age and age at 1 rn (aging error) ranged 9-58 years and significantly increased with stand age. Site indices (SI; height of trees at 50 years of age) were significantly over-estimated by using age at 1 rn, and the overestimation significantly increased with stand age and aging error. The use of age at 1 rn lead to poor modeling ofheight- and growth trajectories, as earl y height and volume-growth obtained through stem analysis was slower than predicted and stand senescence also occurred later. Because of all the annual growth rings amalgamated within the stump of trees, seedlings don't accumulate any height during the first years. Additionally, early growth of our oldest trees was slower than early growth of our younger trees, probably because of less favorable growing conditions. Despite large differences between volume and height growth trajectories, predicted volumes from theoretical SI calculations were not significantly different from observed values using stem analysis, at the time of sampling. Predictive models should nevertheless be adjusted by using age at root collar, or time since the last fire, to consider the first years of slow growth and to obtain more accurate productivity estimations.
Key-words: Picea mariana, aging error, stand age, productivity estimation, site
index, adventitious roots Highlights
• Aging error of black spruce trees increases with stand age. • Aging errors induce overestimation of site productivity.
• Trees had slower early growth and growth increased over a longer time period compared to Pothier and Savard's (1998) models.
15 Résumé
L'épinette noire (Picea mariana (Mill.) BSP) développe continuellement ses racines adventives. Le collet de 1 'arbre se retrouve englobé à l 'intérieur de la souche et localisé sous la surface du sol. Un âge déterminé par un décompte de cernes au niveau du sol ou à 1 rn de hauteur sur la tige est donc sous-estimé. Cette sous-estimation de 1' âge devrait augmenter avec 1 'âge du peuplement par la croissance continue des racines adventives et 1 'enfouissement progressif de la base de la tige sous son propre poids. Or, une sous-estimation de l 'âge des arbres devrait entrainer une surestimation de leur productivité. Le but de cette étude était d' évaluer l'effet de l'âge du peuplement sur l'erreur d'estimation de l'âge et l'estimation de la productivité. Trois arbres de quinze peuplements âgés de 37 à 204 ans, non paludifiés et régénérés naturellement après feu ont été excavés et leur souche récoltée. Les sections de souche ont été inter-datées jusqu'au collet et l'âge total a été comparé à un décompte de cernes à 1 rn de hauteur. Les courbes de hauteur et volume obtenues par analyse de tiges ont été comparées à celles dérivées des modèles de Po thier & Savard ( 1998). La différence entre 1' âge réel et celui à 1 rn variait de 9 à 58 ans et augmentait avec l'âge du peuplement. Les indices de qualité de station (IQS ; hauteur à un âge de 50 ans) étaient significativement surestimés quand 1' âge à 1 rn ét ait utilisé, et la surestimation augmentait avec 1 'erreur d' âge et l 'âge du peuplem ent. L 'utilisation de l 'âge à 1 rn a induit une mauvaise m odélisation des traj ectoires de croissance en hauteur et volume. La croissance juvénile réelle en hauteur et volume était plus lente que celle prédite avec l'âge à 1 m. Les années de croissance englobées dans la souche font que les semis n'accumulent aucune hauteur pendant les premièr es années de vie . La sénescence des peuplements semblait égalem ent survenir plus tardivement. De plus, la croissance juvénile des arbres les plus vieux ét ait plus lente que celle des arbres plus j eunes, possiblement à cause de conditions de croissance moins favorables. Bien que les valeurs prédites de volumes ne diffé raient pas significativement des valeurs observées par analyse de tige, les modèles de croissance devraient êtr e aj ust és en ut ilisant l'âge total des arbres ou le temps depuis le dernier feu, afin de considérer les premières années de croissance et obtenir une meilleure estimation de la productivité.
Mot s-clés : Picea mariana, erreur d'estimation de 1 'âge, âge du peuplem ent, estimation de la product ivité, indice de qualité de station, racines adventives.
2.2 Introduction
Black spruce (Picea mariana Mill. BSP) is an important species of the boreal forests of eastern Canada because of its abundance (Rowe 1972) and fiber quality for the timber industry (Singh 1987, Burton et al. 2003). The ecology ofblack spruce is highly dependent on natural disturbances, particularly wildfires; semi-serotinous cones maintain an aerial seedbank and allow a quick re-establishment of the population after stand-replacing fires (Gagnon and Morin 2001 ). Accumulation of organic material on the forest floor (Fenton et al. 2005, Fenton and Bergeron 2007) slows tree growth, but black spruce has physiological adaptations to these conditions (Islam et al. 2003); trees progressively produce shallow adventitious roots that replace in time the initial root system, ensuring trees better nutrient supply and an efficient anchoring system (Krause and Morin 2005, Tarroux et al. 2014). These adventitious roots, the accumulation of organic matter and sinking oftrees undertheir own weight burrythe base of stems and explain whythe root collar (i.e. the root 1 shoot interface) is located below ground level (Telewski and Lynch 1991, DesRochers and Gagnon 1997, Parent and Morin 2002). Radial growth ce ases in the buried part of the stem (reversed taper; DesRochers and
Gagnon 1997, Matison and Brümelis 2008, Wilmking et al. 2012), and outer rings are
missing on stem sections below adventitious roots (Peters et al. 2002). At the same time, growth rings corresponding to the first years after germination are located belowground close to the root collar, and do not appear higher up the stem (Des Rochers and Gagnon 1997). Thus, there are missing rings both at (or above) ground lev el and at the root collar: at no position on the stem do ring counts accurately represent the total age of a tree, which needs cross-dating to be determined. DesRochers and Gagnon (1997) found age differences up to 19 years between the age at ground level and the total age of trees. Similar studies, working on other species (bals am fir: Parent et al. (2000), white spruce: Gutsell and Johnson (2002), Peters et al. (2002), Norway spruce: Niklasson (2002)) found similar discrepancies.
17 Despite inaccurate aging of trees from a single ring count along the stem, it remains the common practice in forestry. Erroneous age determination may however cause misinterpretations of stand dynamics. For example, it appears that mature black spruce stands regenerate within a period of time occurring 5-25 years after fire (Sirois and Payette 1989, Lieffers 1996, Bergeron 2000, Côté et al. 2014). This is in contradiction with results from young stands, showing a regeneration period occurring within the first five years after fire (St-Pierre et al. 1992, Landhaüsser and Wein 1993, Duchesne and Sirois 1995, Côté et al. 2014). Sorne authors (Gagnon and Morin 1992, Gagnon et
al. 1992) suggested that the gap between fire occurrence and tree establishment
observed in other studies was due to this age underestimation from ground level ring counts. Because ofthe continuous development ofroots and forest floor, 'regeneration lag', or age underestimation oftrees, probably increases with stand age.
Many studies have tried to build predictive models of the number of years that trees require to reach a determined height, on the basis of physical and environmental parameters. Most ofthese equations take into account dendrometric measures of a tree such as coring height, height and diameter at breast height (DBH) (Henry and Swan 1974, Loewenstein et al. 2000, Wong and Lertzman 2001 , Fraver et al. 2011, Trotsiuk
et al. 20 12). Sorne models have tried to integrate environmental variables such as soil
parameters, slope or elevation (Matthes et al. 2008, Rohner et al. 20 13a, b ). But, according to Wong and Lertzman (200 1 ), these models are only valid at the studied stand scale and for a narrow range of environmental conditions. They do not allow, for example, an effective correction of the age at 1 rn height used in the calculation of annual allowable eut (AAC) of commercial species ofQuebec's public forests (Pothier and Savard 1998). For black spruce, it is assumed that a maximum of 7 years is necessary for a tree to reach 1 rn height (Pothier and Savard 1998). This value does not consider the variation in the distance between the ground surface and the root collar through time, induced by the development of adventitious roots, the sinking of trees under their own weight, or a period of horizontal growth as is often observed for black spruce (DesRochers and Gagnon 1997). Dendrochronological studies have shown that
a great number of years was missing from ground level sections compared with ring counts down to the root collar (DesRochers and Gagnon 1997, Gutsell and Johnson 2002, Niklasson 2002, Peters et al. 2002). According to Garet et al. (2012), the age of 80% of commercial forest stands is underestimated. Garet et al. (2012) and Fourrier et al. (2013) argued that time since the last fire would better represent stand age (and age oftrees) than the age taken at 1 rn height.
The goal of this study was to evaluate the extent of age underestimation that is made with 1 rn height ring counts in relation to age of stands, and to evaluate the associated productivity overestimation of black spruce stands. Fifteen stands originating from fires that occurred 37-204 years prior were investigated. We hypothesized that age underestimation and stand productivity overestimation would increase with stand age, as correctly measured.
2.3 Methods
2.3.1 Study Sites
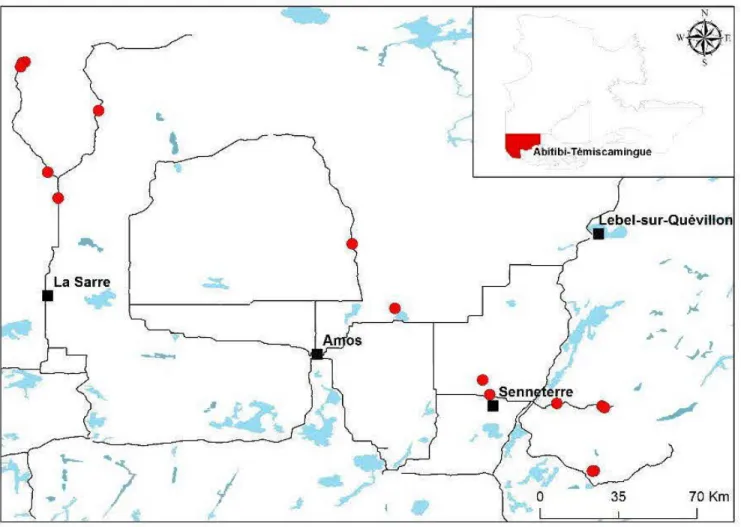
Study sites were located between 48°07'N 76°56'W and 49°76'N 79°30'W in the boreal forest of western Quebec (Canada), within the western balsam fir-paper birch
(Abies balsamea - Betula papyrifera) 1 western spruce-moss bioclimatic domains
(Grondin 1996) (Fig. 2.1). Pure black spruce stands of different ages were chosen to obtain an age gradient, for a total of fifteen studied stands ranging from young to mature. An initial selection was done based on ages derived from fire maps and increment cores collected from jack pine (Pinus banksiana) and trembling aspen
(Populus tremuloides) trees growing at proximity, from which a count of the growth
rings was performed. These species were chosen because of the ir fast initial growth and lack of adventitious roots (Burns and Honkala 1990, Lauzon et al. 2006). Fire origin was confirmed at each site by the presence of charcoal and the lack of visible
'
'
(
•
f1
1
Figure 2.1 Map of the studied stands. Circles represent studied stands.
~bitibi-
Témiscamingue /...
1-
-
"'
"'
1
1 J~r
_,
Stand Lat. Long. Stand age % Spruce Mean OLT Mean Tree Height Mean DBH Density (cm) (rn) (cm) (trees ha-1) 1 49.748 -79.291 37 79 11.6 6.85 6.91 3700 2 49.733 -79.298 37 62 4.8 8.02 8.46 1800 3 49.753 -79.280 38 79 11.6 7.41 7.56 2400 4 48.108 -76.998 61 86 5.6 10.61 12.41 1100 5 48.109 -76.990 62 96 12.4 10.27 11.69 2400 6 48.370 -76.959 70 75 6.8 13.31 13.63 1700 7 48.364 -76.950 87 100 14.8 12.34 13.95 1500 8 48.416 -77.411 97 97 17.6 14.41 14.91 2200 9 48.381 -77.140 100 76 16.0 15.29 17.75 1100 10 48.475 -77.439 101 88 13.2 11.36 12.32 1800 11 49.309 -79.189 104 94 14.0 11.31 12.32 1800 12 48.762 -77.793 112 76 22.4 14.64 14.09 2600 13 49.205 -79.146 182 90 22. 8 12.43 14.94 1700 14 49.022 -77. 964 19 1 90 15. 8 13.14 16.0 1 1500 15 49.557 -78.985 204 94 25.0 11.47 13.63 1200
Note: Lat= latitude, Long= longitude, stand age is the age ofthe oldest of the three sampled trees of a plot, OLT = organic layer thickness of the stand, DBH = Diameter at breast height (1.3 rn), density was obtained by multiplying the number of trees of a plot by 25 and was rounded to the nearest hundred.
N
21 anthropogenic elues (eut stumps ). Soils were constituted of glacial deposits (till) and fine clay partiel es, with good to mo derate drainage. In order to dissociate the effects of organic matter accumulation and age of stands, only sites with thin organic layers (:::: 25 cm) were chosen. Study sites were located close to roads (0 - 50 rn), to facilitate access and transport of samples, and were separated from each other by a minimal distance of 500 m. Stands were dominated by black spruce, with a few stems of bals am fir, aspen, paper birch, tamarack (Larix laricina) and jack pine. Characteristics ofthe
studied stands are compiled in Table 2.1. From 1971 to 2010, precipitation records from Amos, Berry and Val d'Or meteorological stations, the three closest stations to our study sites, averaged 917 mm annually (667 mm as rainfall, 257 mm as snowfall). Mean annual temperature was 0.9°C, maximum 6.9°C and minimum -5°C (Environnement Canada 20 11).
2.3.2 Field measurements and sample collection
Sampling was clone in summers of2014 and 2015. A circular 400m2 sample plot was delineated within each of the studied stands. Plots were established in order to include a density of stems representative of the entire stand, and sampled according to the Quebec's Ministry of Natural Resources norms for temporary sample plots (MRNF 2011). Organic layer thickness was measured in the center of the plot and at the four cardinal points with a soil auger, and averaged for the plot. Diameter at breast height (DBH) and species were recorded for each tree of commercial size (DBH
>
9 cm) or, for the younger stands, trees with DBH>
5 cm, and a number was assigned to each of them in the order of measurement. Three trees per plot were selected: i) the tree clos est to the center of the plot among the three biggest trees, ii) the tree whose number corresponded to the half of the total number oftrees, iii) the tree with the DBH nearest to the average DBH ofthe plot. Ground level height was marked on each stem before they were felled by cutting the main lateral roots with a chainsaw. Cross-sections were collected at 0 rn, 0.4 rn, 1 rn and then at regular heights on the remaining stem,following the method of Chhin et al. (2010). Tree stumps were collected and eut into 2 cm transverse sections using a portable sawmill.
2.3.3 Dendrochronological analysis
All cross-sections were air-dried for several weeks, then sanded with sequentially finer grades of sand paper up to 120 grit. To increase visibility of growth rings, a ray on the surface of each section was eut with a razor blade and white chalk was applied before growth rings were observed under a binocular microscope. To evaluate the total age of each tree, all stump sections were cross-dated clown to locate the root collar, where the spindle-shaped vascular system of the root replaces the circular-shaped pith cells cluster ofthe stem (Esau 1967, DesRochers and Gagnon 1997). Ifthe early stem grew horizontally, cross-sections were sawn again in the transversal axis. Cross-dating was performed using the skeleton plot method (Swetnam et al. 1985). Frost marks, compression wood, false rings, traumatic resin ducts and narrow or wide rings were used as pointer-years. Stem sections were digitalised (Epson 1 OOOOXL A3 optical scanner, resolution of 1200 dpi). Annual diameter and height increments were measured using the WinDendroTM software (Regent Instruments Inc. 2009) along two paths, avoiding sections with compression wood or unusually thin rings. Data was th en analysed with Winstem stem analysis program (Regent Instruments Inc. 2009) in order to obtain tree height (rn) and volume (dm3) as a function of age.
2.3.4 Data analyses
2.3.4.1 Effect of stand age on aging error
Stand age was considered as the age (at root collar) ofthe oldest ofthe three sampled trees in the plot. Aging error was calculated by subtracting the age found at 1 rn height ( considered as the standard method for determining the age of a tree) to the cross-dated age at root collar (total age); this was measured for each sampled trees (N=45). In order
23
to estimate productivity per hectare, a relative density index (RDI) was calculated based on the equation from Pothier and Savard (1998) (Eq. 1).
D 1
RDI= N(-q )b2 tobl
where RDI is the relative density index, N is the number of stems per hectare, Dq is the mean quadratic diameter, b 1 and b2 are species-specific coefficients available in Pothier and Savard (1998).
Stand merchantable volume (m3 ha·1
) was estimated using the equation developed by
Fortin et al. (2007), which takes into account species-specific regional effects. Since height oftrees was not measured for every tree within plots, it was estimated using the equation from Fortin et al. (2009), which takes into account the regional variability of growing conditions by including average annual temperatures and coefficients related to ecological subdivisions and drainage conditions ofthe studied area.
A regression analysis was used to evaluate the effect of stand age on aging error. All statistical analyses were performed in R v. 3.1.1 (R Core Team 2014). A significance level of a =0.05 was chosen. The response variable was root square of aging error, and explanatory variables were: age at 1 rn, height and DBH of selected trees, stand age, average height and DBH of the studied plot, mean organic layer thickness (OLT), RDI and merchantable volume. Interactions between explanatory variables were included at first, and removed if not significant. We calculated pairwise correlations between all explanatory variables. We put covariates which presented a high degree of correlation into separate models. Linear mixed models were fitted using the lme function of the nlme package (Pinheiro et al. 20 14) with plot as a random effect to account for unmeasured environmental variability and for the lack of independence in the plot lev el covariates (Hurlbert 1984). Normality and homogeneity of Pearson's residuals were visually checked, and aging error was root square transformed to improve homogeneity. Altemate models were compared based on Akaike's Information Criterion adjusted for small sample size (AICc) using the aictab function of the
AICcmodavg package (Mazerolle 2014). Models with the lowest llAICc values were considered to have the greatest predictive power. Effect of the explanatory variables was highlighted with the multi-model inference approach (Bumham and Anderson 2002) based on the values of model- average estimates and 95% unconditional confidence intervals. Predictive values of aging error were obtained from the fitted models usingthe modavgpred function ofthe AICcmodavg package (Mazerolle 2014).
2.3.4.2 Effect of aging error on the estimation ofproductivity
Site index (SI) is a numerical index of growth potential. It is a parameter ofheight-age equations used to model height of the larger trees of a stand (the dominant height, Hct(t)) through time. Permanent (PSP) or temporary (TSP) sample plot protocols specify how the larger trees of a stand are defined and sampled. SI is defined as the dominant height at an age of 50 years measured at 1 rn height (i.e. Hct(50)). Pothier and Savard (1998) have defined an equation of Hct(t) based on TSP measurements. Because our sample protocol followed the TSP protocol, we calculated Hct using their Eq.2, and used this value and Eq.3 to obtain theoretical values of SI (Sitheo)
where Hct is the dominant height (rn), D4 is the average DBH of the four largest trees in the plot (cm), D is the average DBH of the sampled trees (cm), His the average height of the three selected trees (rn), and ais the regression coefficient for black spruce given in Pothier and Savard (1998).
where SI is the Site Index (rn at 50 years) Hct is the dominant height (rn) (Eq. 2), Ais the averaged actual age at 1 rn of sampled trees (years), a, b, c, d, e are regression coefficients for black spruce given in Pothier and Savard (1998).
25 We used Sitheo values into Eq.4 to build height-age curves and to estimate Hct(t) for later use in our volume calculations.
where Hct(t) is the dominant height (rn) of a stand at age t, SI is the site index of the stand (rn), t is the age at 1 rn height (years) varying from 1 to 220 years, and a, b, c, d, e, fare coefficients for black spruce given in Pothier and Savard (1998).
We used the stem analysis data of the three selected trees per plot (the same trees that were used to calculate Hct) to reconstruct the observed trajectory ofHct(t). Because these relationships were approximately linear in the vicinity of t=50, we have extrapolated Hct(50) for young stands using simple linear models. We obtained Siobs (Hct(50)) using the observed or extrapolated Hct(t) curves.
Sitheo and Siobs were compared for each plot using a paired t-test. SI difference was defined as the difference between Sitheo and Siobs- To evaluate the effect of stand age on Sictiff, aging error and other explanatory variables (mean age at 1 rn, RDI, mean height, mean DBH, mean OLT, merchantable volume), linearmodels were constructed with Sictiff as the response variable. Statistical approach was similar to that described for aging error, using multiple linear regression models instead of mixed models, because all variables were measured at the plot level.
Relative density index (RDI(t)), quadratic diameter (Dq(t)), basal area (G(t)) and volume (V(t)) were calculated using equations 5, 6 and 8. Vtheo(t) was obtained using Sitheo, in Eq.4, while Vobs was obtained using
Siobs-Both Siobs and Sitheo were used to build volume-age curves for each stand, using equations of Pothier and Savard (1998) (Eq. 5). We used the senescence index of Pothier and Savard (1998) which simulates stand senescence by a graduai decline in the volume values.
Where RDI(t) is the relative density index at an age t, RDI (lOO) is the value of RDI for a 100-year-old stand as given in Pothier and Savard (1998), tis the age at 1 rn height (years) varying from 1 to 220 years, a and b are species-specific coefficients given in Pothier and Savard (1998).
Where Dq(t) is the quadratic diameter (cm) of the stand at an age t, Hd(t) is the dominant height (rn) of a stand at an age t, RDI(t) is the relative density index at an age t, t is the age at 1 rn height (years) varying from 1 to 220 years, a, b, c and d, are species-specific coefficients given in Pothier and Savard (1998).
Where G(t) is the basal area (m2 ha-1) of a stand at an age t, Hd(t) is the dominant height
(rn) of a stand at an age t, RDI(t) is the relative density index at an age t, t is the age at 1 rn height (years) varying from 1 to 220 years, a, b, c, d, e and f, are species-specific coefficients given in Pothier and Savard (1998).
V (t) =
a
Hd(t)b G(t)c Dq(t)dWhere V is the merchantable volume of the stand (m3 ha-1
) at an age t, Hd is the
dominant height (rn) of a stand at an age t, Gis the basal are a (m2 ha·1
) of a stand at an
age t, Dq is the quadratic diameter (cm) of a stand at an age t and a, b, c and d are species specifie coefficients given in Pothier and Savard (1998).
We calculated an average volume per tree Vindiv based on stem analysis values. For comparison purposes, this value was converted to represent a volume per hectare, using the same density as Pothier and Savard (1998) models, derived from relative density index and quadratic diameter (Eq. 9).
-1
[
Dq ( t )] b
27
Where Vstem(t) is the observed volume (m3 ha-1
) , Vindiv. is the average volume of a tree
based on stem analysis values (m3
) corresponding to an arithmetic average of the three
values of individual volumes given by each selected tree of a stand, for each year of life, RDI(t) and Dq(t) are relative density index and quadratic diameter (cm) of the stand for an age t and derived from Eq. 6 and Sltheo, a and b are coefficients for black spruce
given in Pothier and Savard (1998)
V theo, Vobs and V stem were values ofvolumes derived from Sltheo, Slobs and stem analysis
at the current stand age. These values were compared using a paired t-test. Volume difference (tl V) was calculated as the difference between V theo and Vobs- To look for the effect of aging error on tl V, stand age, SI differences and other explanatory variables (mean age at 1 rn, RDI, mean height, mean DBH, mean OLT), linear models were constructed with volume difference as the response variable.
2.4 Results and discussion
2.4.1 Effect of stand age on aging error
Age at root collar ranged 33-204 years while the age at 1 rn ranged 17-177 years. Ages measured at 1 rn and at root collar differed from 9-58 years (mean± sd: 24.04 ± 12.07), while ages at ground level (0 rn) and at root collar differed from 1-31 years (mean± sd: 11.4 ± 7.96). About 40% (27) of our trees, mostly the oldest trees, had their root collar missing from the stump wood, thus having the entire initial root system replaced by adventitious roots. Since radial growth stops in buried stem sections (Fayle 1968) if the root collar is not included within the stump wood, it is often lost to decay. One could argue that these trees could have originated from layering, or from seeds germinated after the establishment of the initial cohort. For these trees, the year corresponding to the last observed growth ring was used as the total age even though trees were most likely older. We could not find non-paludified stands aged 120-180 years (Table 2.1) within the time frame and distance constraints ofthis study.
Our observed aging error values are similar to what was found in DesRochers and
Gagnon (1997), Parisien et al. (2005) and Vasiliauskas and Chen (2002). The value of
7 years considered by Pothier and Savard ( 1998) as the time necessary for a tree to reach 1 rn in poor sites is thus much lower than what we observed for trees growing on good sites (Sitheo values
>
15 rn, Carmean et al. (2006)), and does not consider the significant increase of aging error with stand age. Parisien et al. (2005), working on trees<
1. 5 rn of mature fire-originating black spruce stands, also showed a difference between the number ofbud scars ( considered as the total age) and ring counts at ground lev el more marked in older stands. Working on mesic sites over a smaller range of ages (time since fire 53-85 years ), V asiliauskas and Chen (2002) also found a positive correlation between time to reach breast height and time since last fire (equivalent to stand age).29
The difference between age at ground level or at 1 rn height and age at root collar is due to the below ground position of the root collar hiding initial growth rings (DesRochers and Gagnon 1997). Horizontal growth of the stem, frequently observed on black spruce seedlings (DesRochers and Gagnon 1997, Parent et al. 2000), and
difficult growing conditions in boreal environments (Van Bogaert et al. 2015)
contribute to the slow initial height growth of seedlings. One might argue that this slow and/or horizontal initial growth is required for trees to install their adventitious root system (Tarroux et al. 2014); the development of adventitious roots is stimulated by a
moist substrate. As a consequence, growth rings are missing even from sections taken at ground level (DesRochers and Gagnon 1997) which is often mistaken for the root coll ar.
Trees of the plot were on average 12.5% shorter and 11.6% thinner than sampled trees. The merchantable volume of studied stands ranged 13-265 m3 ha-1 and the average
relative density index (RDI) ranged 0.23-0.95. Organic layer thickness (OLT) presented slight differences between plots, ranging 4.8-25 cm, with an average of 14.29
± 5.9 cm. Organic layer was thinner in younger stands (9.3 cm on average for stands younger than 50 years) than in older ones (17.95 cm on average for stands older than 75 years ). We selected non-paludified stands in order to discriminate the effect of stand age from that of organic matter accumulation. Even if organic layer thickness was slightly greater for our older stands (above 150 years), it remained relatively low. Organic layer could contribute to hi de initial growth years; in highly paludified stands, it could be expected that the maximum difference between the age at 1 rn and at root collar would be greater than 58 years, the thicker OLT hiding even more growth rings under the soillevel. Unpublished data from our laboratory show that aging error can reach more than 100 years fortrees growing in paludified sites (OLT > 75 cm).
Aging error increased with stand age from an average of 13 ± 4.2 years for younger stands (< 50 years) to an average of 38 ± 12.8 years for stands older than 150 years (Fig. 2.2). Stand age was the best predictor of aging error. Model containing stand age as the only explanatory variable presented the lowest AICc value (AICc = 11 9.88, roi
= 0.32). This best supported model (Error Age ~ Stand age+ (Site)) had R2 = 0.64
(Table 2.2), even if about 35% of the variability remained unexplained. This model and the model without the random Site effect were similar (Anova; AICc values: 118.88 and 119.34 respectively; Chi-square: p
>
0.05). This indicates that aging error varied in the same way, regardless of site. Multi-model inference showed a significant increase of aging error with stand age (estimate = 0.01; Table 2.3). None of the other covariates significantly explained aging error (Table 2.3). Predictions based on the entire set of candidate models gave a minimum difference of 15 years and a maximum difference of 40 years between age at 1 rn and age at root collar (Fig. 2.2, mean ± SE: 26.2 years ± 7.0).The greater difference between age at 1 rn and total age of the trees in older stands could be explained by the continuous development of adventitious roots throughout their life (DesRochers and Gagnon 1997, Krause and Morin 2005), the progressive sinking oftrees under their own weight, or growing conditions that were less favorable to tree growth in the past (Arseneault and Payette 1997), as our data show that it took seedlings longer to reach 1 rn height in the oldest stands (Fig. 2.3). This difference between growth rates of old vs young trees was also observed by Fantin and Morin (2002) and Gagné (2000). Oldertrees germinated duringthe Little lee Age (1570-1880) which was colder and drier (Scott et al. 1988). Lavoie and Payette (1992) linked this period with a sustained decline in spruce growth, followed by warmer temperatures during the 20th century. Increasing atmospheric COz concentration, as well as increasing t emperatures and precipitations (Bradley et al. 1987, Houghton et al. 1990), have favored photosynthetic rates and lengthened plants' growing seasons (Lamarche
et al. 1984, Jacoby and D'Arrigo 1997, Bronson et al. 2009). Girardin et al. (2012)
observed a positive response in mature black spruce stands with these improved growth conditions, while over-mature stands were negatively impacted. Despite the lack of studies conceming juvenile stands, it could be expected that they also respond favorably to climate warming, making recently regenerated trees reach 1 rn height faster than in the past.