HAL Id: hal-00878652
https://hal.archives-ouvertes.fr/hal-00878652
Submitted on 30 Oct 2013
HAL is a multi-disciplinary open access
archive for the deposit and dissemination of sci-entific research documents, whether they are pub-lished or not. The documents may come from
L’archive ouverte pluridisciplinaire HAL, est destinée au dépôt et à la diffusion de documents scientifiques de niveau recherche, publiés ou non, émanant des établissements d’enseignement et de
Analysis of optical filtering in waveguides with a high
index modulation using the extended coupled mode
theory by hybridization of a matrix method
Kamal Ghoumid, Imen Elhechmi, S. Mekaoui, Christian Pieralli, Tijani
Gharbi
To cite this version:
Kamal Ghoumid, Imen Elhechmi, S. Mekaoui, Christian Pieralli, Tijani Gharbi. Analysis of op-tical filtering in waveguides with a high index modulation using the extended coupled mode the-ory by hybridization of a matrix method. Optics Communications, Elsevier, 2013, 289, pp.85 - 91. �10.1016/j.optcom.2012.10.008�. �hal-00878652�
Analysis of optical filtering in waveguides with a high
index modulation using the extended coupled mode
theory by hybridization of a matrix method
K. GHOUMID1,2,∗, I. ELHECHMI3, S. MEKAOUI4, C.Pieralli1 and T.
GHARBI3
1Institut Femto-ST D´epartement LOPMD, UMR CNRS 6174, Universit´e de
Franche-Comt´e, 16 route de Gray, 25030 Besan¸con, France.
2Ecole Nationale des Sciences Appliqu´ees d’Oujda (ENSAO), Complexe Universitaire,´
B.P. 669, 60000 Oujda - Morocco.
3Nanomedecine Lab, Universite de Franche-Comt´e, 16 route de Gray, 25030 Besan¸con,
France.
4 L.C.P.T.S. T´el´ecommunications, Facult´e d’ ´Electronique et d’Informatique, USTHB,
Alger 16111, Algeria.
∗kamal.ghoumid@univ-fcomte.fr
Abstract
In this paper the authors present an hybrid approach for the analysis of the optical filtering function in corrugated waveguide filters with a high index modulation. This approach is based on the hybridization of the extended couple mode theory (CMT) with the transfer matrix approach. The authors chose to treat the case of high index corrugation because in this case the the-ory elaborated before is not rigorously applicable. The proposed approach allows the calculation of the reflection coefficient and the full width at half maximum (FWHM) for any index modulation scheme. The hybridization of both methods mentioned above explains the impact and effects of opto-geometric parameters on the reflection coefficient and the bandwidth at mid-height. The theoretical results are verified by experimental measurements
realized on Ti:LiNbO3 waveguides with a high index modulation
experimen-tally implemented by engraving using Focused Ion Beam (FIB) process.
Keywords: Waveguide index modulation, Optical filtering, Diffraction
1. Introduction
The propagating waves in an optical waveguide which presents an undu-lation of its refractive index are partially or thoroughly reflected with gen-erating at a time an optical filter which can stop some waves with specific wavelengths ranges. This filter can also be considered as a reflector of some specific wavelength. Then , the produced waves are classified into two main
categories such as : a co-propagating wave wave ξ+
p(z) that propagates in the
direction of the incident propagation vector and another contra-propagating
wave ξ−
p(z) in the reverse direction [1, 2].
The relation between co-propagating and contra-propagating waves is de-termined by a coupling coefficient κ which explicitly describes the energy transfer between both kinds of waves [2, 3]. Among the various methods and techniques that can treat this phenomenon, we find the well known multi-layer process [4, 5, 6, 7], also called the matrix method [8, 9]. It is simply based upon the consideration of a series of N alternating bi-layers having different refraction indices. This technique is not so powerful because it does not allow the coupling calculation between both different propagating waves and does not take under consideration all of the physical parameters involved in the phenomenon especially the guidance properties of waves.
It should also be noted that many authors were concerned by solving nu-merically the Maxwell’s equations and were also responsible in making their solution answering reliably the treated problem. Note also that some rigor-ous methods have been formulated in order to calculate spectral properties of a deeply etched short Bragg grating in a comparatively high-contrast optical waveguide [10, 11], where a comparison of modeling approaches and verifica-tion of computer codes (modal, finite-difference time-domain (FDTD), and grating methods) used by different laboratories had been made. Few differ-ences were revealed; they showed up essentially identical results, and are thus believed to be highly reliable. This fact led to the possibility of accurate 2D numerical modeling of radiation losses of the slab PCs in more depth. The concept of the coupling modes theory [12], is another more powerful process as compared to the previous one. In a first step, it requires the calculation of the electric field at any space point of the propagating field. The process allows then the calculation of the index corrugation in a second step. In a third step, Maxwell’s equations are used to obtain the coupling equations whose solving cannot be possible without acceptable specific ap-proximations. The most difficult step of this theory is that it is conditioned
by a precise domain where approximations are validated [13]. The various conditions that are required to efficiently satisfy this technique are: (i) index modulation, which in fact is the variation of the refraction index between the guiding layer of the waveguide and its neighbors, must be weak; (ii) The product between the coupling coefficient κ and the perturbation length L, must be in the order of few unities [14, 15].
In this paper, we present a modified model which is based on the solving of Maxwell’s equations associated to the transfer matrix approach applied to high amplitude of index modulation in optical waveguides. This model can also be used with weak, medium or with high amplitude of corrugation in-dices. It implies no approximations and the theoretical predictions have been compared with experimental measurements. This concept can be considered as an extension of the coupled modes theory in the case of using high values of modulation indices. As a main application, we have used this concept to study Bragg Grating (B.G) created by an index perturbation inside a waveg-uide in order to calculate both the reflection coefficient and the bandwidth at mid-height.
This concept permits to know the influence and effect of the following pa-rameters: (i) The corrugation depth l; (ii) The period of the B.G; (iii) The
duty cycle ratio r; (iv) Bragg interference order m; (v) refraction index n3 of
the superficial layer. The simultaneous control of these parameters leads the fabrication of filters or reflectors in conformity with wished characteristics. The first aim is to study theoretically the calculation of the coupling coeffi-cient in order to control the different effects both on the reflection coefficoeffi-cient and the bandwidth. Then, we proceeded to the experimental measurements (see setup depicted in section III), in order to compare the theoretical results and measurements of B.G obtained by Focused Ion Beam (FIB) etching of a
Ti:LiNbO3 waveguide. The obtained experimental results are in good
accor-dance with those theoretically predicted [14]. 2. Model description and theory
2.1. Model description
Figure 1 shows a representation of the studied model where an index
corrugation is engraved inside a waveguide whose index is n2 and width is
d. Index modulation is characterized by a depth l, a period Λ and a duty
cycle r = W
Λ. The total number of periods is N. The length of corrugation is
wavelength so-called Bragg’s wavelength, according to the following equation [16, 17, 18]:
2 nef f Λ = m λB (1)
nef f is the effective index, m is the Bragg’s order and Λ the period of the
BG.
In this structure, we are only interested by the determination of the coupling coefficient that allows to obtain the values of the reflectivity and the fre-quency pass band by using Maxwell’s equations and mathematical methods especially those involving matrices. For that purpose, we should find out the expression of the electric field in the whole space surrounding the structure and that of the index variation [5, 6].
It should be noted that the resolution of this model can not be made by the CMT. Indeed, this theory is in fact a set of general approximations schemes used to describe a complex system in the best simplified manner. From the mathematical point of view, the perturbations theory is considered as a general method that roughly estimates an approximate solution to one math-ematical equation depending on an unknown parameter when a particular solution is well-known or derived. This method also consists in finding the most appropriate and approximate solution in terms of series expansions of the powers of the unknown parameter. The CMT is then a powerful tool which is based on Maxwell and perturbations theories. It allows the general behavior description of the perturbed systems. Nevertheless, as it requires a certain number of approximations, it appears necessary to duly verify the validation of these approximations when this theory is applied to specific physical configurations. Therefore, it appears that the CMT is based on the turning wave approximation concept and hence it can be rigorously appli-cable if and only if the approximation is made strictly valid. In the case of perturbed optical waveguides, this theory is applicable only if the index dif-ference is very small or feeble and inasmuch the variations of the amplitudes co-propagating wave A(z) and contra-propagating B(z) can be considered as constant at wavelength scale. Whereas in the case of high index difference ∆n, nothing can guarantee this approximation to be still valid.
2.2. Expression of the coupling coefficient κ
The coupling coefficient κ represents the energy transfer between the two types of waves which are propagated e.g. the co-propagating wave and the contra-propagating one that are generated by the index modulation is
Λ W l d Substrate Waveguide n n n L = N . x y z o 1 2 3 Λ
Figure 1: Substrate whose refractive index is n1. Waveguide : refractive index n2, width
d, period Λ, periods number N , length L = N Λ, corrugated index (n2− n3) and duty
cycle (cyclic ratio) r = W
Λ.
obtained with the help of the above defined variation. Its expression is given by the following equation :
κ = k 2 0(n22− n23) 2 π m β N2 sin µ mπ W Λ ¶ ( l 2+ sin(2 l2 h2h) +hq2[1 − cos(2 l2 h)] +hq22 h l2+ sin(2 l2 h2h) i + 1 q £ 1 − e−2 q l1¤ ) (2) With l1 = W Λ l (3) l2 = µ 1 −W Λ ¶ l (4)
It is obvious from equation (2) that the coupling coefficient depends on sev-eral parameters, namely: the depth of corrugation l; the duty cycle (cyclic
ratio) r; the Bragg order m; the index variation (n2− n3).
Based on the coupled modes theory, the expressions of the maximum reflec-tivity and the bandwidth at mid-height (Nyquist rate) are respectively given by, [19] :
∆λ = λ 2 B nef fL s 1 + µ κ L π ¶2 (6) However at this level, it is worth noting that equations (5) and (6) cannot
be applied in the case that the difference (n2 − n3) is high. In this case,
the approximation calculated in equation (5) is not respected. To treat one example like this depicted in figure (1), it is necessary to modify the classical coupled-modes theory by adding to this concept the matrix based process. This process is derived from the description of multilayer dielectric mirrors.
2.3. Use of matrix based method
The method consists in writing a matrix M on one period, then
obtain-ing the global matrix Mtot which represents the total corrugation by simply
writing Mtot = MN (the same basic motive M is repeated N times), where
N is the total number of periods. We can then derive a relation between
the fields E+ and E− respectively co-propagating and contra-propagating at
space points z = 0 and z = L, in terms of [20, 21] : µ E+(z = 0) E−(z = 0) ¶ =£M¤N µ E+(z = L) E−(z = L) ¶ (7) Where the M matrix elements are given by the followings, [5]:
m11 = h cosh(γL) + i∆β γ sinh(γL) i exp (−iβBL) m12 = − κ
γ sinh(γL) exp [−i (βBL + Φk)]
m21 = ¡ m1P12¢∗ m22 = ¡ m1P11¢∗ (8) With : ∆β = β − βB = β − π Λ (9) γ =pκ2− ∆β2 (10) Φk = Φk−1+ 2πLk Λk f or 0 ≤ k ≤ N (11)
It can easily find out the value of the reflectivity < at a given wavelength λ. This reflectivity is then defined by :
<(λ) = ¯ ¯ ¯ ¯MM21 11 ¯ ¯ ¯ ¯ 2 (12)
3. Opto-geometric parameters effects on reflectivity and bandwidth This theoretical approach was verified first by simulation to insure that the results are consistent with what physics predicts. In a second step, the simulation was used to define experimental parameters B.G realized on guide
Ti:LiNbO3 whose properties were measured.
3.1. Effects of corrugation depth l and Bragg’s order m
To study the effects of the Bragg order m and depth of corrugation l, simulations have been implemented to draw curves representing the coupling coefficient κ as a function of the depth of corrugation for different values of the Bragg order m and the reflectivity curve as a function of wavelength λ. These curves are shown in figures 2 and 3.
This increase of coupling coefficient induces an increase of bandwidth at half maximum ∆λ. On the other hand the maximum of reflectivity remains
constant <M ax(m = 1) ≈ <M ax(m = 3) ≈ <M ax(m = 5).
This result is logical and can be explained by the fact that the product κ L is constant for these different orders. We have κ(m = 1) > κ(m = 3) >
κ(m = 5), whereas this is the exact reverse for the total lengths L of the BG L(m = 1) < L(m = 3) < L(m = 5). Consequently κ(m = 1) L(m = 1) ≈ κ(m = 3) L(m = 3) ≈ κ(m = 5) L(m = 5).
Concerning the bandwidth, which is inversely proportional to the total length
L of the B.G, it decreases from order m = 1 to order m = 5.
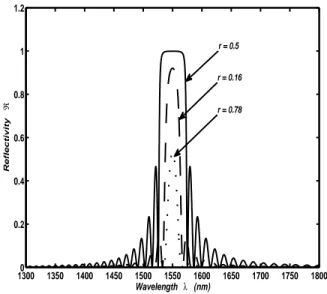
3.2. Effect of duty cycle r
The coupling coefficient κ also depends on the duty cycle r = W
Λ and
consequently on the values of reflectivity and bandwidth. This is clearly observed on figure 4 and figure 5 illustrated hereafter. It appears that this effect is periodic with a period T = 1/m and that its maximum value is
obtained whenever the duty cycle risatisfies equation (13) with 0 < i < m−1:
ri =
1
2 m +
i
m (13)
For example, if the Bragg order is m = 5, the maximum values of κ are
ob-tained for : r0 = 0.1 , r1 = 0.3 , r2 = 0.5 , r3 = 0.7 and r4 = 0.9 (see figure 5).
Consequently, the coupling coefficient κ is equal to zero when sin ³
m π r
´ = 0 that corresponds to the values r = 0.2 , 0.4 , 0.6 , 0.8 and 1.
It can be deduced that, for a duty cycle r = 1
0 0.5 1 1.5 2 2.5 10−8 10−6 10−4 10−2 100 Depth of corrugation l (µm) Coupling coefficient | κ | (µm − 1) m = 1 m = 7 m = 5 m = 3
Figure 2: Coupling coefficient κ versus the corrugation depth l for different values of
Bragg’s order m. (simulation data: n1 = 2.2112, n2 = 2.2174, n3 = 1, d = 5 µm and
r = 0.5).
equal to zero for an even order m = 2 , 4 , 6, .... For a duty cycle r = 1
3, the coupling coefficient κ is equal to zero for orders which are multiples of 3 i.e.
m = 3 , 6 , 9 , 12...
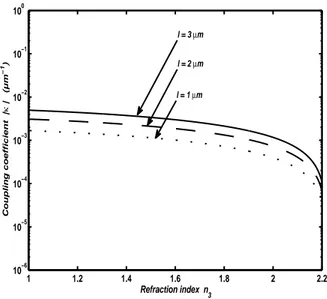
3.3. Effect of the refractive index n3 of the superficial layer
In this section, we are interested in studying the effect of the layer whose
index is n3. It is clear from equation (2), that this layer has an important
effect since the difference (n2− n3) appears in the coupling coefficient
expres-sion. We observe from the curves depicted in figure 6 and figure 7 that the coupling coefficient, the reflectivity and the bandwidth or the band pass are
decreasing when the index value n3 is increasing.
3.4. Effect of the periods number N
We have implemented and realized simulations in order to study the ef-fect of the periods number N. For this purpose, we have represented the variations of the reflectivity < versus the wavelength λ for different values of N. These simulations are illustrated in figure 8. The well-known theo-retical result taken in its domain of validity from the coupled modes theory
13000 1350 1400 1450 1500 1550 1600 1650 1700 1750 1800 0.2 0.4 0.6 0.8 1 1.2 Reflectivity ℜ Wavelength λ (nm) m = 3 m = 5 m = 1
Figure 3: Reflectivity < versus wavelength λ for different values of the Bragg’s order m.
(simulation data : n1= 2.2112, n2= 2.2174, n3= 1, d = 5 µm, r = 0.5 and N = 60).
for the multilayer pattern remains valid and correct in this new extended approach. Furthermore, it remains applicable to modulations characterized by high index values. In addition, this result asserts that reflectivity becomes considerably important when the periods number N increases. Nevertheless, this increase in reflectivity is done to the detriment of the mid- height band-width which in contrast diminishes when the periods number N increases. 4. Model Validation and authentication from the experimental
re-sults
4.1. B.G fabrication methods
Among the most well known methods for the fabrication of BGs, we can find the following methods such as [22, 23, 24, 25]: the photo-refractive method, the Reactive Ion Etching (RIE), or the Depth Reactive Ion Etching (DRIE), laser ablation, protonic exchange, holographic interferometer ods using for example a Sagnac Interferometer. The majority of these meth-ods requires long and heavy steps of fabrication like: mask design; lithogra-phy; resin development;engraving and so on.
0 0.1 0.2 0.3 0.4 0.5 0.6 0.7 0.8 0.9 1 10−8 10−7 10−6 10−5 10−4 10−3 10−2 10−1 100 Cyclic ratio r Coupling coefficient | κ | (µm − 1) l = 1 µm l = 2 µm l = 3 µm
Figure 4: The coupling coefficient κ versus the duty cycle r for different values of engraved
depth l.(simulation data : n1= 2.2112, n2= 2.2174, n3= 1, d = 5 µm and m = 5).
(FIB) for fabricating our B.G This technique drastically reduces the number of fabrication steps. Engraving is directly made in this case without involv-ing the use of a mask. Its main advantage is to offer the possibility to design very tiny B.G with dimensions lower than 50 nm. This level of performance is difficult to obtain with the previous cited methods[26, 27].
4.2. Waveguides and BG fabrication
The wave guide is fabricated by standard diffusion at a temperature of
T = 1020oC during 10 hours, a titanium ribbon of width 7 µm and of a
thickness of 80 nm deposited by sputtering on a sample of lithium niobate
(LiNbO3) of type : X-cut, Z propagation. The waveguide is single mode for a
central wavelength of about 1.55 µm and TM polarization. The dimensions
of this wave guide are: Width Wx = 4, 32 µm and Depth Wy = 3, 61µm
(These dimensions are measured at 1/e relatively to the maximum).
Once the waveguide is elaborated, the next step consists in engraving the B.G. This step is realized by the mean of the FIB technique. This technique of engraving is of an ionic type, it is realized step by step, period by period. The B.G obtained by FIB technique is presented in [14, 19]. This B.G. has a period of Λ = 1.75 µm and a width L = N . Λ = 20 × 1.75 = 35 µm. The
13000 1350 1400 1450 1500 1550 1600 1650 1700 1750 1800 0.2 0.4 0.6 0.8 1 1.2 Reflectivity ℜ Wavelength λ (nm) r = 0.78 r = 0.16 r = 0.5
Figure 5: Reflectivity < versus wavelength λ for different values of the duty cycle r.
(simulation data : n1 = 2.2112, n2 = 2.2174, n3 = 1, d = 5 µm, r = 0.5, m = 5 and
N = 65).
shape of the holes obtained by FIB engraving is illustrated in [14, 28]. We have to pay attention to the side wall profiles (left and right) obtained have an inclination in respect to the vertical. We have noticed that because of this slope, the cyclic ratio r does not remain constant; it increases with the depth of etching.
4.3. Reflectivity Measurements
The experimental setup that allows us to measure the reflectivity in terms of the wavelength is described in reference [14, 18]. It is composed by a con-tinuous spectrum source [850 − 1750] nm, a set of focusing components to inject light in waveguide, a polarizer to select the electric-field orientation, a beam splitter to separate the input light and the reflected light and an Optical Spectrum Analyzer (OSA).
To compare theoretical properties and experimental results, the variation of three parameters has been considered : The periods number N, the Bragg order m and the engraved depths l. Figure 9 represents the reflec-tivity curve versus the wavelength λ for different values of N. We can observe that reflectivity increases when the periods number N increases
1 1.2 1.4 1.6 1.8 2 2.2 10−6 10−5 10−4 10−3 10−2 10−1 100 Refraction index n3 Coupling coefficient | κ | (µm − 1) l = 1 µm l = 2 µm l = 3 µm
Figure 6: The coupling coefficient κ versus refractive index n3 for different values of
engraved depth l.(simulation data : n1 = 2.2112, n2 = 2.2174, d = 5 µm, m = 7 and
r = 0.5).
<(N = 80) ≈ 96% > <(N = 40) ≈ 75% > <(N = 30) ≈ 15%, and we
specifically get whereas the bandwidth decreases at half maximum ∆λ(N = 80) < ∆λ(N = 40) < ∆λ(N = 30).
Figure 10 represents the reflectivity versus the wavelength for different val-ues of l. It indicates that reflectivity increases when the engraved depth l increases <(l = 2.8 µm) ≈ 97% > <(l = 2 µm) ≈ 90% > <(l = 1.7 µm) ≈ 70%, and bandwidth at mid-height decreases when l increases ∆λ(l = 2.8 µm) < ∆λ(l = 2 µm) < ∆λ(l = 1.7 µm).
Figure 11 depicts the reflectivity curve versus the wavelength for different values of m. What is observed in this case is that reflectivity is approx-imately constant even if when Bragg’s order m increases <(m = 3) ≈
<(m = 5) ≈ <(m = 7) ≈ 97%, and bandwidth decreases when m decreases
∆λ(m = 7) < ∆λ(m = 5) < ∆λ(m = 3).
It is worth noting that these experimental results are shown in the curves of Figures 9, 10 and 11 confirm perfectly and are in good agreement with the theoretical curves found above.
Finally, it is important to observe that random parasites peaks appear on the reflectivity curves which are probably due to the roughness of the holes.
13000 1350 1400 1450 1500 1550 1600 1650 1700 1750 1800 0.2 0.4 0.6 0.8 1 1.2 Wavelength λ (nm) Reflectivity ℜ n3 = 1 n3 = 1.3 n3 = 1.9
Figure 7: Reflectivity < versus wavelength λ for different values of the refractive index n3.
(simulation data : n1= 2.2112, n2= 2.2174, d = 5 µm, m = 7, r = 0.5 and N = 60).
5. Conclusion
The main difficulty in manufacturing of integrated optical component is due to the multiplicity of technological operations. Each of then is difficult and it is imperative that they must be perfectly successful. The number of parameters used in these operations is very high. In addition, there is a strong interaction between these parameters. An experimental and system-atic study of the influence of these parameters to optimize performances of the integrated device is impossible to achieve due to the number of combi-nations.
A realistic theoretical description of physical phenomena in integrated optical that permits to write computing software simulating propagation of light is of an imperious necessity. Today, the best and complete description of prop-agation in waveguide is obtained by use of the Coupled Mode Theory. But, it appears, in very specific cases, that this theory does not give expected re-sults. Especially, when the index variation is high in a corrugated waveguide, the approximations of variation method cannot be validated. To overcome this difficulty that appears in the case of B.Gs fabricated by FIB technique, a hybridization of the coupled mode theory has been developed. It consists
13000 1350 1400 1450 1500 1550 1600 1650 1700 1750 1800 0.2 0.4 0.6 0.8 1 1.2 Reflectivity ℜ Wavelength λ (nm) N = 30 N = 40 N = 80
Figure 8: Reflectivity < versus wavelength λ for different values of the periods number N .
(simulation data : n1= 2.2112, n2= 2.2174, n3= 1, d = 5 µm, m = 5 and r = 0.5).
in evaluating the coupling coefficient on a period of B.G. and to repeat the result with the matrix method commonly used to describe multilayer model. This model applied to a B.G indicates how several parameters can act and be adjusted (corrugation depth l ; cyclic ratio r ; Bragg’s order m ; periods
number N ; refractive index n3 of superstrate) for mastering the coupling
between contra-propagating and co-propagating waves. It permits to control coupling coefficient, reflectivity and bandwidth.
Experimental measurements are in good accordance with predicted values supplied by this theoretical model. Thus, we have obtained a set of experi-mental parameters that allow to design reflectors whose reflectivity coefficient is close to 100% associated with different bandwidths at mid-height depend-ing on the needs.
1450 1475 1500 1525 1550 1575 1600 1625 1650 -30,0 -27,5 -25,0 -22,5 -20,0 -17,5 -15,0 -12,5 -10,0 -7,5 -5,0 l = 1.7 µm l = 2 µm l = 2.8 µm R e f l e c t i v i t y ( d B ) (nm)
Figure 9: Experimental reflectivity versus wavelengths for different depth corrugations l. References
[1] A. Yariv, ’coupled-mode theory for guided-wave optics’,, IEEE. J. Quan-tum Electronics, 9, (1973) 919 – 933.
[2] A. Yariv, P. Yeh, ’Optical Waves in Crystal: Propagation and control of Laser Radiation’,, New York,, New York, 1984.
[3] T. Suhara, H. Nishihara, ’integrated optics components and devices us-ing periodic structures’,, IEEE J. Quantum Electronics, 22, (1986,) 845 – 867,.
[4] M. McCall, ’on the application of coupled mode theory for modeling fiber bragg gratings’,, IEEE. J. Lightwave Tech. 2, (2000) 236 – 242. [5] W. Streifer, D. Scifres, R. Burnham, ’coupling coefficients for distributed
feedback single-and double-heterostructure diode lasers’,, IEEE J. Quan-tum Electronics, 11, (1975) 867 – 873.
1450 1475 1500 1525 1550 1575 1600 1625 1650 -30,0 -27,5 -25,0 -22,5 -20,0 -17,5 -15,0 -12,5 -10,0 -7,5 -5,0 N = 30 N = 40 N = 80 R e f l e c t i v i t y ( d B ) (nm)
Figure 10: Experimental reflectivity versus wavelengths for different period’s number N . [6] R. Burnham, D. Scifres, W.Streifer, ’single-heterostructure distributed-feed-back gaas-diode lasers’,, IEEE. J. Quantum Electronics, 11, (1975) 439 – 449.
[7] A. Hardy, W. Streifer, ’coupled mode theory of parallel waveguides’,, IEEE. J. Lighwave Tech. 3, (1985) 1135 –1146.
[8] J. Hong, W. Huang, T. Makino, ’on the transfer matrix method for distributed-feedback waveguide devices’,, IEEE. J. Lightwave Technol-ogy, 10, (1992) 1860 – 1868.
[9] B. Kim, E. Garmire, ’comparison between the matrix method and the coupled-wave method in the analysis of bragg reflector structures’,, J. Opt. Soc. 9, (1992) 132 – 136.
[10] A. Yariv, M. Nakamura, ’periodic structure for integrated optics’, IEEE J. Quantum Electron, 13, (1977,) 233 – 251,.
[11] R. P. P. B. R. B. R. D. R. R. S. G. K. J. P. C. P. L. J.-P. H. J. Ctyroky, S. Helfert, R. M. D. L. Rue, bragg waveguide grating as a 1d photonic
1450 1475 1500 1525 1550 1575 1600 1625 1650 -35,0 -32,5 -30,0 -27,5 -25,0 -22,5 -20,0 -17,5 -15,0 -12,5 -10,0 -7,5 -5,0 m = 7 m = 5 m = 3 R e f l e c t i v i t y ( d B ) (nm)
Figure 11: Experimental reflectivity versus wavelengths for different Bragg’s order m. band gap structure: Cost 268 modelling task’, Optics and Quantum Electronics, 34, (2002,) 455 – 470,.
[12] A. Sharma, P.-K. Mishra, A.-K. Ghatak, ’single-mode optical waveguide and directional couplers with rectangular cross section : A simple and accurate method of analysis’,, IEEE. J. Lightwave Tech. 6, (1988,) 1119 – 1126,.
[13] N. Matuschek, F. Krtner, U. Keller, ’exact coupled-mode theorys for multilayer interference coatings with arbitrary strong index modula-tions’,, IEEE J.Quantum Electron, 33, (1997,) 295 –302,.
[14] K. Ghoumid, R. Ferri`ere, B.-E. Benkelfat, B. Guizal, T. Gharbi, ’optical
performance of bragg gratings fabricated in Ti:LiNbO3 waveguides by
focused ion beam milling’,, IEEE, J. Lightwave Tech, 28 (2010) 3488 – 3493,.
[15] K. Ghoumid, R. Ferri`ere, B.-E. Benkelfat, S. Mekaoui, C. Ben-mouhoub, T. Gharbi, ’technological implementation fabry-p´erot cavity
in Ti:LiNbO3 waveguide by fib’, IEEE, Phot. Tech. Letters 24 (2012) 231 – 233.
[16] K. Hill, T. Fujii, D. Johnson, B. Kawasaki, ’photosensitivity in opti-cal fiber waveguides: Application to reflection filter fabrication’,, Appl. Phys. Let, 32, 32, (1978,) 647– 649,.
[17] T. Erdogan, ’fiber grating spectra’,, IEEE. J. Lighwave Tech. 15, (1997,) 1277– 1294,.
[18] R. Ferri`ere, B.-E. Benkelfat, J. Dudley, K. Ghoumid, ’bragg miroir
in-scription on LiNbO3 waveguides by index microstructuration’,, J. Appl.
45, (2006,) 1 – 9,.
[19] K. Ghoumid, R. Ferri`ere, B.-E. Benkelfat, G.Ulliac, R. Salut, J.-Y. Rauch, T. Gharbi, ’effect of depth etching on bragg grating reflector
realized by focused ion beam in Ti:LiNbO3 waveguides’,, J. SPIE, 7386
(2), (2009,) 1 – 6,.
[20] M. Yamada, K. Sakuda, ’analysis of almost-periodic distributed feed-back slab waveguide via a fundamental matrix approach’,, Appl. Opt., 26, (1987,) 3476 – 3478,.
[21] M. Prabhugoud, K. Peters, ’modified transfer matrix formulation for bragg grating strain sensors’,, IEEE. J. Lightwave Tech. 22, (2004,) 2302 – 2309,.
[22] C. Becker, A. Oesselke, A. Pape, W. Sohler, H. Suche, ’integrated optical
Ti:Er:LiNbO3distibuted bragg reflector laser with fixed photorefractive
grating’,, Opt. Letters, 23, (1998,) 1194 –1196,.
[23] B. Das, R.Ricken, W. Sohler, ’integrated optical distributed feedback
laser with Ti:Fe:LiNbO3 waveguide’,, Appl.Phys. Letters, 82, (2003,)
1515 –1517,.
[24] J. Sochtig, ’Ti:LiNbO3 stripe waveguide bragg reflector gratings’,, J.
Elect. Letters, 24, (1988,) 844 – 845,.
[25] Y. Sidorin, A. Cheng, ’integration of bragg gratings on LiNbO3 channel
[26] L. Pierno, M. Dispenza, A. Secchi, A. Fiorello, V. Foglietti, ’a lithium niobate electro-optic tunable bragg filter fabricated by electron beam lithography’,, J. Opt. A: Pure Appl. Opt. 10, (2008,) 1 – 6,.
[27] S. Yin, ’fabrication of high-aspect-ratio submicron-to-nanometer range
microstructures in LiNbO3 for the next generation of integrated
opto-electronic devices by focused ion beams (fib)’,, Microwave and optical technology letters. 22, (1999,) 396 – 398,.
[28] K. Ghoumid, B.-E. Benkelfat, R. Ferri`ere, T. Gharbi,
’wavelength-selective Ti:LiNbO3 multiple y-branch coupler based on focused ion
beam milled bragg reflectors’, IEEE, J. Light. Tech. 29 (2011) 3536 – 3541.