HAL Id: hal-02078872
https://hal-mines-paristech.archives-ouvertes.fr/hal-02078872
Submitted on 25 Mar 2019
HAL is a multi-disciplinary open access
archive for the deposit and dissemination of
sci-entific research documents, whether they are
pub-lished or not. The documents may come from
teaching and research institutions in France or
abroad, or from public or private research centers.
L’archive ouverte pluridisciplinaire HAL, est
destinée au dépôt et à la diffusion de documents
scientifiques de niveau recherche, publiés ou non,
émanant des établissements d’enseignement et de
recherche français ou étrangers, des laboratoires
publics ou privés.
The Price of Anarchy for Centralising or Decentralising
Freight Transport Organisation Through Serious Gaming
Mariam Lafkihi, Shenle Pan, Eric Ballot
To cite this version:
Mariam Lafkihi, Shenle Pan, Eric Ballot. The Price of Anarchy for Centralising or Decentralising
Freight Transport Organisation Through Serious Gaming. Manufacturing Modelling, Management
and Control - 9th MIM 2019™, 2019. �hal-02078872�
Organisation Through Serious Gaming
Mariam Lafkihi*, Shenle Pan*, Eric Ballot*
* Physical Internet Chair
MINES ParisTech, PSL Research University Centre de Gestion Scientifique, I3 - UMR CNRS 9217
60, boulevard Saint-Michel, 75006 Paris, France
(e-mail: mariam.lafkihi; shenle.pan; eric.ballot@mines-paristech.fr)
Abstract: Centralisation and decentralisation are the two common organisations in freight transport. The
first relies on a central authority who optimises and establishes transport plans for all carriers for global-interest, while the second lets carriers optimise their own transport plans for their self-interest. The outcome - efficiency and effectiveness - could be different. This paper aims to use the concept of Price of Anarchy (PoA) to compare the outcome of the two organisations. Due to the complexity of actual freight transport market, this paper adapts the gamification methodology to investigate the two organisations. A freight transport game was developed for simulation. The outcome of the two simulated organisations – centralisation or decentralisation – are then compared. The results show that the centralisation outperforms in terms of global efficiency and effectiveness; while decentralisation is better individual incentive. However, the PoA varies depending on information revealed. Copy- right © 2019 IFAC
Keywords: Freight Transport, Organisation, Centralisation or Decentralisation, Price of Anarchy, Physical
Internet, Gamification
1. INTRODUCTION
In freight transport, centralisation and decentralisation are the two common organisations in practice (Gansterer and Hartl, 2018; Klaas-Wissing and Albers, 2010; Pan, 2017). Centralisation relies on a central authority who optimises and establishes transport plans for all carriers within the organisation for global-interest. For optimisation sake, the authority should collect complete information about the
market and participants. Differently, decentralised
organisation lets carriers optimise their own transport plans for their self-interest - selfish decisions; and the carriers do not have to give out private information. The outcome of the two models could be very different in terms of efficiency and effectiveness (Li et al., 2015).
Decentralisation is one of the recent observable trends in logistics and freight transport. This is because, on one hand, nowadays logistics is more and more challenged by omni-chanel distribution and fast delivery to customers. As a result, decision making in logistics should be agile and closer to the demands (Pan, 2017). On the other hand, recent logistics paradigms also aim at decentralising logistics organisation for agility and sustainability, such as Physical Internet (Ballot et al., 2014), Cyber Physical System (Cardin et al., 2017), Smart Logistics (Wong et al., 2002). Finally, centralised optimisation is not tractable for a computation point of view neither accepted by independent companies. These paradigms are catalysed by new techniques and technologies like online transport marketplaces, IoT/ICT, or Big Data analytics.
Despite aforementioned theoretical advantages, the
performance - efficiency and effectiveness - of
decentralisation still needs to be further investigated for freight transport, comparing with centralisation. In this paper we study two questions, first how to measure the performance of centralised or decentralised organisation, and second how the strategy convergence will affect the performance of decentralised organisation. The concept of Price of Anarchy is used for performance comparison. We aim to obtain some constructive and practical guidance and implications for companies who consider centralising or decentralising the transport management, and to better understand the trade-off between global performance and individual incentive. To this end, we adopted the gamification methodology and developed an online freight transport game, in order to realistically simulate the complex transport market and carrier’s decision. Section 2 presents briefly some related literature. Then, Section 3 presents the game developed in this study; and Section 4 gives some results from experimentations with real players. Finally, Section 5 will conclude this work.
2. LITERATURE REVIEW
2.1 Freight Transport Organisation: centralised or decentralised
The difference between centralised and decentralised transport can be described as follow: actors (shippers and carriers) act as one single integrated company in a centralised organisation, while in a decentralised organisation they act as independent (collaborating or competing) companies (Klaas-Wissing and Albers, 2010). Such difference implies that the two models perform also differently. Centralisation may outperform in terms of efficiency and effectiveness, while decentralisation may improve the flexibility, acceptance, scalability and agility.
Therefore, companies have to select their own organisation in accordance with their business model and activities.
In the literature of freight transport, the two models have been widely discussed in carrier horizontal cooperation for transport request exchanging in coalition/alliance (Houghtalen et al., 2011; Zhou et al., 2011). In centralised organisation, all requests are put into a common pool so that a central authority can establish optimal transport plans and propose them to all carriers. In decentralised organisation, carriers may first evaluate their own requests and submit those uninterested to the common pool for exchanging or sub-contracting. This practice is close to the setting of our game. But we focus more on empirical approach rather than theoretical modelling, via collecting actual decisions of agents.
2.2 Price of Anarchy
The concept of Price of Anarchy (PoA) has been widely used in economics and in game theory and mechanism design theory, to measure the performance degradation of a system due to the selfish decisions made by independent agents (Koutsoupias and Papadimitriou, 1999). As it is, it has also been used to compare the performance of centralised system (that yields the optimal social welfare) and decentralised system (that could lead to the worst Nash equilibrium), for example in traffic congestion games (Christodoulou and Koutsoupias, 2005; Roughgarden, 2005). Nevertheless, the concept has been rarely used in the domain of logistics and only few related studies can be found. One possible reason is decentralisation has been investigated for logistics only since the last years, and it is mostly studied for cooperation and resource sharing. For example, in the doctoral work in Ding (2017), they compare centralised and decentralised organisation models in a warehouse shared by multi-retailers. Ye et al. (2016) study reverse supply chain and they employ PoA to measure the efficiency of two collectors under centralised or decentralised competitive environment. Some studies focus on vertical supplier-clients dyadic relations in supply chain (Perakis and Roels, 2007). Particularly, Perakis and Sun (2012) claim that decentralised supply chain loses at least 25% of the optimal profit due to the double marginalisation phenomenon. However, the concept has been rarely studied for freight transport, and in real practice in particular.
This paper follows the definition of PoA proposed in Ding (2017), which is the ratio of optimal decentralised cost to the
optimal centralised cost. This definition is slightly different to
the original that is the ratio of the worst Nash equilibrium (i.e. the highest cost in decentralised organisation) and the optimal centralised solution (Koutsoupias and Papadimitriou, 1999). The main reason is that players in the game may propose very high price to a transport request so that it is unreasonable to compute the highest total cost. Moreover, in a real transport market involving many players, it is unlikely possible to compute the set of Nash equilibrium.
3. METODOLOGY
The methodology of gamification is adapted in this study for two main reasons. First, due to the complexity of actual freight transport market that is highly dynamic and open to many
players (e.g. carriers, shippers, coordinators), it is very difficult to apply the two models for a real life case study. Second, serious gaming is often considered as an effective approach to simulate real-life cases that are highly complex (Hamari et al., 2014).
3.1 Game description
The "Freight Transportation Game" is a role-playing simulation of an industrial distribution system developed at
MINES ParisTech - PSL to investigate the centralised and
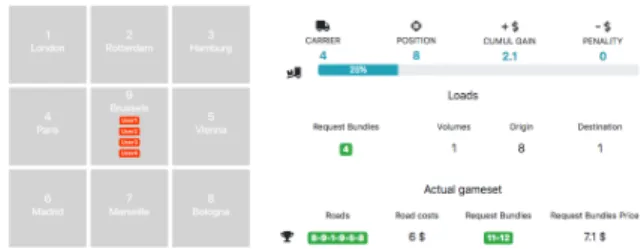
decentralised models in real practice and to specify the functioning of the less than truck load freight transport market. The aims of the game are to find the optimal allocation of resources that minimises the overall cost of the transport market by taking into account the interest of each player. The game is played online or on a board which portrays the freight transport network (Fig. 1). Regions are represented by a map and requests are manipulated by the carriers.
Fig. 1. Freight transport network and online user interface The requests in the network repeat regularly on a periodic basis (e.g. a day). The carriers must place bids on bundles of requests within a combinatorial auction process. We assume that requests can be bundled for cost reduction, thanks to economy of scale (Gansterer and Hartl, 2016). These auctions take place at the beginning of every period and involve requests that must be served. Each of the auctions is a single-round, sealed-bid, first-price combinatorial auction. The game is then played during several periods. In a given period, the process is as follows. Several new requests are generated randomly with their information by the game organiser, who creates an auction pool of all requests and communicates them to the carriers. According to their private information (position, capacity, cost function, etc.), carriers analyse requests by determining the feasible request bundles and bid on bundles that interest them. Once the carriers have validated the bids, they are submitted to the organiser via a web interface and a winner determination model will take place to make the decision in a way to minimise the global cost. Finally, the freight allocations are sent to the carriers, and the auction process is closed for the period. Then, the game is organised on 2 steps: 1) the bundling optimisation model and 2) the bundles allocation optimisation model (Fig. 2).
In order to guarantee service in the network, no halfway drop-outs are allowed in the game, meaning that allocation will happen if and only if the request can be fully met. To do this, a carrier should submit a price that covers the entire route. In other words, the carrier must be able to deliver the shipment to its final destination at the proposed price. The route of request could be modified after auctioning, by the responsible carrier. The objective of the bundles allocation optimisation model is to maximise global profit. If there is more than one carrier offering a price, the shipment should be allocated to the lowest price (if two bidders are tied for the lowest price, then an arbitrary choice will have to be made).
3.2 Game notation
The game is played on a 3x3 regions map representing the market transport network, by several players and during several periods. Let N denotes the number of periods played. The transport network is consisting of multiple shippers, multiple carriers, an organiser, and multiple hubs. We assume that the network is an undirected and connected network.
We denote the set of all requests’ routes by Rt. A route rtÎRt
could be composed by several arcs, for example the route 1-2-3-4 is composed by 3 arcs{1-2; 2-3; 1-2-3-4}. We denote the set of
arcs of a route rtÎRt by Art = {a1,…,ak}.
We assume that the route of requests is not predetermined - carriers could choose any route on the network to transport requests from origin to destination. For example, to transport a request from 1 to 8, a carrier could take the routes {1-2-3-8}, {1-2-5-8}, {1-9-8},{1-6-7-8}, etc.
Let Rn denotes the set of all transport service requests
(commodities) in a given period n∈N. Rn is composed of 2
subsets, Rn=NRn ∪ ORn, and
1. NRn denotes the set of all new transport service requests
(commodities) generated randomly in a period n∈N.
2. ORn denotes the set of all previous transport requests
generated in previous periods, transported by carriers, and that have not yet arrived at their destination.
Each O–D demand corresponds to an individual indivisible
request r∈Rn. For a given r, or and dr denote its origin and
destination hubs, respectively. Vr denotes its volume, and LTr
denotes its delivery lead time, which represents the number of periods after what the request should be delivered. If delivery
is delayed, a penalty cost of 𝑃𝐶%&,%( for this request will be paid
by the carrier. We assume that the request r∈Rn could take any
path between its origin and its destination.
Let M denotes the set of carriers, and Cmax denotes the maximal
capacity of a carrier m∈M. We assume that all carriers have
the same maximal capacity Cmax at the beginning. If we define
a truck as a carrier, then each carrier’s capacity will be limited
to a truckload which is Cmax. Hereafter, we maintain the
assumption that a truck is equivalent to a carrier.
We define the residual capacity for a carrier per arc, and let
𝐶𝑅+(,∈-./ denotes the residual capacity of carrier m in arc ai∈Art
of the route rt.
In this game we do not take into consideration the set of shippers. All shippers’ requests are generating randomly in
each period n∈N. And shippers will accept the lowest price
proposed by the carriers.
3.3 Request bundling model
First, each carrier should determine what RBs (request bundles which are the sets of individual requests) from the pool are feasible for him, insofar as they meet two conditions: route compatibility and capacity.
A carrier must be able to transport his shipments to the final destination. It means that only the requests with origins and destinations along the same route that can be jointly delivered by one truck are compatible (local vehicle routing is not
considered here). A RB is transported via a route rtÎRt if and
only if, the route contains the origins and destinations of all requests in the bundle, and with constraint that, for each request, the position of its origin in the route is prior to its destination. If we assume that, in the period n, a carrier m is still transporting the requests from previous periods to their
destinations (𝑂𝑅(1 ⊆ 𝑂𝑅1) , the feasible request bundles
should contain these previous requests, and the carrier should take into account the determined route and the previous requests when choosing the feasible request bundles.
Considering each carrier in a period n has a limited capacity (maximal or residual capacity), carriers will only consider the RBs that they can handle (as task reservation is not allowed here). The total volume of requests transported by a carrier should not exceed the capacity of the carrier in all the arcs of a determined route. Each carrier should take into account his capacity information to choose RBs of interest.
Finally, only RBs that meet both conditions are considered
feasible. For a carrier m, let RBm
rt denotes the set of all feasible
request bundles in the route rt∈Rt, then RBm
rt={Rb1,…, Rbk}.
Let 𝑉%&,56, denotes the volume of the request bundle Rbi∈RBrt
in the route rt∈Rt, then
𝑉%&,56,= +<∈-./ %∈5;,%∈56,𝑉%𝑦9,:; ∀𝑟𝑡 ∈ 𝑅𝑡
Where yk,i is a binary variable with yk,i=1 if the request r∈Rbi
is transported in the arc ak∈Art, and =0, otherwise.
All the feasible request bundles in the route rt∈Rt verified the
two aforementioned conditions:
∀ 𝑚 ∈ 𝑀, 𝑖𝑓 𝑂𝑅(1 ≠ ∅ 𝑡ℎ𝑒𝑛 ∀ 𝑅𝑏:∈ 𝑅𝐵%&(, 𝑂𝑅(1 ⊆ 𝑅𝑏: 𝑉%𝑦9,: %∈5;,%∈56 , ≤ 𝐶𝑅+<∈-./ ( ; ∀ 𝑚 ∈ 𝑀, ∀𝑎 9∈ 𝐴%&, ∀𝑅𝑏:∈ 𝑅𝐵%&(
Total transport cost of request bundles
Let 𝐶𝑜𝑠𝑡%&,56( , denotes the cost for transporting the request
bundle Rbi∈RBrt in the route rt by the carrier m. The estimated
transport cost of a request bundle is composed by two parts:
𝐶𝑜𝑠𝑡%&,56, ( = 𝐶𝑡𝑟 %&,56, ( + 𝑃𝐶 %&,56, ( ; ∀ 𝑚 ∈ 𝑀, ∀ 𝑟𝑡 ∈ 𝑅𝑡
The first part 𝐶𝑡𝑟%&,56( , represents the transport cost of the RB.
For the sake of clarity, we assume that the cost of transporting a bundle in a route rt is constant for each movement and the
same for all carriers. This cost does not depend on the volume of RB but on the travelled distance. It can be calculated by:
𝐶𝑡𝑟%&,56, ( = 𝐶𝑡𝑟
%&(= 𝐶&% +<∈-./𝑥9∗ 𝑑9
Where Ctr is a constant representing the transport cost for using
a truck. xk is a binary variable representing the existence of a
detour; xk=1 if the arc ak∈Art is a detour, and =0 otherwise. dk
is the distance of arc ak∈Art. To simplify, we assume that in the
game for each arc ak, dk=1 distance unite, i.e. 1km.
The second part 𝑃𝐶%&,56( , is the penalty cost of delayed
delivery. It is equal to the sum of penalty cost of each request in the request bundle. If a carrier m transports a request bundle which contains some requests with a delay (of which the transport time of a request exceeds the lead time), the carrier will pay a penalty cost of:
𝑃𝐶%&,56,
( = 𝑃𝐶
%&,%( %∈5;,%∈56
, ; ∀ 𝑚 ∈ 𝑀, ∀ 𝑟𝑡 ∈ 𝑅𝑡 3.4 Allocation optimisation model
Auction is adapted for request allocation. First, we should define the bidding language that represents the bidders’ preferences. According to the rules, once a carrier has won a request, he should handle the request all of the way to the final destination. Considering that carriers have limited capacity, no more than one feasible request bundle should be allocated to each carrier and the request bundle should have the highest volume and thus the lowest cost rate. This is the XOR bidding language, as defined by Lehmann et al. (2006). For example, a
carrier submitting a bid (𝑅𝑏U,𝑃%&,56V
( ) XOR (𝑅𝑏
W,𝑃%&,56X
( )
...XOR (𝑅𝑏9,𝑃%&,56( <) means that the carrier wants to deliver
only one of the bundles Rb1 to Rbk. In other words, even though
carriers bid for each bundle in an auction, they can only win one bundle. To solve this allocation problem, a Winner Determination Program is needed.
The second step is to model the Winner determination
problem (WDP). Therefore, the model used for request
allocation is defined as follows:
𝑚𝑖𝑛 𝑃%&,56< ( 𝑦 %&,56< ( 56<⊆5Y./Z %&∈5& (∈[ (1) Subject to 𝑦%&,56< ( 56<⊆5Y./Z ≤ 1, ∀ 𝑚 ∈ 𝑀, %&∈5& (2) 𝑦%&,56< ( = 1, ∀ 𝑟 :∈ 𝑁𝑅1 56<⊆ 5Y./Z; %,∈56< %&∈5& (∈[ (3) 𝑦%&,56< ( ∈ 0,1 , ∀ 𝑚 ∈ 𝑀, ∀ 𝑟𝑡 ∈ 𝑅𝑡 , ∀ 𝑅𝑏 9⊆ 𝑅𝐵%&( (4)
Where 𝑃%&,56( < is the price proposed by carrier m to transport
the request bundle Rbk in the route rt. yde,56f <are binary
decision variables with yde,ghf i= 1 if in route rt the request
bundle Rbk is allocated to the carrier m and = 0 otherwise.
Equation (1) is the objective function to minimise the total cost of the market, which is calculated by the minimal total prices proposed by carriers after allocating all request bundles. Constraint (2) guarantees that each carrier transports at most one bundle. Constraint (3) guarantees that each request will be allocated at most to one route at a time.
3.5 Scenarios of Gaming
Three scenarios have been played to compare the outcome of the centralised and decentralised models. It is important to note that, as input for all scenarios, transport requests and carrier maximal capacity are the same. The only difference of input is the price proposed by each carrier, and, therefore, transport plans and output are also different, as well as the total cost.
Scenario 1 represents the centralised model. In such model, a
central authority will optimise globally the transport (e.g. minimising the total transport cost), and propose transport plans to all carriers. The later will execute exactly the plans proposed. For optimisation, the authority should have complete information of the market (all requests) and of the carriers (position, capacity, fare rate). In this scenario, the prices of RBs are calculated and proposed by the centralised authority according to the market. As it is, this scenario can be considered as the optimal solution, and the upper bound of the level of performance.
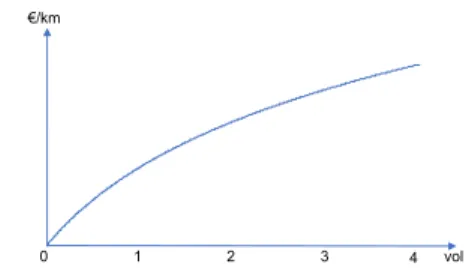
Fig. 3. Transport price (€/km) applied in Scenario 1 In this scenario, a concave nonlinear function of volume is used to calculate the price per distance unit (per km) of a RB, i.e., €/RB-km (see Fig. 3). The nonlinearity is due to the transport synergies (i.e. economy of scale) generated by bundling requests. The function can be described as follows:
𝑃+<,56, ( = 𝑓(𝑉
+<,56,); ∀ 𝑚 ∈ 𝑀, ∀ 𝑎9∈ 𝐴%&, ∀ 𝑅𝑏:∈ 𝑅𝐵%& (
Where Pkfi,ghl is the price per km of the bundle 𝑅𝑏
:∈ 𝑅𝐵%&(
proposed by carrier m in the arc ak∈Art. 𝑉+<,56, is the volume
of the request bundle 𝑅𝑏:∈ 𝑅𝐵%&( in the arc ak∈Art. The
parameters of the function f will be later defined in the experimentations.
Then the price of the request bundle 𝑅𝑏:∈ 𝑅𝐵%&( proposed by
carrier m in route rt could be written:
𝑃%&,56, ( = 𝑃 +<,56, ( ∗ 𝑑 9 +<∈-./ + 𝑃𝐶%&,56, ( ; ∀ 𝑚 ∈ 𝑀, ∀ 𝑟𝑡 ∈ 𝑅𝑡, ∀ 𝑅𝑏:∈ 𝑅𝐵%&(
Where 𝑃𝐶%&,56( , is the penalty cost of the bundle 𝑅𝑏
:∈ 𝑅𝐵%&(
proposed by carrier m in the route rtÎRt.
Scenario 2 represents the decentralised model with no shared
information. In such model, each carrier will optimise his transport plans, by determining the feasible request bundles and selecting the most interesting ones to him. Carriers set up a bidding price for each feasible bundle of his own interest depending on their private strategies (margin, capacity, etc.), then submit it to the auctioneer (or the organiser of the market). Their decision here is therefore selfish without considering global interest. Then, the auctioneer will take into account all summited prices to allocate requests to carriers by minimising the total transport cost. In other words, the auctioneer is only responsible for request allocation, and not for route planning
0 1 2
€/km
and cost or price calculation. In particular, we assume in this scenario that no information is shared between carriers. A carrier does not know the private information of the others, e.g. capacity, current position, margin.
Scenario 3 represents the decentralised model with limited
sharing of information. In particular, we are interested in the question of how the strategy convergence will affect the performance of decentralised organisation. For that, we decide to disclose the average margin of all carriers of Scenario 2 before running Scenario 3. In other words, this scenario has the same characteristics than the Scenario 2, the only difference is that, in Scenario 3 the auctioneer will communicate to carriers the average margin of the transport market, and let carriers take this information into consideration when proposing prices for request bundles.
4. SIMULATION AND EXPERIMENTAL RESULTS
4.1 Description
This part presents an experimental study to compare the transport plans of carriers between the three scenarios. As the auction mechanism in this paper is based on the optimisation model mentioned above, we adopted Matlab® to develop an optimisation-based simulation model to optimise and simulate a sequence of auctions. Both bidding and auctioning proxy agents are integrated into the model.
For the three scenarios, we use the same inputs (transport requests and capacity). For each scenario, 10 rounds have been played with 4 players (carriers). The maximal capacity of a truck is 4 units, and the penalty cost is 5€/order/ period.
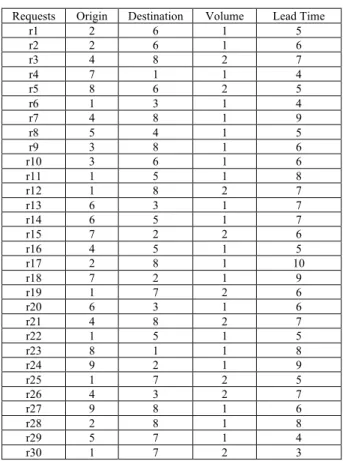
Table 1. Input transport requests for 10 rounds (3 new requests in each round)
Requests Origin Destination Volume Lead Time
r1 2 6 1 5 r2 2 6 1 6 r3 4 8 2 7 r4 7 1 1 4 r5 8 6 2 5 r6 1 3 1 4 r7 4 8 1 9 r8 5 4 1 5 r9 3 8 1 6 r10 3 6 1 6 r11 1 5 1 8 r12 1 8 2 7 r13 6 3 1 7 r14 6 5 1 7 r15 7 2 2 6 r16 4 5 1 5 r17 2 8 1 10 r18 7 2 1 9 r19 1 7 2 6 r20 6 3 1 6 r21 4 8 2 7 r22 1 5 1 5 r23 8 1 1 8 r24 9 2 1 9 r25 1 7 2 5 r26 4 3 2 7 r27 9 8 1 6 r28 2 8 1 8 r29 5 7 1 4 r30 1 7 2 3 4.2 Results of gaming
We now discuss the results from experimentations for the three scenarios. It is important to notice that only the preliminary results obtained by the 10 rounds of games are discussed at this stage. More experimentations are expected to further enhance the results and conclusions very soon. At this stage, we discuss two types of KPIs: effectiveness and efficiency.
Table 2. Results of the scenarios
KPI Sc.1 Sc.2 Sc.3 Effectiveness Unallocated Requests 0 (0%) 5 (17%) 3 (10%) Total delays 0 3 15 Efficiency Total cost 92 105 179 Total price 105 125 202 Total gain 13 20 23 Total vol-km 77 81 84 Mean fill rate 53,47% 42,36% 48,65%
• Total number of unallocated requests that can be seen as the service rate is an important KPI of effectiveness. In Sc1, all requests must be allocated if the market has enough capacity (the constraint (3)). While in Sc2 and Sc3, a request may not be allocated or serviced for 2 reasons: 1) lack of capacity (due to the decentralised organisation) or 2) no one is interested in the request because its lead time is very short or because it is so far from his current position (the request will be allocated to a dummy player to respect the constraint (3)). We can see that Sc1 of centralisation has100% service rate, while it is 83% in Sc2 and 90% in Sc3.
• Total number of delays as another KPI of effectiveness represents the total cumulative delays of requests. Again, Sc1 of centralisation outperforms with zero delay. Surprisingly, Sc3 has generated much more delays. After checking the output, it was because two of the five unallocated requests in Sc2 have been allocated in Sc3. As they have very short lead-time, in Sc2 no carrier was interested; but some have submitted price for them in Sc3. More experimentations are necessary to explain the strategy change.
• Total cost is composed by the total transport cost of all requests and the total penalty cost. The first is calculated by 2€*travelled distance of carriers, and the second is calculated by 5€*total delays. We can see that Sc1 has generated the minimum cost; while Sc3 has yielded much higher cost, mainly due to the total delay cost.
• Total Price is the sum of total cost and total gain of players; and it is minimised by the objective function (1). To compare the scenarios, the average margin of Sc2 is applied in Sc1 (the price function in Fig. 3) to compute the total cost and gain; and it is disclosed at the beginning of Sc3. We can observe that Sc2 and Sc3 has yielded higher total price and gain than Sc1. In other words, even Sc1 may lead to minimal total cost and price, Sc2 and Sc3 would be more interested for carriers to participate. The later scenarios are therefore more individual incentive.
• Total vol-km in the game (similar to ton-km) represents the sum of the volumes transported by carriers. Recall that each move equals to 1km, so that moving 2 volumes at one move
equals to 2 km. To be able to compare this KPI, the vol-km of the unallocated requests in Sc2 and Sc3 (5 and 3 respectively) are added onto the results of the scenario, respectively; and we assume that these requests are delivered without detour. Again, Sc1 of centralisation performs better than the other scenarios.
• Mean fill rate is another transport efficiency KPI of importance. The results of the game may not well reflect the actual fill-rate in trucking industry, as the ratio of transport demand to theoretical capacity in the game is around 71%, that means the market designed for the game is significant overcapacity. Nevertheless, it can be easily observed that Sc1 has the best mean fill-rate.
Regarding PoA, several interpretations are possible according to the KPIs. As defined in Section 2.2, we may calculate the PoA as ratio of optimal decentralised cost to the optimal centralised cost, which is 1.14 for Sc2, and 1.94 for Sc3 comparing to Sc1. It implies that the Sc3 of decentralisation with disclosing margin information costs higher in efficiency, even it is better individual incentive. The PoA will be different if we compare with different KPIs, e.g. service rate, fill rate. But the aforementioned conclusion is always correct. However, before deriving insightful conclusions and practical implications from the results, further investigations are necessary, for example to exclude some random factors.
5. CONCLUSIONS
This research investigates the performance difference of centralisation and decentralisation in freight transport allocation. A serious game is developed to simulate the two organisations, in order to gather data that reflects the real market and practice. At this stage, the preliminary results section shows that the centralised model always outperforms in terms of global efficiency and effectiveness and it yields the optimal social welfare; while decentralisation has better individual incentive for carriers, in terms of individual gain and flexibility.
Serval contributions have been made to the literature. First, we apply the gamification methodology and the concept of PoA to assess the performance of the two organisations. The innovative methodology may help researchers and practitioners better understand the challenges and stakes in the two organisations. Second, the developed game provides an efficient way to gather data for the future research work, for example to test hypotheses in collaborative mechanism, to gather data to empirically study carriers’ behaviour. The game can also be used for teaching purpose, as it can help students understand the complex decision making in freight transport market and effectiveness of pricing strategies.
REFERENCES
Ballot, E., Montreuil, B., Meller, R., 2014. The Physical Internet: The Network of Logistics Networks. La documentation Française, Paris, France.
Cardin, O., Ounnar, F., Thomas, A., Trentesaux, D., 2017. Future Industrial Systems: Best Practices of the Intelligent Manufacturing and Services Systems (IMS2) French Research Group. IEEE Transactions on Industrial Informatics 13, 704– 713. https://doi.org/10.1109/TII.2016.2605624
Christodoulou, G., Koutsoupias, E., 2005. The price of anarchy of finite congestion games, in: Proceedings of the Thirty-Seventh Annual ACM Symposium on Theory of Computing. ACM, pp. 67–73.
Ding, S., 2017. Centralized and Decentralized Warehouse Logistics Collaboration. UC Berkeley, 144.
Gansterer, M., Hartl, R.F., 2018. Collaborative vehicle routing: A survey. European Journal of Operational Research 268, 1–12. https://doi.org/10.1016/j.ejor.2017.10.023
Gansterer, M., Hartl, R.F., 2016. Request evaluation strategies for carriers in auction-based collaborations. OR Spectrum 38, 3–23. https://doi.org/10.1007/s00291-015-0411-1
Hamari, J., Koivisto, J., Sarsa, H., 2014. Does gamification work?–a literature review of empirical studies on gamification, in: 2014 47th Hawaii International Conference on System Sciences (HICSS). IEEE, pp. 3025–3034.
Houghtalen, L., Ergun, Ö., Sokol, J., 2011. Designing mechanisms for the management of carrier alliances. Transportation Science 45, 465–482.
Klaas-Wissing, T., Albers, S., 2010. Cooperative versus corporate governance of LTL networks. International Journal of Logistics Research and Applications 13, 493–506.
Koutsoupias, E., Papadimitriou, C., 1999. Worst-Case Equilibria, in: Meinel, C., Tison, S. (Eds.), STACS 99. Springer Berlin Heidelberg, pp. 404–413.
Lehmann, D., Müller, R., Sandholm, T., 2006. The winner determination problem, in: Combinatorial Auctions. The MIT Press, pp. 297–317.
Li, J., Rong, G., Feng, Y., 2015. Request selection and exchange approach for carrier collaboration based on auction of a single request. Transportation Research Part E: Logistics
and Transportation Review 84, 23–39.
https://doi.org/10.1016/j.tre.2015.09.010
Pan, S., 2017. Horizontal Collaboration for Sustainable Transport and Logistics. Université de Valenciennes et du Hainaut-Cambrésis, Valenciennes, France.
Perakis, G., Roels, G., 2007. The Price of Anarchy in Supply Chains: Quantifying the Efficiency of Price-Only Contracts.
Management Science 53, 1249–1268.
https://doi.org/10.1287/mnsc.1060.0656
Perakis, G., Sun, W., 2012. Price of anarchy for supply chains with partial positive externalities. Operations Research Letters 40, 78–83. https://doi.org/10.1016/j.orl.2011.11.008
Roughgarden, T., 2005. Selfish routing and the price of anarchy. MIT Press, Cambridge, Mass.
Wong, C.Y., McFarlane, D., Ahmad Zaharudin, A., Agarwal, V., 2002. The intelligent product driven supply chain. Presented at the Systems, Man and Cybernetics, 2002 IEEE International Conference On, IEEE, p. 6 pp. vol. 4.
Ye, Y.-S., Ma, Z.-J., Dai, Y., 2016. The price of anarchy in competitive reverse supply chains with quality-dependent price-only contracts. Transportation Research Part E: Logistics and Transportation Review 89, 86–107. https://doi.org/10.1016/j.tre.2016.03.002
Zhou, G., Hui, Y.V., Liang, L., 2011. Strategic alliance in freight consolidation. Transportation Research Part E:
Logistics and Transportation Review 47, 18–29.