HAL Id: hal-02668285
https://hal.inrae.fr/hal-02668285
Submitted on 31 May 2020
HAL is a multi-disciplinary open access
archive for the deposit and dissemination of
sci-entific research documents, whether they are
pub-lished or not. The documents may come from
teaching and research institutions in France or
abroad, or from public or private research centers.
L’archive ouverte pluridisciplinaire HAL, est
destinée au dépôt et à la diffusion de documents
scientifiques de niveau recherche, publiés ou non,
émanant des établissements d’enseignement et de
recherche français ou étrangers, des laboratoires
publics ou privés.
Copyright
wheat grains and soil
Denis Baize, Lise Bellanger, Richard Tomassone
To cite this version:
Denis Baize, Lise Bellanger, Richard Tomassone. Relationships between concentrations of trace
met-als in wheat grains and soil. Agronomy for Sustainable Development, Springer Verlag/EDP
Sci-ences/INRA, 2009, 29 (2), pp.297-312. �10.1051/agro:2008057�. �hal-02668285�
DOI:10.1051/agro:2008057
Research article
for Sustainable Development
Relationships between concentrations of trace metals in wheat grains
and soil
Denis B
aize
1*
, Lise B
ellanger
2, and Richard T
omassone
31INRA, UR 0272 Science du Sol, Centre d’Orléans, CS 40001, 45075 Orléans Cedex 2, France
2Département de Mathématiques Jean Leray, UMR 6629, Université de Nantes, BP 92208, 44322 Nantes Cedex 03, France 3Département de Mathématique & Informatique, Institut National Agronomique, 75231 Paris Cedex 05, France
(Accepted 3 October 2008)
Abstract – In order to reduce the amount of trace metals such as cadmium in human food, it is useful to predict the trace metal composition of cereal grains from well-chosen topsoil variables. Statistical relationships between soil properties and metal concentration in plant organs have already been studied. However, such studies involved only a few common soil properties such as pH, organic carbon content and cation exchange capacity. Here, we compared metal contents in grain and in topsoil samples. 198 samples of grains of winter wheat were collected from paired topsoil and crop surveys in the northern half of France. The soils belong to 18 contrasting pedogeological families. Grain and topsoil samples were analysed for Cd, Cr, Cu, Ni, Pb, Zn, Fe, Mg and Mn. For soil samples, three pools of metal were determined: total concentration by HF digestion, and two available pools by partial extraction using either diethylenetriamine pentaacetic acid (DTPA) or NH4NO3. Canonical
correlation analysis including multiple linear regression was used to study relationships between soil and grain data. Our findings show the occurrence of six significant and independent relations between the topsoil variables and the grain variables. The adjustment quality of those relations is measured by six coefficients equivalent to individual determination coefficients. The maximum coefficient of 0.79 is higher than any individual ones. Our findings show in particular an excellent regression model for grain Cd with a small number of topsoil variables, thus allowing an accurate prediction for winter wheat grains. Practically, farmers can use the prediction model to increase soil pH and by growing a less metal-accumulating cultivar upon detection of a threat. The strengths of our study are the following: (1) we studied a very large number of sites, including soils with very diverse parent materials, soil-forming processes and geochemical properties; (2) we measured and tested a large number of variables, including in particular available metal fractions; and (3) we applied unusual statistical methods such as canonical correlation analysis.
cadmium/ canonical correlation analysis / partial extraction / predictive model / topsoil / trace metals / wheat grains
1. INTRODUCTION
The prediction of trace-metal contents of wheat grains only from analytical data on the soil where the wheat is grown is all but impossible. All specialists agree that the total trace-element concentrations in a soil rarely permit prediction of the contents of the same elements in part of a plant cultivated on this soil. For this reason, many authors have investigated sequential-extraction or partial-extraction methods as a basis for empirical models that can predict the contents of specific trace elements in part of a harvested plant. However, the direct relation between the same elements in wheat grains and in soil is perhaps not the best way to predict trace-metal contents. As it seems clear that topsoil cannot be reduced to a single ele-ment, even if this element is an essential one, it could be more
* Corresponding author: [email protected]
interesting to consider a global relation between topsoil and wheat grains and to study it before anything else. After anal-ysis of this relation it would, perhaps, be possible to obtain a better prediction of the contents of wheat grain, or content of a specific element of more particular interest, perhaps due to the role that it plays from the point of view of the public health. The fundamental reason for this approach lies in the fact that a relation between similar elements can be disturbed by the presence of other elements: to study a global relation is more realistic than to study all the relations two by two.
This general remark is consolidated by reasons more purely analytical: even when element concentrations extracted by so-called “selective” reagents are available, it remains difficult to pass directly from analytical data obtained on dry and sieved surface-horizon soil samples, to analytical values for plant parts such as wheat grains (e.g. Symeonides and McRae,1977; Sauerbeck and Styperek,1985). There are many reasons for
this. One is that the absorption of elements takes place at the roots, each plant species having its own strategy for the cap-ture, transfer and storage of absorbed elements into other or-gans, such as stems, leaves and grains. In certain cases, the uptake of Cd or Zn by wheat plants can be significant, without this clearly showing in the grains. In any case, wheat is not a plant that accumulates many trace elements in its reproductive organs (Grant et al.,1999; Tremel-Schaub and Feix,2005).
The present article gives the results obtained as part of two research programmes: QUASAR (QUAlité des Sols Agricoles et des Récoltes – Baize et al.,2003) and GESSOL - La Châtre (Baize and Tomassone,2003b). In both cases, we worked on the composition of soft-wheat grains (Triticum aestivum), a food product of major importance in the human diet that is also of primary economic importance for France. Both stud-ies dealt almost exclusively with “ordinary” agricultural soils, not polluted with metals, that had been subject to only slight, diffuse contamination.
The two objectives were, first, to see whether there is a sta-tistical link between a set of analytical data determined on soil samples and the trace-metal composition of grains; and, second, to establish an estimation of threat to health concern-ing, more specifically, cadmium because of the dangers it rep-resents. To this end, we looked for statistical models using analytical data as explicative variables of the surface hori-zon where the wheat was grown. However, such a search is faced with theoretical difficulties (see box). Two more obsta-cles should be mentioned. First, analytical uncertainty affects all analyses, in particular the relatively delicate ones done on wheat grains. Second, our dataset comprises grain samples harvested in different regions and over four years (Tab. I), whereas it is known that the climatic conditions affecting a ce-real population can have an impact on absorption and yield processes, and thus on the mineral content of wheat grains (Oliver et al.,1993).
Theoretical issues of a statistical approach
* The processes taking place in the field, during the entire veg-etation period of 8 to 9 months, at the interface between roots, micro-organisms, solid phases and soil solutions, are not well de-scribed by laboratory analyses on dried and sieved soil samples that were collected a few days before the harvest;
* The role of the other, deeper, soil layers is completely ignored (Van Lune & Zwart,1997);
* The physiological processes of redistribution of the elements ab-sorbed by roots towards other parts of the plant during its growth are not taken into account; the same is true for the synergies and antagonisms intervening on the scale of plant cells;
* The competition between individual plants in the plant cover is omitted;
* Finally, the input from atmospheric fallout, which is another direct way of providing trace elements, is also neglected (e.g. Hovmand et al.,1983).
Notwithstanding these difficulties, much research has fol-lowed this approach as it is very simple to implement. Among the many works including or concerning wheat, the following
can be cited: Sauerbeck and Styperek (1985), Prüess (1997), Garrett et al. (1998), Oliver et al. (1999), Norvell et al. (2000), Chaudri et al. (2001), Sappin-Didier et al., (2001), Hough et al. (2003), Adams et al. (2004), Meers et al. (2005).
Our approach contains the following original elements, in that we have at the same time:
– Operated on a large number of sites (n= 198) with highly varied soils (parent materials, types of pedogenesis, con-stituents and functioning; see Tab. I);
– Determined a large number of soil variables (n= 25) and not only the few usual variables such as organic carbon, pH or cation exchange capacity (CEC);
– Applied statistical methods to this dataset that are rarely employed but well suited to agronomical objectives, such as the analysis of canonical correlations.
From the start, this work was not intended as a single ex-periment, but rather as the result of combining analyses car-ried out for two distinct programmes. However, the dataset contained a sufficient number of common features for it to be treated as a whole so as to provide useful information; this was achieved through: (i) identical sampling strategies; (ii) deter-mination of the same variables; and (iii) analytical work done in the same two laboratories, using the same analytical meth-ods.
Moreover, the studied soils show strongly varying proper-ties and it would have been a pity not to work on this corpus of data, even though it may not be entirely satisfactory from a statistical viewpoint. Of course, the data do not come from an experimental design but are representative of the greatest number of situations met in practice.
Rieuwerts et al. (1988) enumerated several requirements for the development and use of empirical models: “Whilst such
data [metal concentrations in soil solution] do not exist on a large scale, empirical models may be able to predict bioavail-able metal concentrations from existing data on total metal concentrations and those soil factors thought to influence the partition of metals between the solid and solution phases of soils.. . . A major limitation to the approach is the availability of suitable data. . . . the data required must meet several cri-teria: . . . (2) for each sample data must be available on both total metal concentration and on an acceptable measurement of available metal concentration; . . . (3) for each sample, data must also be available on at least one of the influencing fac-tors identified to be of potential importance; (4) ideally, the data must be derived from a study area that has not been un-duly contaminated by anthropogenic activity.” Our study fully
answers these requirements.
2. MATERIALS AND METHODS 2.1. Sampling strategy
Several “pedogeological families” (PGF) were selected so as to study sufficiently contrasting soil types. A pedogeologi-cal family is composed of some soil series that developed over
Table I. Short presentation of sites and soils.
dataset code of PGF soil brief description parent material or bedrock No on the map location number of sites year of sampling QUASAR A sandy, acidic old alluvial terrace 1 Southern Loiret 11 1998
B loamy, calcic calcareous surficial formation 2 Beauce 13 1998 C clayey, calcic, fersiallitic hard Jurassic limestones 3 Southern Yonne 12 1998 D ferro-manganiferous Sinemurian marly limestone1 4 Auxois - Côte d'Or 7 1998 E silty, acidic Luvisols ancient Quaternary silty
deposit
5 Indre & Indre-et-Loire
15 1998 F loamy, calcic recent loess 6 Somme 12 1998 H hyper-calcareous Cretaceous chalk 7 chalky Champagne 13 1998 J calcareous and clayey hard Jurassic limestones 8 Berry 10 1998 K calcareous and clayey soft Cretaceous limestones 9 Charentes 13 1998 Limousin2 m migmatites 10 Limousin 5 1999 9 9 9 1 8 n i s u o m i L n i s u o m i L 0 1 s e t i n y t p e l l 9 9 9 1 3 1 0 1 s s i e n g n 9 9 9 1 0 1 n i s u o m i L 0 1 s e t i r o i d d
La Châtre3 g acidic grey plagioclasic gneiss 12 Aigurande's plateau 11 2000 a eutrophic amphibolites 12 Aigurande's plateau 8 2000 M calcareous heavy clays Liassic marls 11 Southern Boischaut 11 2000 T sandy-gravelly, acidic Triassic sands and clays 11 Southern Boischaut 11 2001 X silty-sandy, acidic micaschists4 12 Aigurande's plateau 15 2001 1 Highly mineralized by numerous metals due to falts;
2 Twelve sites were spread with sewage sludge rich in industrial cadmium ; 3
GESSOL research programme;
4 With local occurrences of graphite and Pb or Zn mineralizations.
198
the same parent material and were subjected to the same pedo-genesis, i.e. the same processes of metal concentration or re-distribution in the soil profile. Each pedogeological family was sampled in 8 to 15 sampling sites located in separate fields that were selected on the basis of three criteria: (i) they belonged to the required family; (ii) a soft winter wheat crop was present; and (iii) the wheat varieties were ‘Trémie’ or ‘Soissons’, the most common French ones during the study period. The eigh-teen families studied are briefly presented in Table I. Mature wheat ears were collected just prior to harvesting in July, in a square of 1 m2per parcel. Exactly in the same square, 2 kg
samples of ploughed surface horizon (0–25 cm) were taken with a spade, i.e. each sample is only representative of this square and not of the whole field.
2.2. Location of sites – Pedogeochemical families
Our study involved the combination of three distinct datasets that were obtained according to exactly the same oper-ating methods for sampling and analysis, during three studies carried out in different French regions:
– The ‘QUASAR-1998’ study, n= 106, concerned soils de-veloped over various types of sedimentary deposits and rocks (Quaternary wind-borne silty materials, river ter-races, and rocks of marine origin such as chalk and
Figure 1. Location of sites (numbered black circles – cf. Tab. I). The old blocks (Massif Central, Massif Armoricain) appear in hatching.
hard Jurassic limestone), located in different regions such as Centre, Burgundy, Picardy, Champagne and Char-entes (Fig. 1) (Baize et al., 2003; Mench et al., 2001; Sappin-Didier et al.,2001).
– The ‘Limousin’ study, n = 36, concerned soils derived from various metamorphic rocks or diorites. Among these, twelve sites received sewage sludge in the past that was
particularly rich in cadmium of industrial origin (Courbe et al.,2002).
– The ‘GESSOL - La Châtre’ study, n= 56, was located in the south of the Centre region, where marine Trias-sic and LiasTrias-sic deposits of the Paris Basin are in contact with metamorphic rocks of the north edge of the French Massif Central (Baize and Tomassone, 2003a, b). In the specific case of the "Micaschist" pedogeological family, five sites were voluntarily sampled near a geochemical anomaly known for its high Pb, Zn, Cu and As concen-trations in bedrocks and soils.
In all, 198 sites of agricultural soil were sampled, 186 of which were not polluted with anthropogenic metals, belonging to 18 contrasting pedogeological families.
2.3. Analyses performed
2.3.1. Analyses on topsoil samples
All topsoil analyses were performed on air-dried fine earth (<2 mm) by the INRA soil analysis laboratory in Arras, France. The following parameters were determined:
The usual agro-pedological properties such as particle-size distribution (five fractions – pipette method – NF X 31-107), organic carbon (NF ISO 10694), pH in water (NF ISO 10390), total CaCO3 (NF ISO 10693) and cation exchange capacity
(Metson method).
Total concentrations of two major elements (Fe and Mn) and six trace metals (Cd, Cr, Cu, Ni, Pb and Zn) were ob-tained after digestion by hydrofluoric and perchloric acid HF + HClO4 (ISO 14869-1) and analysis by
inductively-coupled plasma atomic emission spectrometry (ICP-AES) or inductively-coupled plasma mass spectrometry (ICP-MS), de-pending on the element.
In addition, partial extractions were performed using two reagents carefully chosen after a review of relevant literature:
∗ The Lindsay and Norvell (1978) reagent contains in par-ticular diethylenetriamine-pentaacetic acid (DTPA); ex-traction was done according to the NF ISO 14870 stan-dard with a mixed solution of TEA (Triethanolamine) 0.1 mol L−1+ CaCl20.01 mol L−1+ DTPA 0.005 mol L−1
ad-justed to pH 7.3. The extracted solutions were then anal-ysed for Cd, Cu, Pb and Zn by ICP-AES.
DTPA has less extraction capacity than EDTA, but a stronger one than saline solutions, and is best adapted for neutral and alkaline pH values. As both an acid and an or-ganic complexant, DTPA dissolves exchangeable elements and those mostly complexed by organic matter, as well as those fixed on or included in Fe, Mn and Al hydrox-ides that would themselves be dissolved by the reagent (Lebourg et al.,1998).
∗ Extraction by the neutral salt ammonium nitrate (NH4NO3) 1 mol.L−1 (DIN, 1995). Cd, Cu, Pb and
Zn were assayed by ICP-MS in the extraction solutions. Prüess (1997) showed that the extraction of many trace
metals in soil with this solution could be significantly correlated with contents of the same metals in various plants. Several studies have tested this reagent, such as Lebourg et al. (1998) and Sterckeman et al. (2001). The 25 analytical variables measured on soil samples in the text hereafter are designated as [topsoil variables].
2.3.2. Analyses on wheat grains
Wheat ears were oven-dried at 50˚ C then threshed, spe-cial attention being paid to limiting any contamination. The grains were analysed by the USRAVE – INRA laboratory in Bordeaux. They were washed three times with bi-permuted water and then milled to 200 μm using a titanium-surfaced grinder. This flour was digested by HNO3 and H2O2.
Trace-element contents were determined by ICP-AES or graphite-furnace atomic absorption spectrometry (GFAAS). The 198 wheat samples were analysed at different times, in five distinct batches. For each batch of wheat grains an internal laboratory standard was analysed as quality control. This standard was verified against a plant sample, CRM 189, from the Bureau Communautaire de Référence (BCR) (wholemeal flour) and then CRM 281 from the Institute for Reference Materials and Measurements (IRMM).
All metal concentrations are expressed as mg kg−1DM (dry matter), except for Mg content, that is expressed as g kg−1. Hereafter, concentrations determined in wheat-grain samples will be designated as [grain variables].
It should be noted that Mg and Mn contents were not deter-mined for the 36 samples of the Limousin study. For that rea-son, we either worked on a population of 198 sites with only 7 grain variables, or on a population of 162 sites with 9 grain variables. In fact, we shall present the results for the 162 sites, and we shall note that for the 198 sites they are identical to a few decimal points.
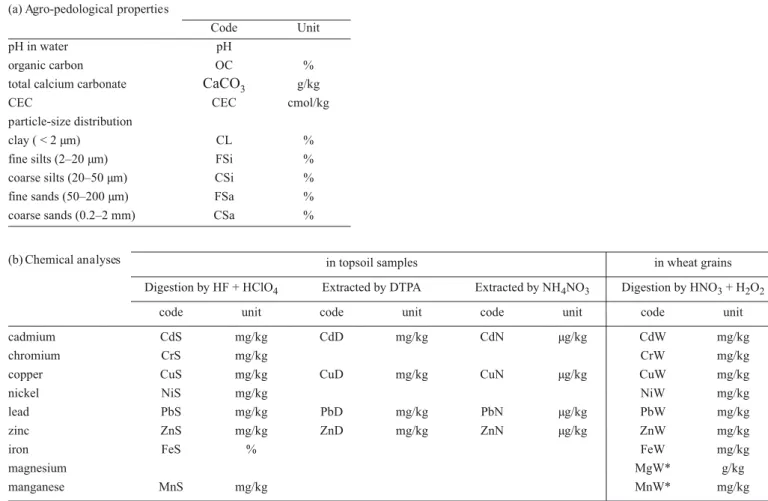
2.4. Coding of variables - Units
TableIIpresents both the codification of the variables and the units used.
2.4.1. Statistical data analysis
The variable NH4NO3-extracted Pb (PbN) turned out to be
unusable (see below Sect. 3.1). So, the information from all 162 (or 198) sites is contained in two groups of variables: 24 of them characterise the topsoil and 9 (or 7) others characterise the wheat grains. These two groups were called X ([topsoil variables] or topsoil) and Y ([grain variables] or wheat grains). Our problem thus consisted of studying the relations between X and Y and, if possible, in predicting Y from X. Before any in-depth statistical analysis and as is usual in any statistical analysis, we examined the 33 univariate distributions to de-tect any anomalies. And, as is common in such studies, it was
Table II. Coding of variables and units used.
(a) Agro-pedological properties
Code Unit H p r e t a w n i H p organic carbon OC % total calcium carbonate CaCO3 g/kg
g k / l o m c C E C C E C particle-size distribution % L C ) m μ 2 < ( y a l c
fine silts (2–20 μm) FSi % coarse silts (20–50 μm) CSi % fine sands (50–200 μm) FSa % coarse sands (0.2–2 mm) CSa %
(b) Chemical analyses intopsoilsamples inwheatgrains Digestion by HF + HClO4 Extracted by DTPA Extracted by NH4NO3 Digestion by HNO3 + H2O2
code unit code unit code unit code unit cadmium CdS mg/kg CdD mg/kg CdN μg/kg CdW mg/kg g k / g m W r C g k / g m S r C m u i m o r h c
copper CuS mg/kg CuD mg/kg CuN μg/kg CuW mg/kg g k / g m W i N g k / g m S i N l e k c i n g k / g m W b P g k / g μ N b P g k / g m D b P g k / g m S b P d a e l / g m D n Z g k / g m S n Z c n i z kg ZnN μg/kg ZnW mg/kg g k / g m W e F % S e F n o r i magnesium MgW* g/kg g k / g m * W n M g k / g m S n M e s e n a g n a m
* Only 162 sites analyzed.
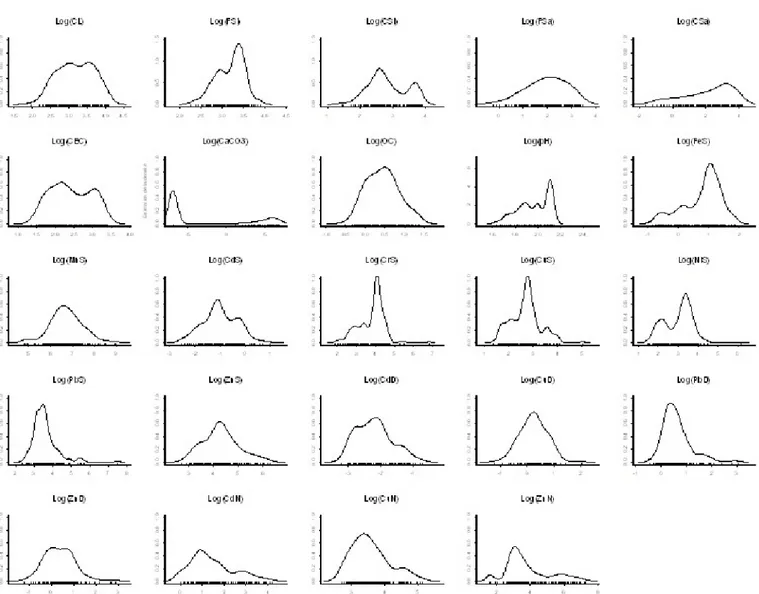
seen that logarithmic transformations give rise to more sym-metrical distributions, which means that the statistical analy-sis is supported by better assumptions on data. See Figure2 where distributions of transformed variables appear to be the best compromise to achieve these assumptions.
According to the two successive approaches (study of the global relations, then prediction of specific elements), the anal-ysis can then be tackled in two steps:
(1) First, the study linked all relations between X and Y, us-ing the rather unusual approach of canonical correlation
analysis (Hotelling,1936; Gittins,1980; Bellanger et al., 2006).
(2) Secondly, because of lack of space and unequal interest of the 9 Y variables, the study was limited to the relation of one of the Y variables as a function of X, using the more standard approach of multiple linear regression. Of course, in this case, classical tools such as stepwise selec-tion of variables have to be used to obtain more stable re-sults (Tomassone et al.,1992; Venables and Ripley,1997). We discuss canonical correlation analysis first, since multiple linear regression may be seen as a special case.
2.4.2. Canonical correlation analysis
The relation between X and Y can be studied through care-ful examination of the correlation coefficients between the groups (RXY, of which there are 24 [X]× 9 [Y] = 216) by
tak-ing into account the internal coefficients of both groups (RXX
and RYY), but in that case there are (24+9) × (24+9–1)/2 =
528, the total number of correlation coefficients. This would be a Herculean task that rarely bears fruit. Canonical correla-tion analysis consists of searching for the most strongly corre-lated linear combinations of each group of variables X and Y; we call them, respectively, u1and v1, and their correlation
co-efficient, called the canonical correlation coco-efficient, is r1=
correlation{u1,v1}. Note that if Y would be limited to a single
variable (such as cadmium in the grains: CdW) we would be exactly in the situation of a multiple linear regression, and the square of r1would be the classic coefficient of determination,
R2. Moreover, this value is larger than the greatest of the nine coefficients of determination of the 9 Y variables. The main difficulty lies in the interpretation of the {u1,v1} couple,
quan-tities that are, respectively, called the first canonical variables of X and Y; as usual, this is done for linear combinations in terms of the correlations that exist between u1and {X,Y} and
Figure 2a. Estimated density distributions for 24 topsoil log(variables); these curves are more useful and readable than classical histograms, n= 162.
v1and {X,Y}, generally using graphs such as correlation cir-cles.
However, this couple is one of eight others for a total of nine (generally the smallest number of X or Y variables). Each cou-ple is associated with a canonical correlation coefficient, r1,
r2, . . . , r9. It is possible to determine if these coefficients are
significant, i.e. statistically different from 0, which gives a di-mension, k, of the representation of the relation between X and Y. As, in addition, these couples do not correlate in pairs, we need only k separate graphs {u1,v1}, . . . ,{uk,vk} to represent
a summary of the relation between X and Y. Of course, these canonical variables are only linear combinations of measured variables and have interesting statistical properties, but as such do not necessarily have an agronomic meaning. However, a specific Y canonical variable, such as v1, translates a joint
re-lation of wheat grain variables to a specific topsoil variable defined by u1.
2.4.3. Multiple regression models
More classically, we could have carried out nine regression models for each of the Y components in terms of X. However, even if this approach is a better known one, the interpretation of the multiple regression equation is strictly identical to that of u1. Of course, some refinements are more usual for
regres-sion, such as the selection of sub-sets of X variables as accept-able models. However, the relation between the two analyses allows us to know, via the canonical correlation analysis, the maximum limits of the R2of the Y variables because of their
relation with {u1, . . . , uk}.
All statistical processing was completed by resampling techniques (such as jackknife and bootstrap) that help in over-coming certain (but not all) constraints inherent in the stan-dard methods. They are result-validation tools that use quite heavy calculation means (e.g. Venables and Ripley,1997). It is difficult, and undoubtedly useless, to present here the corre-sponding results but we may say that they confirm the results provided by the traditional approaches.
3. RESULTS AND DISCUSSION 3.1. Topsoil analyses
3.1.1. Usual soil properties and total concentrations
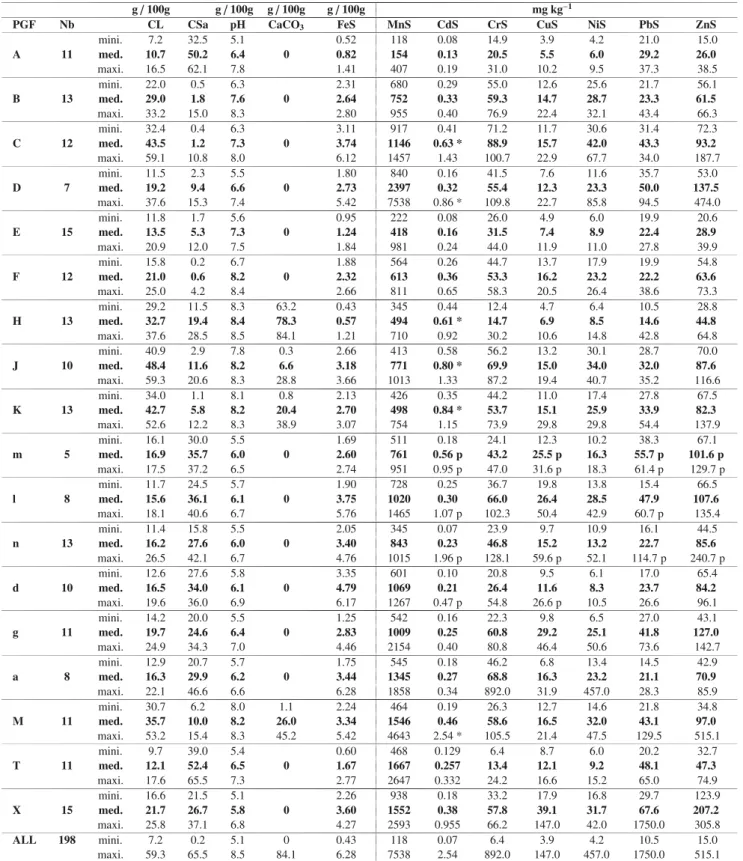
Because of the great variety of parent materials, the stud-ied soils show a great diversity of properties (Tab.III). For the main agropedological characteristics and the total metal con-centrations, wide ranges are effectively noted: pH in water, 5.1 to 8.5; clay content, 7.2 to 59.3%; total calcium carbonate, 0 to 84.1%; total soil Mn, 119 to 7538 mg kg−1; total soil Cd, 0.07 to 2.54 mg kg−1; and total soil Zn, 15 to 515 mg kg−1. Cer-tain pedogeological families with a natural tendency to acidity show great pH variations from one plot to the next, as a result of the cumulated effects of fertilisation and amendment (e.g. A, D, E, g, T and X). Based on statistical studies carried out
on a national scale (Baize et al.,1999), several slight geochem-ical cadmium anomalies clearly appear (families C, D, H, J, K and M, asterisked in Tab.III).
Notwithstanding careful selection and field verifications, certain sampled families show major geochemical variations from one site to the next, i.e. between sites that may be several hundreds of metres or a few kilometres apart. The pedoge-ological family “M”, for instance, can be clearly subdivided into two subfamilies. Five samples show very high Cd, Pb, Zn and Mn concentrations, whereas the six others have usual val-ues for clay material. This is commonly caused by deep-seated mineralisation that has affected the parent material, which is the case, for example, of some samples belonging to the fam-ily “X” that show high natural levels of Cu, Pb and Zn Tab.III). The distributions of these variables are visible in Figure2a.
3.1.2. Partial extraction
The metals extracted by DTPA could be assayed in all sam-ples, but this was not the case for those extracted with ammo-nium nitrate (Tab.IV). For instance, only 43 of the 198 sam-ples contained NH4NO3–extracted Pb above the quantification
threshold. All these 43 samples have a pH<6.5 and almost all a pH<6.2. Therefore, this variable could not be used for the statistical calculations.
3.2. Wheat-grain analyses
Metal concentrations in wheat-grain samples show large variations (Tab. V). The distributions of these variables are presented in Figure2b. For example, Cd in grains ranges be-tween 0.015 and 0.218 mg kg−1 DM (DM: dry matter). No value exceeds the European maximum level set by Commis-sion Regulation EC 466/2001 of 8 March 2001 for cereal grains (Tab.VI), fixed at 0.20 mg kg−1fresh matter (FM), i.e. 0.235 mg kg−1DM considering a water content of 15%.
In France, different maximum values are recommended by the French Conseil Supérieur d’Hygiène Publique (CSHPF, 1996) Tab.VI) for wheat intended for human consumption. Among the 198 Cd concentrations measured, only 12 exceed the value recommended by the CSHPF. All correspond to top-soil pH values below 6.5; 9 are part of the ‘Limousin’ dataset and received sewage sludge loaded with cadmium of industrial origin. Even so, all these 12 values remain below the European maximum value.
For lead, the laboratory found numerous Pb concentrations to be below the quantification threshold, i.e.<0.20 mg kg−1 DM. In order to conserve this important variable for our study, we obtained the “raw” laboratory results. All undetectable or negative values were replaced by a random value between+0 and the quantification-threshold value (uniform distribution) in order to be able to calculate the logarithms. The usual prac-tice to set to half the detection limit has no statistical support; in fact, this choice has no practical consequences on the re-sults.
Table III. Major agropedological and geochemical characteristics of topsoils given by the pedogeochemical family. Minima, medians and maxima. Natural anomalies in cadmium are to be noted for pedogeological families C, D, H, J, K and M (asterisked). Any value followed by “p” results from pollution by industrial sewage sludge application.
g/ 100g g/ 100g g / 100g g/ 100g mg kg−1
PGF Nb CL CSa pH CaCO3 FeS MnS CdS CrS CuS NiS PbS ZnS
mini. 7.2 32.5 5.1 0.52 118 0.08 14.9 3.9 4.2 21.0 15.0 A 11 med. 10.7 50.2 6.4 0 0.82 154 0.13 20.5 5.5 6.0 29.2 26.0 maxi. 16.5 62.1 7.8 1.41 407 0.19 31.0 10.2 9.5 37.3 38.5 mini. 22.0 0.5 6.3 2.31 680 0.29 55.0 12.6 25.6 21.7 56.1 B 13 med. 29.0 1.8 7.6 0 2.64 752 0.33 59.3 14.7 28.7 23.3 61.5 maxi. 33.2 15.0 8.3 2.80 955 0.40 76.9 22.4 32.1 43.4 66.3 mini. 32.4 0.4 6.3 3.11 917 0.41 71.2 11.7 30.6 31.4 72.3 C 12 med. 43.5 1.2 7.3 0 3.74 1146 0.63 * 88.9 15.7 42.0 43.3 93.2 maxi. 59.1 10.8 8.0 6.12 1457 1.43 100.7 22.9 67.7 34.0 187.7 mini. 11.5 2.3 5.5 1.80 840 0.16 41.5 7.6 11.6 35.7 53.0 D 7 med. 19.2 9.4 6.6 0 2.73 2397 0.32 55.4 12.3 23.3 50.0 137.5 maxi. 37.6 15.3 7.4 5.42 7538 0.86 * 109.8 22.7 85.8 94.5 474.0 mini. 11.8 1.7 5.6 0.95 222 0.08 26.0 4.9 6.0 19.9 20.6 E 15 med. 13.5 5.3 7.3 0 1.24 418 0.16 31.5 7.4 8.9 22.4 28.9 maxi. 20.9 12.0 7.5 1.84 981 0.24 44.0 11.9 11.0 27.8 39.9 mini. 15.8 0.2 6.7 1.88 564 0.26 44.7 13.7 17.9 19.9 54.8 F 12 med. 21.0 0.6 8.2 0 2.32 613 0.36 53.3 16.2 23.2 22.2 63.6 maxi. 25.0 4.2 8.4 2.66 811 0.65 58.3 20.5 26.4 38.6 73.3 mini. 29.2 11.5 8.3 63.2 0.43 345 0.44 12.4 4.7 6.4 10.5 28.8 H 13 med. 32.7 19.4 8.4 78.3 0.57 494 0.61 * 14.7 6.9 8.5 14.6 44.8 maxi. 37.6 28.5 8.5 84.1 1.21 710 0.92 30.2 10.6 14.8 42.8 64.8 mini. 40.9 2.9 7.8 0.3 2.66 413 0.58 56.2 13.2 30.1 28.7 70.0 J 10 med. 48.4 11.6 8.2 6.6 3.18 771 0.80 * 69.9 15.0 34.0 32.0 87.6 maxi. 59.3 20.6 8.3 28.8 3.66 1013 1.33 87.2 19.4 40.7 35.2 116.6 mini. 34.0 1.1 8.1 0.8 2.13 426 0.35 44.2 11.0 17.4 27.8 67.5 K 13 med. 42.7 5.8 8.2 20.4 2.70 498 0.84 * 53.7 15.1 25.9 33.9 82.3 maxi. 52.6 12.2 8.3 38.9 3.07 754 1.15 73.9 29.8 29.8 54.4 137.9 mini. 16.1 30.0 5.5 1.69 511 0.18 24.1 12.3 10.2 38.3 67.1 m 5 med. 16.9 35.7 6.0 0 2.60 761 0.56 p 43.2 25.5 p 16.3 55.7 p 101.6 p maxi. 17.5 37.2 6.5 2.74 951 0.95 p 47.0 31.6 p 18.3 61.4 p 129.7 p mini. 11.7 24.5 5.7 1.90 728 0.25 36.7 19.8 13.8 15.4 66.5 l 8 med. 15.6 36.1 6.1 0 3.75 1020 0.30 66.0 26.4 28.5 47.9 107.6 maxi. 18.1 40.6 6.7 5.76 1465 1.07 p 102.3 50.4 42.9 60.7 p 135.4 mini. 11.4 15.8 5.5 2.05 345 0.07 23.9 9.7 10.9 16.1 44.5 n 13 med. 16.2 27.6 6.0 0 3.40 843 0.23 46.8 15.2 13.2 22.7 85.6 maxi. 26.5 42.1 6.7 4.76 1015 1.96 p 128.1 59.6 p 52.1 114.7 p 240.7 p mini. 12.6 27.6 5.8 3.35 601 0.10 20.8 9.5 6.1 17.0 65.4 d 10 med. 16.5 34.0 6.1 0 4.79 1069 0.21 26.4 11.6 8.3 23.7 84.2 maxi. 19.6 36.0 6.9 6.17 1267 0.47 p 54.8 26.6 p 10.5 26.6 96.1 mini. 14.2 20.0 5.5 1.25 542 0.16 22.3 9.8 6.5 27.0 43.1 g 11 med. 19.7 24.6 6.4 0 2.83 1009 0.25 60.8 29.2 25.1 41.8 127.0 maxi. 24.9 34.3 7.0 4.46 2154 0.40 80.8 46.4 50.6 73.6 142.7 mini. 12.9 20.7 5.7 1.75 545 0.18 46.2 6.8 13.4 14.5 42.9 a 8 med. 16.3 29.9 6.2 0 3.44 1345 0.27 68.8 16.3 23.2 21.1 70.9 maxi. 22.1 46.6 6.6 6.28 1858 0.34 892.0 31.9 457.0 28.3 85.9 mini. 30.7 6.2 8.0 1.1 2.24 464 0.19 26.3 12.7 14.6 21.8 34.8 M 11 med. 35.7 10.0 8.2 26.0 3.34 1546 0.46 58.6 16.5 32.0 43.1 97.0 maxi. 53.2 15.4 8.3 45.2 5.42 4643 2.54 * 105.5 21.4 47.5 129.5 515.1 mini. 9.7 39.0 5.4 0.60 468 0.129 6.4 8.7 6.0 20.2 32.7 T 11 med. 12.1 52.4 6.5 0 1.67 1667 0.257 13.4 12.1 9.2 48.1 47.3 maxi. 17.6 65.5 7.3 2.77 2647 0.332 24.2 16.6 15.2 65.0 74.9 mini. 16.6 21.5 5.1 2.26 938 0.18 33.2 17.9 16.8 29.7 123.9 X 15 med. 21.7 26.7 5.8 0 3.60 1552 0.38 57.8 39.1 31.7 67.6 207.2 maxi. 25.8 37.1 6.8 4.27 2593 0.955 66.2 147.0 42.0 1750.0 305.8 ALL 198 mini. 7.2 0.2 5.1 0 0.43 118 0.07 6.4 3.9 4.2 10.5 15.0 maxi. 59.3 65.5 8.5 84.1 6.28 7538 2.54 892.0 147.0 457.0 1750.0 515.1
Table IV. Partial extractions. Minima, medians, maxima and quantification limits. The variable PbN (lead extracted by ammonium nitrate) turned out to be unusable for calculation.
CdD CuD PbD ZnD CdN CuN PbN ZnN mg kg−1 mg kg−1 mg kg−1 mg kg−1 μg kg−1 μg kg−1 μg kg−1 μg kg−1 mini 0.03 0.30 0.39 0.30 < ql < ql < ql < ql median 0.10 1.30 1.66 1.31 4.57 33.16 < ql 39.92 maxi 0.58 7.50 20.96 17.60 97.9 168.10 144.9 2270.7 ql – – – – 1 15 5 5 n< ql 0 0 0 0 13 9 155 8
ql: quantification limits; n< ql = number of values lower than ql.
Table V. Trace-metal contents in wheat grains. Minima, medians, maxima and quantification limits.
CdW CrW CuW FeW NiW PbW ZnW MgW MnW
mg kg−1 mg kg−1 mg kg−1 mg kg−1 mg kg−1 mg kg−1 mg kg−1 g kg−1 mg kg−1 number 198 198 198 198 198 198 198 162 162 mini 0.015 < ql 1.36 17.3 0.03 < ql 7.0 0.55 16.7 median 0.045 0.13 3.56 29.1 0.27 < ql 19.6 0.87 35.3 maxi 0.218 1.79 7.81 68.3 1.85 2.13 44.7 1.59 102.0 ql 0.015 0.10 1 - - 0.20 - - -n< ql 0 70 0 0 0 158 0 0 0
ql: quantification limits; n< ql = number of values lower than ql.
Table VI. European regulation and French recommendation for Cd and Pb in cereal grains.
“maximum recommended “maximum levels” levels” CSHPF European Regulation fresh matter dry matter fresh matter dry matter
Cd 0.10 0.116 0.20 0.235
Pb 0.50 0.59 0.20 0.235
3.3. Linear correlation between topsoil properties and grain composition
Even if we noted that a precise analysis of the 528 correla-tion coefficients has no great interest, it may be useful to take a look at specific cases:
– Correlation coefficients describing the relation with pH, a fundamental and commonly latent variable to understand many other relations. For topsoil, pH is strongly corre-lated with positive coefficients to clay content, CaCO3
and NH4NO3–extracted Cu, and with negative ones to
NH4NO3–extracted Cd and Zn, which is a commonly
ob-served feature (e.g. Rieuwerts et al., 1998; Sterckeman et al.,2001). This indicates that pH is redundant with these variables and cannot be used simultaneously as a predictor. For wheat grains, only Mn concentration is strongly corre-lated with topsoil pH.
– Correlation coefficients between the different expression of the same element (Cd, Cu and Zn): the correlations are not very strong and a metal content in grains is not re-lated to the total concentration of the same metal in the topsoil. The absence of a correlation between Cd in top-soil and Cd in wheat grains, see further Figure 7, is ex-plained by the fact that soil with a very high Cd content
Table VII. The nine canonical correlation coefficients: only the first six (r1 to r6) are statistically significant; the last three (r7to r9) are not
useful in the study of relationships between topsoil and wheat grains.
r1 r2 r3 r4 r5 r6 r7 r8 r9
0.890 0.833 0.790 0.741 0.648 0.546 0.462 0.353 0.293
shows modest values in the wheat ears. This is the case of the five soils belonging to the family ‘M’ with a very high pH (>8.2) and characterised by abundant manganese (total Mn>2300 mg kg−1).
3.4. Canonical correlation analysis
Study of the canonical correlation coefficients (Tab. VII) shows that the first six are highly significant, i.e. the proba-bility that they are null is less than 0.001, which means that one can represent six significant and independent linear re-lations between the soil characteristics and the wheat grains. The squares of the first two are 0.793 and 0.695. It can be said that 79.3% of the information of a variable related to grain variables (v1) depends upon a variable related to soil variables
(u1), and that 69.5% of another variable that is independent
of the first one and related to grain variables (v2) is also
re-lated to soil variables (u2), itself independent of u1. The graph
in Figure 3 illustrates the first relation (u1v1). We now know
that there is a complex relation between [topsoil variables] and [grain variables] that can be decomposed into six linear re-lations, where the important part is to give a sense to each of them. This can be done with the help of graphs presented as correlation circles; the point coordinates are the correlation coefficients of the variable with the axis; the proximity of a
Figure 3. First set of canonical variates (r1 = 0.89). This graph illustrates the best linear relation between topsoil (u1) and wheat grain (v1)
canonical variables; the correlation between u1and v1is equal to 0.89. Letters are codes for pedogeological families – see Table I, n= 162. The
line is useful if one wants to predict v1by u1, the regression coefficient is r1= 0.89, the first canonical correlation coefficient.
Figure 4. First two sets of canonical variates. Correlation circles for internal interpretation of correlation between variables and the first and the second canonical variables. Each circle has radius 1. On the left side pH, near the circle, is well explained by u1and u2(topsoil); on the right
side ZnW is uniquely explained by v1(wheat grain).
variable with the circle indicates a fairly strong relation with the corresponding canonical variables.
Figure 4: For the first two canonical variables of [topsoil variable] (left), a variable close to the circle of radius 1 like pH is well represented by u1and u2; it plays almost the same
role as CdN and ZnN, that are diametrically opposed and also close to the correlation circle, and of which we know that they are inversely proportional. It is the type of axis that follows the diagonal of this plane and which represents acidity with high pH on the lower left and low pH on the upper right. How-ever, fine sand (FSa) and coarse sand (CSa) are only related to u1and play an opposite role to that of clay (CL), fine silt
(FSi) and coarse silt (CSi); this is a grainsize axis that opposes topsoils with dominant fine particles and those with sandy tex-tures. These two factors are not independent. To the right, only ZnW and MgW are strongly related to v1, CdW to v2 and
MnW to both.
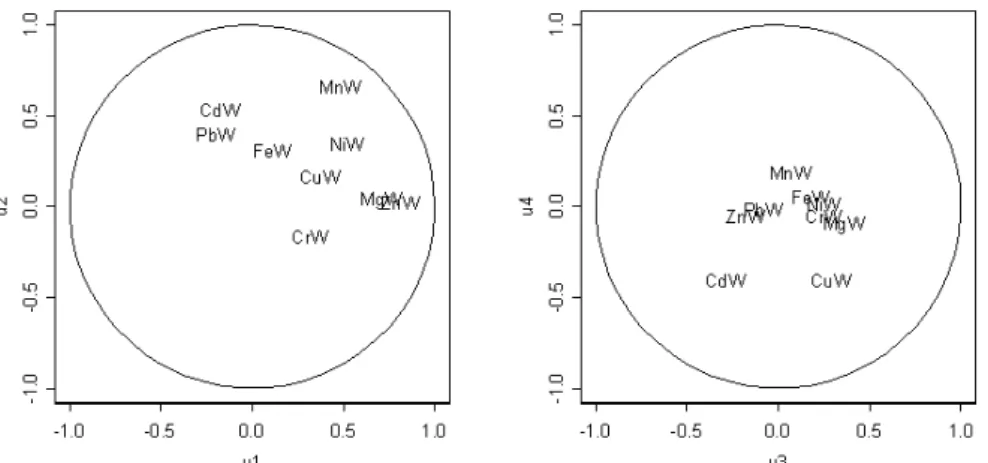
Figure 5 provides an external interpretation of wheat grain variables explained by topsoil ones on correlation circles de-fined by [u1, u2] (left) and [u3, u4] (right). If we look at the left
circle:
– Grain Mg and grain Zn are positively related to u1 and this may be seen as they are close to the right edge of the circle;
Figure 5. Canonical variates of wheat grains explained by topsoil. Correlation circles for external interpretation of correlation between topsoil canonical variables (u1and u2on the left; u3 and u4on the right) and wheat grain variables. ZnW and MgW are practically explained in the
same manner: ZnW by u1(left) and MnW by u1and u2. CdW and CuW are practically explained in the same manner, by u3and u40.263 for
CdW and 0.259 for CuW (see Tab. VIII).
Table VIII. Percentage of determination coefficient (R2) contained
in each topsoil canonical variate. The last column shows the R2value
for each grain variable. These values may be interpreted in the fol-lowing manner: for Cd concentration in grains (CdW) the maxi-mum attainable value is 0.588, the first canonical variable explains 5.2 × 0.588/100 = 0.11, the second 46.0 × 0.588/100 = 0.27, and so on. [GV] u1 u2 u3 u4 u5 u6 u7 u8 u9 R2 CdW 5.2 46.0 14.2 30.5 2.1 0.1 1.2 0.0 0.7 0.588 CrW 30.2 9.8 18.7 1.3 20.5 3.8 0.2 8.8 6.7 0.338 CuW 28.6 4.5 17.3 36.3 0.6 0.6 10.2 1.4 0.7 0.484 FeW 3.5 22.9 8.4 0.3 27.5 33.8 0.8 0.8 2.2 0.377 MgW 74.4 0.1 19.2 1.6 3.0 0.3 0.3 0.5 0.7 0.672 MnW 33.7 60.1 0.6 4.3 0.0 0.6 0.1 0.4 0.0 0.695 NiW 53.8 21.5 12.2 0.0 0.5 0.0 5.5 6.0 0.4 0.504 PbW 9.7 35.8 1.7 0.2 21.6 22.3 5.2 3.0 0.5 0.404 ZnW 90.0 0.0 4.4 0.6 3.3 0.8 0.7 0.0 0.0 0.732
– Grain Cd is positively related to u2 because it is close to the upper edge of the circle;
– Grain Mn is related in an equal way to u1 and u2 because it is close to the positive diagonal of the circle.
The results are coherent with Figure 3. The soils such as those of pedogeological families ‘X’, ‘g’ and ‘T’ are rather acid; but the families ‘J’, ‘K’ and ‘F’ are alkaline soils (pH>8) and those from families ‘B’ and ‘E’ are neutral. The soils with high values for grain Mg and grain Zn are located in the upper part of the graph {u1,v1} as acid soils because the values of these two variables are high and thus pH is low.
As the variables u1to u9 contain all useful information for
explaining the linear relations between [grain variables] and [topsoil variables], we easily obtain the maximum values of the coefficients of determination of each wheat grain variable (Tab.VIII– last column).
We even know which of the canonical variables are respon-sible for these values: for Zn concentration in grains (CdW)
90% of the value of R2 = 0.732 is due to u
1 and this is the
best linear relation for wheat grains, whereas for CdW the re-lation is more complex (three independent components, u2, u3
and u4for 46.0%, 14.2% and 30.5%). Cr, Fe and Pb in grains
(respectively, 0.338, 0.377 and 0.404) could not be correctly explained by simple, i.e. linear, models. That for Cu and Ni in grains (respectively, 0.484 and 0.504) would provide only poor models. Cd, Mg, Mn and Zn concentrations in grains (re-spectively, 0.588, 0.672, 0.695 and 0.732), however, would be much better explained by work in molecular biology showing that Cd, Zn, Mn and Mg use similar membranous carriers.
It is also quite clear that the last three components are non-significant, i.e. without interest for explaining a possible rela-tion (Tab.VIII). All computations were carried out on classical software, even though now some more specialised programs are available (Gonzalez et al.,2008).
3.5. Modelling Cd concentrations in wheat grains
As some variables, such as Cd concentrations in wheat grains (CdW), are of greater interest we may see how the canonical correlation analysis is supplemented by some more classical models. With the previous elements, we know that with all the variables (i.e. for 162 sites) we cannot have a model for CdW with a R2> 0.588. However, this value is only
obtained with all topsoil variables, even if we know that 90.7% (= 46.0 + 14.2 + 30.5) is provided by the three variables u2, u3
and u4, or a R2= 0.533. The [topsoil variables] thus can be
re-visited (but we know the attainable maximum R2) in selecting
a plausible sub-model using a stepwise approach. It is what we have done (where sR is the residual standard deviation of the
model):
CdW= – 1.21 – 0.011*CaCO3– 0.173*MnS+ 0.421*CdD –
0.145*ZnD+ 0.214*CdN – 0.166*FSa + 0.111*CSa with R2= 0.502 and sR= 0.36
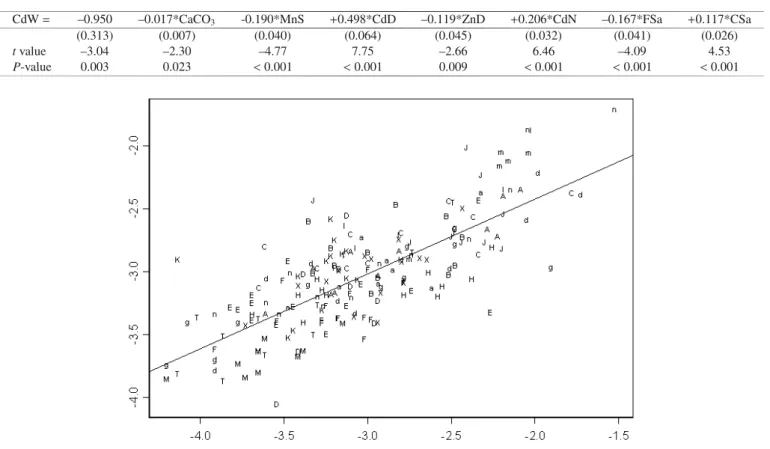
Table IX. Coefficients of the model for predicting Cd content in wheat grains (CdW) with standard deviation (line 2), t-value (line 3) and
P-value (line 4), n= 198. All P-values are lower than 0.01 except for CaCO3.
CdW= –0.950 –0.017*CaCO3 -0.190*MnS +0.498*CdD –0.119*ZnD +0.206*CdN –0.167*FSa +0.117*CSa
(0.313) (0.007) (0.040) (0.064) (0.045) (0.032) (0.041) (0.026)
t value –3.04 –2.30 –4.77 7.75 –2.66 6.46 –4.09 4.53
P-value 0.003 0.023 < 0.001 < 0.001 0.009 < 0.001 < 0.001 < 0.001
Figure 6. Overall predicted (ordinate) vs. measured CdW (abscissa) values for the selected multiple linear regression model (R2= 0.594), n =
198. Control of the fitting for cadmium in the wheat grain model. Letters are codes for pedogeological families – see Table I.
which can be simplified without CaCO3(at the limit of
signif-icance) to:
CdW= – 1.47 – 0.155*MnS + 0.348*CdD – 0.144*ZnD + 0.246*CdN – 0.159*FSa+ 0.094*CSa
with R2= 0.496 and s
R= 0.37.
In fact, grain Mg and grain Mn were only measured at the 162 sites and of course integrated in canonical correla-tion analysis, but these two variables are not available at the 36 other sites and regression models for them are possible us-ing only the 162 sites. Moreover, to predict the 7 other wheat grain variables, the 198 sites could be used, but with a slightly different canonical correlation analysis, computed with only 7 grain variables. For grain Cd (CdW), the results (Tab.IX) are identical to a few decimal points. Table IXpresents the dif-ferent elements that help in explaining better this third model which gives R2 = 0.594, a little higher than the two
preced-ing ones, and a residual standard deviation of the same order at 0.35. This means that the model for the 162 sites is suit-able for the 36 Limousin sites. The most significant varisuit-ables for explaining cadmium in wheat grains (CdW) are NH4NO3
-extracted Cd, DTPA--extracted Cd and total manganese in top-soils, and to a lesser degree, fine sand and coarse sand, and finally DTPA-extracted Zn and CaCO3. Only 16 CdW values
are poorly “predicted” by this model for the 198 sites. The
poor adjustment of 11 of these is explained by the context, i.e. by specific values of certain variables. Five remain "irre-ducible", unexplained. Of course, a better (and more realis-tic) validation will be possible with values for new sites. How-ever, as said above, an “internal” validation by the ‘jackknife’ method did not find influential observations; and it is clear that the model was not influenced by a limited number of sites.
Figure6provides an image of the adjustment quality; the relation does not show particularly outlier sites, as an anal-ysis of influential sites through the use of standard statistics showed nothing; but this was already acquired by the results of canonical correlation analysis as illustrated in Figure3. It can be seen that the sites of each pedogeological family are quite well grouped, with the exception of families A, C and T. At this point, we may note that the categorical variable “PGF” has no great interest when used in models: when we tried to use it in a model its effect was less precise than that of the X [top-soil variables]. This means that, in our study, X [top[top-soil vari-ables] contain more useful information than the membership to a pedogeological family. It would have been interesting a pri-ori to look at potentially interesting regressors to explain and to predict Cd content in wheat grains; Figure7is an illustration of the difficulty and even impossibility of finding the best re-gressors, here total Cd in topsoils (CdS), pH, DTPA-extracted Cd (CdD) and NH4NO3-extracted Cd (CdN), by using only
Figure 7. Graph of CdW versus potentially-interesting regressors: soil total Cd (CdS), soil pH, soil DTPA-extracted Cd (CdD) and soil NH4NO3-extracted Cd (CdN); r is the simple correlation coefficient. There is some difficulty finding an interesting association to obtain the
best prediction that only canonical correlation analysis, including regression, is able to furnish. Letters are codes for pedogeological families – see Table I.
3.6. Discussion on predicting Cd content in wheat grains
Preliminary stratification by pedogeological families does not increase the model efficiency. The probable reason for this is that these families are categories that are too coarse as they take into account neither local pedogeochemical variations, nor the effects of local agricultural practice such as the adding of nitrogen fertilisers (e.g. Mitchell et al.,2000), of KCl (e.g. Sappin-Didier et al.,2001) or of basic calcic amendments, the last having a strong effect on the pH on a plot scale. In short, the variables directly measured on each sample are more e ffi-cient, if used conjointly, for the prediction of Cd in grains than a stratification that was done beforehand.
Initially we started out on a search for purely statistical em-pirical models calculated from 24 soil variables. This work has resulted in equations with a great biogeochemical coherence, especially for cadmium, because of both the most significant regressors and the arithmetic signs that affect them. Even if statistical models have no intrinsic reasons to obtain a physi-cal coherence, and when it does occur it is largely coincidental, we can assume that with a thoughtful choice of variables re-flecting quite distinct characteristics it may be easier to reach this coherence.
– Total manganese in topsoil (MnS) is negatively corre-lated with Cd concentration in grain (CdW). Manganese oxyhydroxides form almost all of total manganese; they are known to play a major role in the general retention
of metals, and of Cd in particular (e.g. Anderson and Christensen,1988; Zasoski and Burau, 1988; McKenzie, 1989; Alloway,1995; Backes et al.,1995).
– The NH4NO3-extracted Cd (CdN) is also positively
cor-related with CdW. These chemical species are exchange-able, and thus easily available for supplying soil solutions during plant growth (e.g. Symeonides and McRae,1977; Prüess,1997; Lebourg et al.,1996).
– The cadmium extracted by DTPA (CdD) is positively crelated with grain Cd. The former is reputedly linked to or-ganic matter, iron oxides, manganese oxides and calcium carbonate, all being phases that are easily soluble by a rather weak acid: such forms of Cd can quite easily pass into soil solutions.
– DTPA–extracted Zn (ZnD) is negatively correlated with CdW. This probably shows the effect of the well-known antagonism between Zn and Cd (Christensen and Tjell, 1991; Oliver et al.,1994,1997; Jiao et al.,2004; Kirkham, 2006).
– CaCO3is negatively correlated with grain Cd. It is known
(Alloway,1995) that active calcium carbonate in soil can fix cadmium, thus reducing its bioavailability. The pres-ence of carbonates in soils directly affects the mobility and reactivity of cadmium through surface interaction, and in-directly through their effect on soil pH (McBride,1980). On the other hand, it is not easy to see the direct significance of the “coarse sand” (CSa) and “fine sand” (FSa) variables; in
fact, if we return to the original variables it is the ratio coarse sand / fine sand that has a positive effect, but this does not provide much additional information. It is difficult to say if the ratio of these two sand fractions represents one or more latent variables.
Soil pH seems to be the most notable absentee of the model. This parameter is, however, universally considered as an essential factor for the phyto-availability of cadmium, which increases rapidly with decreasing pH (e.g. Anderson and Christensen, 1988; Christensen and Tjell, 1991; Halen, 1993; Kirkham,2006). It is one of the major variables of the grain Cd prediction model when independently processing the ‘La Châtre’ dataset (Baize and Tomassone,2003a, b). In fact, pH correlates with several other variables (in particular with NH4NO3–extracted Cd (CdN)). As a consequence, it does not
formally appear in the models but acts as a latent variable. We could have introduced pH with or instead of CdN in the model, but this would not be the best choice: in the first case, the significant effects of these variables would disappear (and the model would be more unstable due to this collinearity effect); in the second case, the fitting and standard error for prediction would be worse. Note that correlation coefficients between Cd concentration in grain and, respectively, pH and CdN are –0.25 and 0.57; the second is already much higher, see Figure7.
Iron is also absent from the model, though it is generally as-sumed that Fe oxides/hydroxides are more important than Mn oxides for metal adsorption. A probable explanation is that the total manganese content of a soil sample (MnS) roughly corre-sponds to all present Mn oxides, all of which being potentially active in the retention of cadmium, whereas total iron (FeS) includes a variable quantity (depending upon the soil type) of constituent iron in the silicate crystalline lattices that plays no role in the retention of trace metals.
For all the reasons previously listed (see box), it would not have been surprising not to find any relations between the variables measured on surface-horizon soil samples, dried and sieved to 2 mm, and the mineral composition of the plant organ “wheat grain”.
And yet, canonical correlation analysis shows a very strong link between the [set of 24 soil variables] that defines the “soil supply” and the [set of 9 wheat variables]. In addition, it seems possible to predict correctly the risk of Cd absorption from the soil and its accumulation in wheat grains with a predic-tive model using seven analytical variables measured on top-soil samples.
The model that gives the best results for predicting Cd con-centrations in grains (CdW) considers the total manganese content in soil (MnS), the cadmium and zinc extracted with DTPA (CdD and ZnD), the cadmium extracted with ammo-nium nitrate (CdN), the calcium carbonate content, and the two grainsize fractions FSa (fine sand) and CSa (coarse sand).
The fact that our empirical and very classic method has yielded such precise results is undoubtedly due to a judicious choice of the measured variables, e.g. total Mn in topsoils and the two reagents used for partial extraction, DTPA and ammo-nium nitrate.
These relations have hardly been disturbed by a “culti-var” effect, which is known to be strong as far as cadmium
is concerned in wheat grains (Baize et al.,2003). The wheat of the 198 sites belongs to only two varieties, ‘Trémie’ and ‘Soissons’, both of which are among the most cadmium-accumulating French varieties (Vinkel,2001).
Cd assessment in grains using total soil Mn and the amounts of Cd or Zn selectively extracted by two reagents therefore can be said to be meaningful from a pedogeochemical point of view. Mn oxyhydroxides are known to play a major role in the retention of trace metals while NH4NO3-extracted Cd is
supposed to be exchangeable, whereas DTPA-extracted Cd or Zn are supposed to be bound to organic matter and iron oxides. These results therefore confirm the importance of man-ganese oxides for the understanding of Cd- and Zn-retention phenomena in soil or, conversely, for that of the absorption of these metals by plants via their root systems.
It seems that, thanks to the determination of certain carefully-selected topsoil variables, it is possible to estimate with acceptable reliability the potential danger constituted by the production of bread-wheat grain with a high Cd content. It is equally possible to evaluate the probability that a predeter-mined national or European threshold value will be exceeded. For this, only six analytical determinations (seven if pH is included) have to be made on topsoil samples: particle-size analysis (5 fractions), total Mn content, total calcium carbon-ate, Cd and Zn extracted by DTPA, and Cd extracted by am-monium nitrate. These analyses are relatively inexpensive and easy to carry out in large series.
Such predictive models can constitute a practical tool for an a priori estimation of the danger that Cd will be absorbed by the roots of the wheat plants before being transferred to the wheat ears. This will help in reducing costs by avoiding the quite delicate analyses on wheat grains.
Finally, another question also requires an answer. Are the results obtained on “ordinary” agricultural soil also usable for agricultural soil near towns or industrial sites that can be vari-ably polluted? The first elements of an answer are provided by the dozen ‘Limousin’ sites, which are clearly contaminated by cadmium of industrial origin via sewage-sludge applications, and whose high Cd contents in wheat grains are correctly pre-dicted by the model. More precisely, these soils were deleted from the original sample of 198 sites; and a new model was designed in which the ‘Limousin’ sites were correctly fitted. The “soil” variables selected by statistical calculations there-fore have a general agronomical and pedological significance, which renders them sensitive to speciation changes induced by man-made inputs. If on new sites the new values of X and Y give the ukand vkvalues and if these values are aligned on the
limits of the lines vk= rkuk, an extrapolation might be
consid-ered; Figure3for u1 and v1 and the equivalent ones with the
eight others vk= rkukgive an exact illustration of what can be
done.
4. CONCLUSION
Working on a large dataset of 198 sites with diverse soil types and using canonical correlation analysis, we demon-strated that strong numerical links exist between [24 topsoil
variables] and [7 grain variables] for winter wheat. Such a fact had never been shown so clearly before, and that despite the-oretical difficulties. In addition, a regression model was found for Cd content in grains. Indeed, grain Cd is positively cor-related with soil DTPA-extracted Cd and NH4NO3–extracted
Cd and is negatively correlated with soil CaCO3content, total
Mn content and DTPA-extracted Zn. This regression model could thus allow an accurate prediction of Cd for winter wheat grains, avoiding resorting to delicate and costly grain analyses.
Acknowledgements: Thanks are due to the institutions that have
fi-nanced the research programmes: (i) ‘QUASAR’ (AIP AGREDE) was funded by the National Institute for Agricultural Research (INRA) and the French Agency for the Environment and Energy Management (ADEME); (ii) ‘GESSOL-La Châtre’ was funded by the French Ministry for Territorial De-velopment and the Environment, now the Ministry of Ecology and Sustainable Development.
REFERENCES
Adams M.L. Zhao F.J., McGrath S.P., Nicholson F.A., Chambers B.J. (2004) Predicting Cadmium Concentrations in Wheat and Barley Grain Using Soil Properties, J. Environ. Qual. 33, 532–541. Alloway B.J. (1995) Cadmium, in: Alloway B.J. (Ed.), Heavy metals in
soils, Second edition, Blackie Academic & Professional, Glasgow, 368 p.
Anderson P.R., Christensen T.H. (1988) Distribution coefficients of Cd, Co, Ni and Zn in soils, J. Soil Sci. 39, 15–22.
Backes C.A., McLaren R.G., Rate A.W., Swift R.S. (1995) Kinetics of cadmium and cobalt desorption from iron and manganese oxides, Soil Sci. Soc. Am. J. 59, 778–785.
Baize D., Tomassone R. (2003a) Modélisation empirique du transfert du cadmium et du zinc des sols vers les grains de blé tendre, Étude et Gestion des Sols 4, 219–238.
Baize D., Tomassone R. (2003b) Predictive models of the Cd concentra-tion in the winter wheat grain using topsoil analytical data, Proceed. 7th ICOBTE, Uppsala, SP 3.
Baize D., Deslais W., Gaiffe M. (1999) – Anomalies naturelles en cad-mium dans les sols de France, Étude et Gestion des Sols 2, 85–104. Baize D., Mench M., Sappin-Didier V., Mocquot B., Gomez A., Proix N., Sterckeman T. (2003) Phytodisponibilité des éléments traces métalliques dans les grains de blé, in: Tercé M. (Ed.), Dossiers de l’environnement de l’INRA n˚ 25, , Paris, pp. 45–62.
Bellanger L., Baize D., Tomassone R. (2006) L’analyse des corrélations canoniques appliquée à des données environnementales, Revue de Statistiques Appliquées LIV 4, 7–40.
Chaudri A., Allain C., Badawy S.H., Adams M., McGrath S., Chambers B. (2001) Cadmium content of wheat grain from a long-term field experiment with sewage sludge, J. Environ. Qual. 30, 1575–1580. Christensen T.H., Tjell J.C. (1991) Sustainable management of heavy
metals in agriculture, Example: cadmium, in: Farmer J.G. (Ed.), Proc. Int. Conf. Heavy Metals in the Environment, Edimburgh, Vol. 1, pp. 40–49.
CSHPF (Conseil Supérieur d’Hygiène Publique de France) (1996) Plomb, cadmium et mercure dans l’alimentation : évaluation et ges-tion du risque, Tec & Doc, Lavoisier, Paris.
Courbe C., Baize D., Sappin-Didier V., Mench M. (2002) Impact de boues d’épuration anormalement riches en cadmium sur des sols agricoles en Limousin, Actes des 7eJNES, Orléans, pp. 15–16.
DIN (Deutsches Institüt für Normung) (1995) Bodenbeschaffenheit. Extraktion von Spurenelemente mit Ammonium-nitratlösung. Vornorm DIN V 19730, in: Boden – Chemische Bodenunter-suchungsverfahren, ed. DIN, Berlin.
Garrett R.G., Maclaurin A.I., Gawalko E.J., Tkachuk R., Hall G.E.M. (1998) A prediction model for estimating the cadmium content of durum wheat from soil chemistry, J. Geochem. Explor. 64, 101– 110.
Gittins G. (1980) Canonical Analysis. A review with Applications in Ecology, Springer Verlag, Berlin.
Gonzalez I., Déjean S., Martin P.G.P., Baccini A. (2008) CCA: An R Package to Extend Canonical Correlation Analysis, J. Stat. Software 23, 1–14.
Grant C.A., Bailey L.D., McLaughlin M.J., Singh B.R. (1999) Management factors which influence Cadmium concentration in crops. A review, in: McLaughlin M.J., Singh B.R. (Eds.), Cadmium in soils and plants, Kluwer Acad. Publishers, Dordrecht, pp. 151– 198.
Halen H. (1993) Distribution et cinétique de mobilisation du cadmium dans le sol, Thèse, Louvain la Neuve, 151 p.+ annexes.
Hotelling H. (1936) Relations between two sets of variables, Biometrika, 28, 321–377.
Hough R.L., Young S.D., Crout N.M.J. (2003) Modelling of Cd, Cu, Ni, Pb and Zn uptake, by winter wheat and forage maize, from a sewage disposal farm, Soil Use Manage. 19, 19–27.
Hovmand M.F., Tjell J.C., Mosbaek H. (1983) Plant uptake of airborne cadmium, Environ. Pollut., Series A 30, 27–38.
Jiao Y., Grant C.A., Bailey L.D. (2004) Effects of phosphorus and zinc fertilizer on cadmium uptake and distribution in flax and durum wheat, J. Sci. Food Agr. 84, 777–785.
Kirkham M.B. (2006) Cadmium in plants on polluted soils: Effects of soil factors, hyperaccumulation, and amendments, Geoderma 137, 19–32.
Lebourg A., Sterckeman T., Ciesielski H., Proix N. (1996) Intérêt de différents réactifs d’extraction chimique pour l’évaluation de la biodisponibilité des métaux en traces du sol, Agronomie 16, 201– 215.
Lebourg A., Sterckeman T., Ciesielski H., Proix N. (1998) Trace metal speciation in three unbuffered salt solutions used to assess their bioavailability in soil, J. Environ. Qual. 27, 584–590.
Lindsay W.L., Norvell W.A. (1978) Development of a DTPA soil test for zinc, iron, manganese and copper, Soil Sci. Soc. Am. J. 42, 421– 428.
McBride M.B. (1980) Chemisorption of Cd2+on calcite surfaces, Soil
Sci. Soc. Am. J. 44, 26–28.
McKenzie R.M. (1989) Manganese oxides and hydroxides, in: Dixon J.B., Weed S.B. (Eds.), Minerals in soil environments, 2nd ed., Chap. 9, pp. 439–465.
Meers E., Unamuno V., Vandegehuchte M., Vanbroekhoven K., Geebelen W., Samson R., Vangronsveld J., Diels L., Ruttens A., Du Laing G., Tack F. (2005) Soil-solution speciation of Cd as affected by soil characteristics in unpolluted and polluted soils, Environ. Toxicol. Chem. 24, 499–509.
Mench M., Baize D., Sappin-Didier V., Sagot S., Sterckeman T., Courbe C., Gomez A. (2001) Trace elements contents in winter wheat grain depending on soil types (QUASAR programme - France), Proc. 6th ICOBTE, Guelph, p. 325.
Mitchell L.G., Grant C.A., Racz G.J. (2000) Effect of nitrogen application on concentration of cadmium and nutrient ions in soil solution and in durum wheat, Can. J. Soil Sci. 80, 107–115.
Norvell W.A., Wu J., Hopkins D.G., Welch R.M. (2000) Association of Cadmium in Durum Wheat Grain with Soil Chloride and Chelate-Extractable Soil Cadmium, Soil Sci. Soc. Am. J. 64, 2162–2168. Oliver D.P., Schultz J.E., Tiller K.G., Merry R.H. (1993) The effect of
crop rotations and tillage practices on cadmium concentration in wheat grain, Aust. J. Agr. Res. 44, 1221–1234.
Oliver D.P., Hannam R., Tiller K.G., Wilhelm N.S., Merry R.H., Cozens G.D. (1994) The effects of zinc fertilisation on cadmium concentra-tion in wheat grain, J. Environ. Qual. 23, 705–711.
Oliver D.P., Wilhelm N.S., McFarlane J.D., the late Tiller K.G., Cozens G.D. (1997) Effect of soil and foliar applications of zinc on cad-mium concentration in wheat grain, Aust. J. Exp. Agr. 37, 677–681. Oliver D.P., Tiller K.G., Alston A.M., Naidu R., Cozens G.D. (1999) A comparison of three soil tests for assessing Cd accumulation in wheat grain, Aust. J. Soil Res. 37, 1123–1138.
Prüess A. (1997) Action values for mobile (NH4NO3-extractable) trace
elements in soils based on the German national standard DIN 19730. Contaminated Soils, Paris (France) May 15–19, 1995, INRA Paris (Les colloques n˚ 85), pp. 415–423.
Rieuwerts J.S., Thornton I., Farago M.E., Ashmore M.R. (1998) Quantifying the influence of soil properties on the solubility of metals by predictive modelling of secondary data, Chem. Spec. Bioavailab. 10, 83–94.
Sappin-Didier V., Mench M., Baize D., Brayette S., Jadé C., Masson P. (2001) Relationship between indicators of Cd exposure and Cd in wheat grain, Proc. 6th ICOBTE, Guelph, p. 596.
Sauerbeck D.R., Styperek P. (1985) Evaluation of chemical methods for assessing the Cd and Zn availability from different soils and sources, in: Leschber R., Davis R., L’Hermite P. (Eds.), Chemical methods for assessing bioavailability of metals in sludges and soils. EUR 9538, Elsevier, London, pp. 49–67.
Sterckeman T., Baize D., Mench M., Proix N., Gomez A. (2001) Comparison of three chemical extraction methods for assessing the availability of Cd, Cu, Pb and Zn to winter wheat, Proc. 6th ICOBTE, Guelph, p. 645.
Symeonides C., McRae S.G. (1977) The assessment of plant-available cadmium in soils, J. Environ. Qual. 6, 72–77.
Tomassone R., Audrain S., Lesquoy-de Turckheim E., Millier C. (1992) La régression : nouveaux regards sur une ancienne méthode statis-tique, Masson, Paris, 2eéd.
Tremel-Schaub A., Feix I. (2005) Contamination des sols, Transferts des sols vers les plantes, EDP Sciences et ADEME Éditions.
Van Lune P., Zwart K.B. (1997) Cadmium uptake by crops from the sub-soil, Plant Soil 189, 231–237.
Venables W.N., Ripley B.D. (1997) Modern Applied Statistics with S-Plus, 2nd ed., Springer-Verlag, New York.
Vinkel B. (2001) Analyse de la composition en éléments traces dans le grain de variétés de blé (programme Quasar INRA/ITCF), Mémoire DESS, Bordeaux 2.
Zasoski R.J., Burau R.G. (1988) Sorption and sorptive interaction of cad-mium and zinc on hydrous manganese oxide, Soil Sci. Soc. Am. J. 52, 81–87.