HAL Id: hal-02566443
https://hal.telecom-paris.fr/hal-02566443
Preprint submitted on 7 May 2020
HAL is a multi-disciplinary open access archive for the deposit and dissemination of sci-entific research documents, whether they are pub-lished or not. The documents may come from teaching and research institutions in France or
L’archive ouverte pluridisciplinaire HAL, est destinée au dépôt et à la diffusion de documents scientifiques de niveau recherche, publiés ou non, émanant des établissements d’enseignement et de recherche français ou étrangers, des laboratoires
Consumers’ Mobility, Expenditure and Online- Offline
Substitution Response to COVID-19: Evidence from
French Transaction Data
David Bounie, Youssouf Camara, John Galbraith
To cite this version:
David Bounie, Youssouf Camara, John Galbraith. Consumers’ Mobility, Expenditure and Online-Offline Substitution Response to COVID-19: Evidence from French Transaction Data. 2020. �hal-02566443�
Consumers’ Mobility, Expenditure and
Online-Offline Substitution Response to COVID-19:
Evidence from French Transaction Data
∗
David Bounie
†, Youssouf Camara
‡and John W. Galbraith
§May 7, 2020
Abstract
This paper investigates a number of general phenomena connected with consumer behaviour in response to a severe economic shock, using billions of French card trans-actions measured before and during the COVID-19 epidemic. We examine changes in consumer mobility, anticipatory behaviour in response to announced restrictions, and the contrasts between the responses of online and traditional point-of-sale (off-line) consumption expenditures to the shock. We track hourly, daily and weekly re-sponses as well as estimating an aggregate fixed-period impact effect via a difference-in-difference estimator. The results, particularly at the sectoral level, suggest that re-course to the online shopping option diminished somewhat the overall impact of the shock on consumption expenditure, thereby increasing resiliency of the economy.
Key words: COVID-19, consumption expenditure, consumer mobility, online com-merce, resiliency, transaction data.
Journal of Economic Literature classification: E21, E62, E61
∗This research has been made possible by the collaboration of Groupement des Cartes Bancaires CB, and was conducted within the Research Chair “Digital Finance” under the aegis of the Risk Foundation, a joint initiative by Groupement des Cartes Bancaires CB, Telecom Paris and University of Paris 2 Panth´eon-Assas. We would like to thank Philippe Durand, Ludovic Francesconi, Niels Johannesen, Kat´erina Levallois, Loys Moulin, Samuel Willy, Hafid Chakir and Saeideh Monirijavid for their helpful comments on earlier versions of the paper.
†i3, CNRS, Telecom Paris, Institut Polytechnique de Paris; Email: david.bounie@telecom-paris.fr. ‡i3, CNRS, Telecom Paris, Institut Polytechnique de Paris; Email: yocamara@telecom-paris.fr. §Department of Economics, McGill University; CIREQ, CIRANO; Email: john.galbraith@mcgill.ca.
1
Introduction
Faced with a significant shock, economic agents must adapt. The nature of that adaptation, and the degree to which adaptation may limit the impact of the shock, is of great importance for the resiliency of the economy as well as being of inherent interest. This paper studies this aspect of consumer behaviour in the context of one of the most significant economic shocks that has been observed, the restrictions imposed in response to the COVID-19 epi-demic, using an exceptionally rich and detailed data set of French consumer transactions, both online and point-of-sale (‘off-line’).
The World Health Organization received the first report of a suspected outbreak of a novel coronavirus named COVID-19 in Wuhan, China on December 31, 2019. The out-break subsequently affected countries worldwide. As of April 24, 2,710,238 people have been diagnosed with COVID-19 and over 190,889 deaths have been confirmed (John Hop-kins University and Medicine, 2020).1 At the time of writing, France has the fourth highest number of deaths per capita after Spain, Italy and Belgium, with 28.9 deaths per 100,000 population (John Hopkins University and Medicine, 2020). To halt the spread of infection and isolate infected or exposed individuals from the general population, major public pol-icy measures that include shutdown, mobility restrictions, and mandatory containment have been put in place, and have caused severe declines in the level of output in many economies (Atkeson,2020a;Piguillem and Shi,2020;Guerrieri et al.,2020;Eichenbaum et al.,2020;
McKibbin, 2020), with consumers’ expenditure potentially dropping by around one-third (OCDE,2020;INSEE,2020).
In such a rapidly changing environment, it is extremely difficult to quantify the mag-nitude of the impact on such measures on GDP, consumer spending, and business sales;2 official macroeconomic data are limited in frequency, accuracy and coverage, and little is known about how economic activity adapts at the hourly, daily and weekly scales.
The objective of this paper is to investigate this economic adaptation, using data from
1For further information, please consult the coronavirus resource center: https://coronavirus.jhu.edu. 2Hassan et al.(2020) has developed text-based measures of the costs, benefits, and risks listed firms in the US and over 80 other countries associate with the spread of COVID-19. They identify which firms expect to gain or lose from an epidemic disease and which are most affected by the associated uncertainty as a disease spreads in a region or around the world. They find that firms’ primary concerns relate to the collapse of demand, increased uncertainty, and disruption in supply chains. Bartik et al.(2020) use survey data to shed light on how COVID-19 is affecting small businesses. They confirm mass layoffs, closures, and financial fragility for small businesses.
billions of French consumer transactions before and during the shock induced by COVID-19. We document changes in consumer mobility, changes in consumption patterns in time (hourly, daily and weekly), by region (Paris/Other), by economic sector, and by channel (of-fline/online). To characterize the overall effect we estimate difference-in-difference models of the impact on consumption before and after the lockdown, and we study how the online channel can help consumers and the economy to mitigate the cost of mobility restrictions.
To do so, we exploit one of the richest data sets that has been made available to re-searchers, consisting of the set of transactions made on millions of bank cards in France, over the period before the mandatory containment, namely January - March 16 2019 and 2020, and the period during the containment, namely March 17 to April 19 2019 and 2020, totaling nearly 4.5 billion transactions.3 The detailed information on timing and location of the transaction, and nature of the merchant, allows us to draw conclusions at an exceptional level of detail and to explore patterns both in space and time in individuals’ consumption expenditures. In particular, we are able to characterize regular expenditure patterns within the week and within the day, and to study the mobility of cardholders (consumers) be-fore and during the containment. Moreover, because it is possible to separate online and point-of-sale (or ‘off-line’), Paris and others cities’ transactions, we are able to contrast the patterns of consumption observable in each of these four classes of consumer payment. Perhaps most importantly, we are able to investigate the degree to which the availability of two shopping channels (online and off-line) may have enabled consumer adaptation and increased economic resiliency.
The present paper uses nearly five billion payment card data from approximately 70 million cards issued by all banks in France; in so doing, we avoid the potential for bias arising from the use of data from specialized means of payment which may be used by a small fraction of the general population. Because the sample is from France, in which there was a national plan with which all administrative regions and cities had to comply without exception, there is uniformity of the measures throughout the geographical sample. The location information in the data also permit us to analyse changes in consumer mobility by measuring distances between successive purchases in different locations. As well, we are also able to separate in-store (off-line) from online transactions, and analyse how the
3These data were made available thanks to a partnership with Groupement des Cartes Bancaires CB, and we exploit the card payments data in accordance with the EU General Data Protection Regulation, in application of Article 89. We use the abbreviation ‘CB’ to indicate the source of the card payments.
online channel has contributed to mitigation of the economic shock.4
A number of results emerge. First, the mandatory containment has significantly affected consumers’ mobility: cards travelled on average one-quarter of the total distance during the containment period in 2020 compared with the same period in 2019, visited fewer cities (65% of cards were used a single city compared with 26% in 2019), spent more in the home city (64% of transaction values are recorded in the home city during the containment period versus 13% in 2019), and are concentrated on a lower number of retailers (58% of cards were used only at retailers located in the home city during the containment in 2020, compared with 26% of cards in the corresponding period in 2019). Second, we estimate strongly significant declines in both value and volume (50% and 59% respectively) during the containment period, and a strongly significant increase in average transaction volume (20%), consistent with fewer shopping trips but a greater value of purchases in each; we observe that the overall decline in consumer spending is significantly greater at the end of the day, at the end of the week, in physical stores (compared to online) and, in Paris (com-pared with other cities and regions). We also find that consumers responded strongly to announcement of the containment restrictions, first with some anticipatory purchases – the total transaction value increased by almost 40% on the last day before the containment pe-riod, March 16 – and second by a dramatic drop in the first days of containment, stabilizing thereafter at around -60%. Third, the online/off-line comparison and sectoral decompo-sitions permitted by our data provide insight into the importance of the online option in mitigating the effects of the shock. We find that the overall decline in off-line expenditure, around -60%, was approximately twice as great as the decline in online expenditure, stabi-lizing at approximately -30%. We also note a number of sectors of the economy, typically those for which physical delivery of goods to a consumer’s home is feasible, in which on-line purchases increased during the period of containment, thereby mitigating the effects of reduced consumer mobility and potentially diminishing the overall impact on aggregate consumption and therefore national income.
This paper is one of the first to investigate the causal impact of Covid-19 pandemic on consumers’ mobility, expenditure and online-offline substitution. It therefore contributes to a large literature on household expenditure (see among othersSouleles 1999;Johnson et al.
4Relatedly,Chiou and Tucker(2020) show that having high-speed I internet access can explain part of the observed inequality in individuals’ ability to self-isolate.
2006; Agarwal et al. 2007;Agarwal and Qian 2014; Kaplan and Violante 2014;Di Mag-gio et al. 2017; Baker 2018), to a recent literature on consumer mobility (Agarwal et al. 2019a; Bounie et al. 2020), and finally to the extensive recent literature on the economic consequences of the COVID-19 that spans macroeconomic perspectives (Atkeson, 2020a;
Piguillem and Shi,2020;Guerrieri et al.,2020;Eichenbaum et al.,2020;McKibbin,2020), financial markets (Alfaro et al., 2020; Baker et al., 2020a), labour markets (Alon et al.,
2020; Dingel and Neiman, 2020), health (Kuchler et al., 2020; Atkeson, 2020b), social distancing (Jones et al., 2020; Chiou and Tucker, 2020), and firms and households. The present study pertains to the last category, and specifically to households.
Chen et al.(2020) use daily transaction data in 214 cities to study the impact of COVID-19 on consumption after China’s outbreak in late January 2020. China was the first country to experience a large-scale outbreak, and the first country to implement drastic measures to contain the spread, e.g. lockdown, social distancing, tracing, and closure of non-essential activities. The authors use transaction data from one of China’s largest payment service providers, UnionPay, which covers around 30% of China’s total retail consumption offline. Using difference-in-differences regressions to estimate effects on daily offline consump-tion, they find that heavily exposed cities, such as Wuhan, saw their offline consumption reduced by close to 70% during a twelve-week period, and infer that China’s 2019 GDP decreased by 1.2%. Carvalho et al. (2020) also use transaction data, from BBVA, the second-largest bank in Spain, to analyse the dynamics of expenditure during the ongoing COVID-19 pandemic. They find a significant reduction of about 49% in aggregate expen-diture when compared with the same period in 2019. They also find sectoral and regional variations in expenditure change in the data, and that off-line expenditure declined sub-stantially more than the online expenditure after the national lockdown. Andersen et al.
(2020) is another study that uses transaction-level customer data, from the largest bank in Denmark; Denmark experienced a partial shutdown of economic activity, less restric-tive than in Spain for instance. This study finds that aggregate card spending dropped by around 25% following the shutdown. The drop is mostly concentrated in restricted goods and services, and is larger for individuals more exposed to the economic and health risks introduced by the COVID-19 crisis. Finally, Baker et al.(2020b) use a sample of several hundred thousand transactions made by 4,735 US consumers who hold accounts with a
non-profit Fintech company that works with individuals to sustain savings habits.5 They find that initially spending increased sharply, particularly in retail, credit card spending and food items, and was followed by a sharp decrease in overall spending. Households responded most strongly in states with shelter-in-place orders.
The present research differs from those just cited by analysing the payment card data of the domestic card payment scheme in France, and thus from the customers of all French banks, rather than from a single major French bank. We therefore expect excellent cover-age of French consumers and of the effects of the crisis throughout the country. The rest of the paper proceeds as follows: Section 2describes the development of the COVID-19 in France. Section 3 presents the data used in the paper. Section4 analyses consumers’ mobility. Section5documents changes in consumption expenditure over time, region and channel (off-line/online). Section6 presents estimates of formal models and our main re-sults concerning consumer behaviour, differential impacts across sectors and online/offline substitution. Section7concludes.
2
Chronology of the COVID-19 epidemic in France
In this section we will emphasize a few key dates for our later analysis.
The first three cases of COVID-19 in metropolitan France were identified as of January 24, 2020. On February 23, France put in place a four-stage plan to respond to the coro-navirus pandemic. In stage 1, from February 23, the virus was not in general circulation in the population. Stage 2 was triggered on February 29, when 100 people identified as infected. On March 12, French President Macron made his first speech on the epidemic situation, ordering the closure of kindergartens, schools and universities from Monday 16 March. By March 14, 4,500 cases were confirmed; the epidemic reached stage 3 on that date, with all places receiving non-essential public traffic closed from Sunday March 15. Exceptions included for instance pharmacies, banks, food stores, gas stations, and tobacco stores.
These measures were reinforced on Monday March 16 at 8 pm, when the French author-ities announced the introduction of new Stage 4 measures to come into force the following
5Each Fintech account is linked to a primary bank account including checking, savings, and credit card accounts.
day for a minimum period of fifteen days: from March 17 at noon (Tuesday), the popu-lation became confined to their homes except for authorised reasons, in order to slow the spread of the virus and therefore keep the number of deaths to a minimum.
All travel was reduced to what was deemed strictly necessary, companies were required to organise themselves to facilitate distance working, meetings with family or friends were no longer permitted, and breaches of the conditions were to be punished. Furthermore, in consultation with other European leaders, the borders of the Schengen area were closed and travel between non-European countries and the European Union was suspended. Full compliance with the conditions was expected to be delayed by 5 to 7 days, as travellers returned to their homes, in many cases by train.
The regions most affected were Ile-de-France (Paris), the Grand Est (Strasbourg), Au-vergne Rhˆone-Alpes (Lyon), Provence-Alpes-Cˆote d’Azur (Marseille), and Hauts-de-France (Lille) (see Figure1).6 On March 27, Prime Minister ´Edouard Philippe announced the ex-tension of the national containment until at least April 15. On April 7, the Paris Prefecture and City Hall made the decision to ban individual sports activities in the capital between 10 am and 7 pm.
Figure 1: Geographical location of outbreaks of infection
6The statistics reported in this section and displayed in Figure1are based on public data provided by the French government and availablehere.
On April 13, French authorities announced the possibility of at least partial lifting of the containment on May 11, with specific details to be determined based on monitoring of epidemiological indicators.
3
The Cartes Bancaires CB data
Official data on consumer expenditure are typically available at the monthly frequency. As a result, short-run consumption fluctuations are poorly documented in the economic liter-ature, particularly at the intra-day frequency. These relatively high-frequency fluctuations are nonetheless important in order to monitor economic activity on a day-to-day basis, par-ticularly in the context of extreme events such as the pandemic. The filtering of predictable fluctuations within the week is also necessary in order to obtain a signal of the strength of economic activity updated daily in real time.
Here we use one of the richest data sets adapted to real time analysis of economic activity: card payments. France has a mature bank card (carte bancaire) market, and Cartes Bancaires CB is one of the leading schemes, created by the French banks in 1984, and which by 2019 had more than 100 members (including payment service providers, banks and e-money institutions).7 As of 2018 there were 70.4 million CB cards in use in the CB system, and 1.77 million CB-affiliated merchants (CB,2018). Thanks to a partnership with Groupement des Cartes Bancaires CB, we are able to observe each of the card transactions very precisely. A transaction is characterized by its value, the date of the transaction, the time of day recorded to the second, the geographical location of the merchant, the statistical classification of the type of purchase, and the type of purchasing channel used during the transaction, i.e. off-line or online. The detailed information on timing and location of the transaction, the nature of the merchant, and the type of purchase, i.e. online or off-line (i.e., point-of-sale transactions), allows us to provide detailed descriptions of both intra-day and intra-week consumption fluctuations, and to contrast consumption patterns along the geographical and technological (online/off-line) dimensions.
This data set is exceptional in its coverage, allowing us to capture a significant pro-portion of all consumer expenditure in France. To appreciate the richness of the Cartes Bancaires CB data set, consider a few comparisons with national statistics provided for the
full year 2018 by the National Institute of Statistics and Economic Studies (INSEE). GDP in France in 20188 was estimated as e 2,350 billion, with e 1,221 billion (52 percent of GDP) representing household consumption expenditure. Excluding fixed charges (rents, financial services, insurances) from household consumption expenditure, as these are typi-cally paid by direct debits and credit transfers, the remaining part of consumer expenditure amounts toe 802 billion (34 percent of GDP). Comparing these figures with total CB card payments (e 465 billion), the value of CB card payments represents 20 percent of French GDP, 38 percent of total household consumption expenditure, and finally 58 percent of total household consumption expenditure excluding fixed charges.
The data set that we use in this paper takes a sample from the years 2019 and 2020, rather than the universe of transactions; the sample spans periods before and during the COVID-19 crisis and comprises 2.4 and 2.1 billion CB card transactions in 2019 and 2020 respectively, for total values of aboute 84.1 and e 74.5 billion.9 A summary of descriptive statistics is provided in Table1. We distinguish two periods in each panel: the first period before the mandatory containment, i.e. January 6 to March 16, 2019 and 2020, and the second period during the containment or the analogous points in 2019, i.e. March 17 to April 19, 2019 and 2020.10 We will compare the evolution of consumption expenditures before and during the containment period in the next sections. It is nonetheless clear even from the summary statistics in Table1that while the distributions of values are similar prior to the containment dates, there are large differences in the values of payments during the containment dates in 2019 and 2020: the average value of a card payment increases (from 35 to 41e ) as do the median (from 20 to 24 e ) and the third quantile, while the total value declines precipitously.
8We use 2018 national statistics because 2019 statistics are not yet available.
9We limit the sample to Metropolitan France, which excludes the overseas territories.
10Note, for instance, that the days analogous to January 6 2020 and March 17 2020 (Monday and Tuesday) are January 7 2019 and March 19 2019 respectively.
Table 1: Summary of descriptive statistics
Notes: This table reports the summary of descriptive statistics of card transaction values in 2019 and 2020. Q1, Median and Q3 represent the first, second and third quartiles of transaction values (in euro).
4
Changes in consumers’ mobility
As outlined in Section 2, the French government decided on March 17 to limit individ-uals’ mobility except for authorised reasons. In this section, we measure the effect of this containment on consumer mobility and expenditure outside the home city. First, we measure the distance in kilometres that each card travels between cities in the course of point-of-sale transactions, before and during the COVID-19 pandemic. Second, we ana-lyze home-city and external (’away’) expenditure patterns, again comparing before- and during-containment periods.
4.1
Consumer mobility across cities
To calculate consumer mobility, we apply the methodology developed in Bounie et al.
(2020). We measure the geographical distance between two distinct geographical pur-chasing locations such as cities, using the Haversine distance formula. The latter formula computes shortest distances between points on a sphere, as opposed to using road or rail network information. This measure requires precise information on merchants’ locations; fortunately, each transaction in our data contains a merchant identification number, a code which gives the precise postal address of the merchant including the postal code, which we use at the five-digit level.11
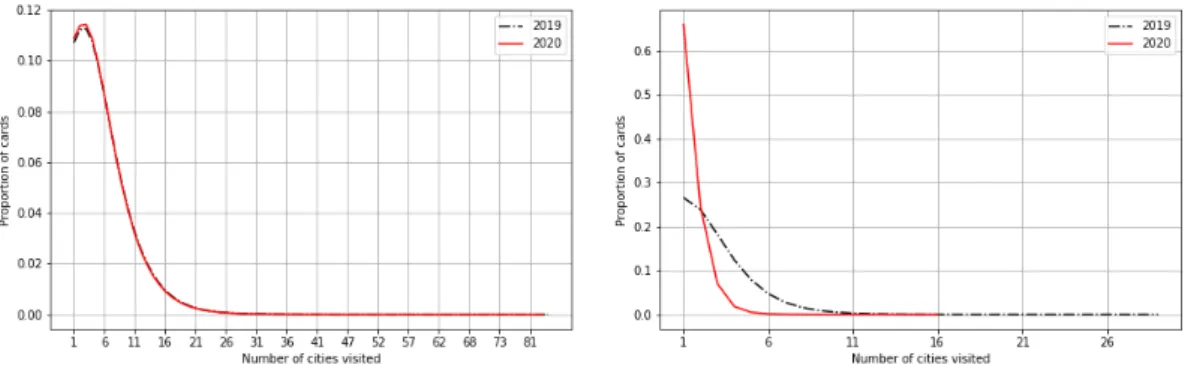
Figures2aand2bdisplay the distances traveled by 8.4 million cards, within
tan France, during comparable periods in 2019 and 2020.12 The horizontal axes indicate the interval of distances travelled in 10 kilometre intervals, truncated at 1000km and ex-cluding zero km, while the vertical axis in each figure indicates the proportion of cards (we note that approximately 64% of cards travelled zero km during containment, while the comparable figure is 26% for the same period of the previous year). In Figure 2a, we observe that before containment, the distances travelled by cards were virtually identical in 2019 and 2020. However, Figure 2bshows quite a difference between 2019 and 2020; a card travelled one-quarter of the distance on average during the 2020 containment rela-tive to the comparable period in 2019 (71 kilometres versus 315 in 2019). Similarly, while 80% of cards travelled less than 30km in 2020, the comparable figure is 500km in 2019. Outside the range of these figures, the largest values in the sample exceeded 20,000km and 18,000km for 2019 and 2020, respectively.
(a) Before containment (b) During containment
Figure 2: Distances travelled by cards between point-of-sale transactions
Figure3describes a different indicator of mobility, the number of cities and towns in which each card is used. Again, we see no pre-containment-period distinction between consumer mobility across cities in 2019 and 2020 (Figure 3a). However, we observe in Figure3bthat a 65% of cards were used in a single city during the containment in 2020,, compared with 26% in 2019. The maxima are 16 cities visited in 2020, and 29 in 2019.
12‘Metropolitan France’ excludes overseas territories. We use a sample of valid cards over the periods; for comparability, we randomly select among cards valid throughout the year 2019 and the period of interest in 2020.
(a) Cities - Before containment (b) Cities - During containment
Figure 3: Card mobility by number of cities
4.2
‘Home’ and ‘away’ expenditures
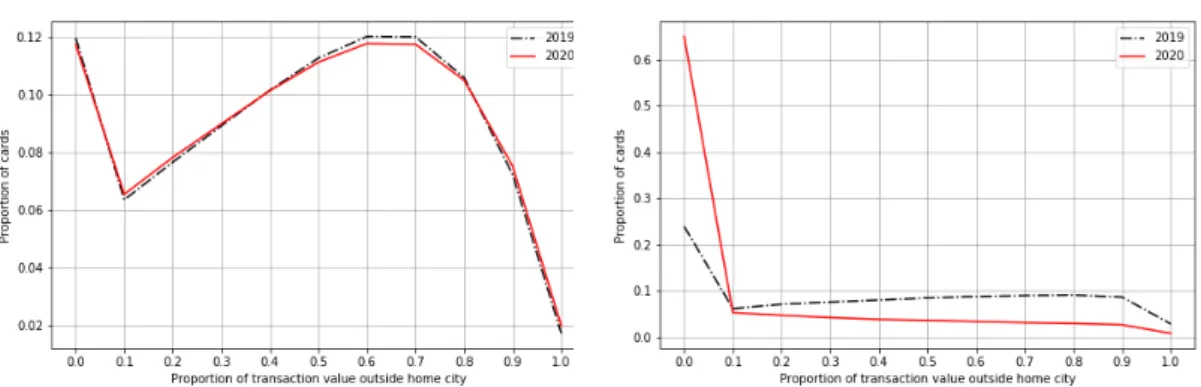
In the previous section we looked at consumer mobility without reference to a home base. In this section we consider consumer expenditures in or outside the cardholder’s home location, to assess the impact of the containment measure. We start by defining a card’s home city or d´epartement as the location in which the largest number of transactions takes place;13 next we compute the proportions of transaction values taking place in the home location, and externally (’away’) for each card, whether before or during the containment.14
Figure4plots the proportions of transactions made externally to the home city, at inter-vals of 0.1, before and during the relevant periods in 2019 and 2020. We observe in Figure
4a that 88% of the transactions values occurred outside the home city in 2019 and 2020 before containment, with the most commonly occurring outcomes in the range of 60-80% of transaction value occurring outside the home city. Regarding containment and the com-parable period of 2019, we see in Figure 4b that the proportions of transactions outside the home city was much lower in 2020: 36% of transaction value was recorded outside the home city during the containment period, compared with 87% for comparable dates in 2019. (Note the difference in scales of the figures, to accommodate the high value at zero in 2020.)
13We use the before-containment period to define the cardholder’s home region. 14For more details concerning these measures, seeBounie et al.(2020).
(a) Before containment (b) During containment
Figure 4: Consumption expenditures in value outside home city
The distinction between home and away expenditure patterns is also visible in the num-ber of point-of-sale retailers visited before and during containment. Recall that in addition to containment, the French government imposed the closure of non-essential public places of business such as hotels, restaurants, and bars. Figures 5aand5bexhibit the number of retailers from which any purchases were made. We see that the number of retailers making sales was substantially lower during the containment in 2020 than at the same period in 2019. More precisely, 58% of cards were used in retailers located in the home city during the containment in 2020, and a small proportion of cards are used in retailers outside the home city; in contrast, 26% of cards were used only in the home city at the same period in 2019.
(a) Before containment (b) During containment
5
Changes in patterns of consumption
In this section, we document changed patterns of consumption expenditure arising from mobility restrictions and closures of non-essential activities. We emphasize the aspects of these patterns that will be particularly important background to the formal analysis in the next section, particularly the online/off-line contrasts.
5.1
Daily, Intra-Day and Intra-Week Consumption Fluctuations
Figure 6 displays the aggregate value and volume of transactions per day from January 2019-20 to April 2019-20. Three observations can be made: first, economic activity is very similar for the years 2019 and 2020 up to March 15, the date at which all places receiving non-essential public traffic are closed. Second, we note a sudden increase in activity of about 40 percent on March 16, one day before the decision of the French government to order home containment. Third, with the containment in force from March 17, we observe a significant drop in activity of more than 60 percent in value and number of transactions in the three weeks following the containment.
(a) Value (b) Volume
Figure 6: Daily Consumption Fluctuations, January-April 2019-20
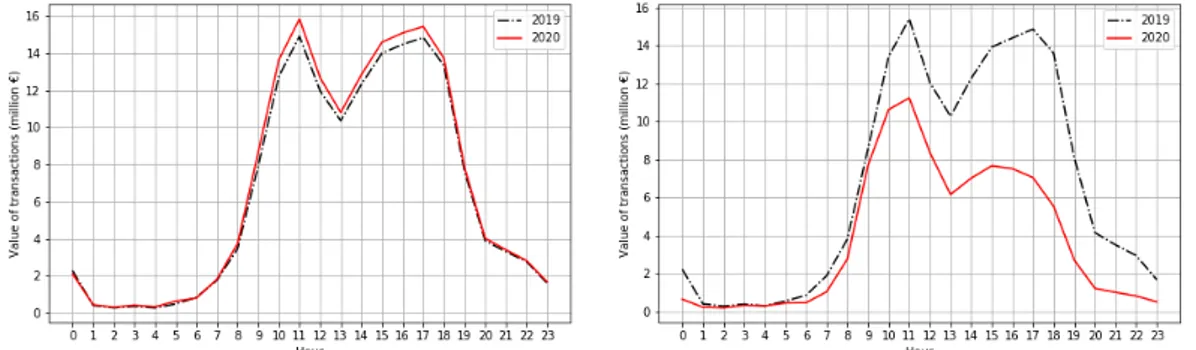
A similar description of economic activity throughout the day can be conducted before and during the containment, focusing mainly on the value of transactions, as we observe very similar patterns for the volume of transactions (as illustrated in Figure 6). Figure7
displays the value of card payments made in France at each hour of the day before and during containment. For the pre-containment period, we average all days from January 6 through March 16 inclusive; for the containment period, we average for all days from
March 17 to April 19. We note that economic activity follows a bi-modal pattern with two peaks, at 11am and 5pm before containment. We also note that before containment more transactions are carried out at the end of the day than at the beginning. During contain-ment, we also observe a bi-modal pattern but the peaks are reached at 10am and 3pm, with significantly less economic activity in the afternoon.
(a) Value - Before containment (b) Value - During containment
Figure 7: Intra-Day Consumption Fluctuations, January-April 2019-20
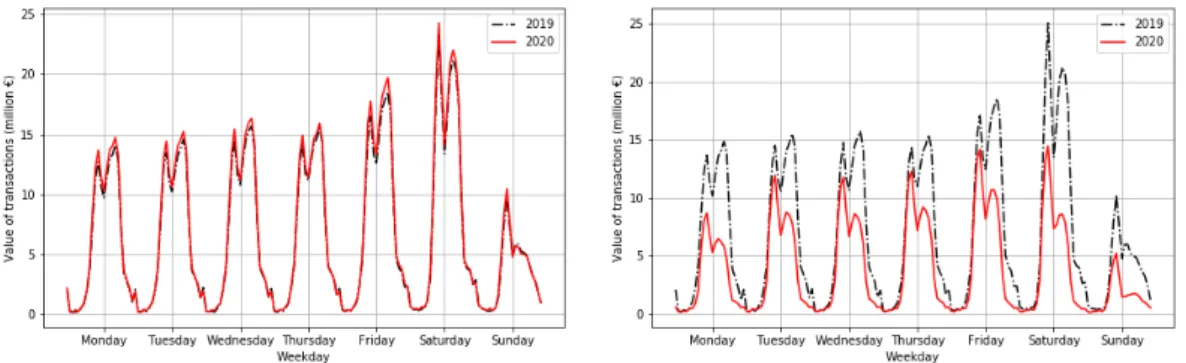
We now turn to the description of economic activity throughout the week. Figure 8
displays the total value of purchases by hour and day of the week. Before containment, we observe a similar bi-modal distribution for each day from Monday to Saturday, and increasing economic activity in the course of the week. Consumption expenditure is highest on Saturday (+28% compared with the average of the other days of the week) and is lowest on Sunday (-46% compared with the average of the other days of the week); most stores are closed on Sunday because of legal restrictions. We also observe differences in intra-day variation within the week; Saturday and Sunday show higher peaks in the morning and in the afternoon, whereas activity is slightly higher in the afternoons for the remaining days of the week. Sunday afternoon differs markedly from the other days of the week, with an afternoon consumption peak much less marked than for the other days of the week.
During the containment, economic activity is more evenly distributed over the week, but maintains the same pattern, with a significant drop in activity on Sunday. We also see that economic activity is more pronounced in the morning during containment, relative to the pre-containment period; each day of the week has a pattern of activity resembling a Sunday during the pre-containment period.
(a) Value - Before containment (b) Value - During containment
Figure 8: Intra-Week Consumption Fluctuations, January-April 2019-20
5.2
Intra-Day and Intra-Week Consumption Fluctuations: Paris
ver-sus Outside Paris
Consumption patterns vary along the geographical dimension as well. In Figures9and10, we plot intra-week and intra-day patterns of card payments analogous to those depicted in Figures 8 and 7, but separating transactions carried out in Paris, the capital, and those registered elsewhere in France, again for both 2019 and 2020. Note that Figures 9and10
display consumption patterns only during the containment period as economic activity be-fore the containment is very stable across the two years (see Figures20and21in Appendix
A).
First, we observe in Figures9aand9bthat economic activity fell significantly more in Paris than in the rest of France: -75% in Paris versus -50% in the other cities. Second, in Paris or elsewhere in France, the value of transactions was more evenly distributed over the days of the week during containment than before the containment period.
(a) Paris - During containment (b) Outside Paris - During containment
Figure 9: Intra-week Consumption Fluctuations, Paris vs. Outside Paris, January-April 2019-20
Regarding the intra-day consumption fluctuations illustrated in Figure10, we continue to observe bi-modality. However, we note that the two peaks are shifted to the right in Paris, meaning that economic activity is shifted in time by approximately one to two hours in the capital, relative to the rest of France; this finding is also valid before containment (see Figures 21aand21bin the AppendixA). Second, while proportionally more transactions take place at the end of the day in Paris in 2019, this pattern is less pronounced during the containment in 2020.
(a) Paris - During containment (b) Outside Paris - During containment
Figure 10: Intra-Day Consumption Fluctuations, Paris vs. Outside Paris, January-April 2019-20
5.3
Intra-Day and Intra-Week Consumption Fluctuations: Online
ver-sus Off-line
E-commerce is growing quickly and now represents a significant proportion of household final consumption expenditure in developed countries. In France, as illustrated in Bounie et al.(2020), the share of online consumer spending in 2019 amounted to 14.2% by volume (number of transactions) and 21.7% by value, an increase of about 0.8 (volume) and 1.2 (value) percentage points with respect to 2018. But although online purchases have become an increasingly important share of aggregate consumption, relatively little is known about the distribution of online purchases on daily and weekly scales.
Figure11 illustrates and contrasts online and offline intra-week consumption fluctua-tions in 2019 and 2020 during the containment. First, overall online activity as illustrated in11bis proportionally less affected than off-line activity (11a), particularly on Saturdays, which suggests a strengthening of the substitution effect between sales channels. Second, we see that online activity decreases in the course of the week, conversely to off-line activ-ity. Third, online activity in 2019 on Saturday was roughly equivalent to that on Sunday, while a different pattern is observed during the containment in 2020. Finally, the total value of online purchases is lower in the afternoon for all days of the week relative to off-line ac-tivity, but is significantly higher at the end of the day. This pattern is especially marked on Sunday: online activity is proportionally higher at the end of the day compared with off-line activity, and is also higher compared with activity on Sunday morning. This pat-tern clearly illustrates a substitution effect between channels: while most physical stores are closed on Sunday, consumers use the online channel for purchases.
(a) Offline - During containment (b) Online - During containment
Figure 11: Intra-Week Consumption Fluctuations, Online vs. Off-line, January-April 2019-20
Regarding intra-day consumption fluctuations, Figure 12 shows that the distributions of online transactions show somewhat less pronounced bi-modality than those off-line, and are relatively evenly distributed throughout the day.
(a) Offline - During containment (b) Online - During containment
Figure 12: Intra-Day Consumption Fluctuations, Online vs. Off-line, January-April 2019-20
6
Modelling responses to the shock and online/off-line
sub-stitution
We now turn to models with which to estimate the responses of the French economy to the shock, and the degree of substitution between the online and off-line channels for con-sumption expenditure. We begin by describing the methods and estimation strategy, and then present the main estimation results.
6.1
Methodology
We use a standard difference-in-difference regression methodology to estimate the causal effect of the COVID-19 crisis. We compare the before- and after- containment changes in daily expenditure across the relevant periods in 2020 to those in the comparable periods of 2019. The treatment group corresponds with the year 2020, and the control group cor-responds with the year 2019; the pre-treatment period is from January 6 through March 12 and the post-treatment period is from March 13 through April 19. The high degree of stability in value and volume of daily card expenditure across the two years during the pre-containment dates (as documented below) suggests that the implicit counterfactual es-timate, of 2020 expenditure in the absence of the crisis, is quite reliable.
First, we build a model similar to those ofAgarwal et al.(2007),Aaronson et al.(2012),
Agarwal and Qian(2014) andAgarwal et al.(2019b) to study the average daily expenditure response to the containment during the COVID-19 crisis. We use the following specifica-tion:
log(Yd,t) = βpre· 1pre+ βpost· 1post+ γd+ γt+ εd,t. (1)
The dependent variable log(Yd,t) is the logarithm of either total value, total volume, or
average value per card, of transactions carried out during the day d of the year t. 1pre is a
binary variable indicating one for the days before the French President’s first speech on the COVID-19 crisis (i.e., from January 27 2020 to March 12 2020), and 1post is a binary
vari-able that equals one for the days after the first announcement of a possible containment (i.e., from March 13 2020). Finally, we include fixed effects denoted γd and γt to capture mean
variations in daily and yearly transactions.15 The parameter βpost in equation (1) captures
the average 2020 daily containment expenditure response to the COVID-19 pandemic, rel-ative to the control value. βpre measures the difference in the spending trend between the
years 2020 (treatment group) and 2019 (control group) during the pre-treatment days (com-pared to the benchmark period). The validity of inference from the difference-in-difference model requires that βprebe statistically indistinguishable from zero.16
Next, we modify the first specification to allow for anticipatory behaviour of consumers:
15We also include dummy variables for special days such as public holidays and Valentine’s Day.
16Note that the difference-in-difference estimator assumes that in the absence of the treatment, average daily spending in the two years would have changed in the same way throughout the observed periods. Con-sequently, any difference observed after the containment announcement period is attributed to the COVID-19 crisis.
the actual containment period was announced several days in advance, and correspondingly we consider the specification:
log(Yd,t) = βpre· 1pre+ βannounce· 1announce+ βcontainment· 1containment+ γd+ γt+ εd,t, (2)
with 1announce, a dummy variable that is equal to 1 for the four days between the
Pres-ident’s two speeches (March 13 2020 to March 16 2020), and especially before the ex-pected announcement of the population’s confinement, and 1containment a dummy variable
that is equal to one for the days related to the containment (i.e., from March 17 2020). The coefficients associated with 1announce and 1containment in equation (2) capture therefore the
estimated average daily expenditure response to the COVID-19 crisis.
Finally, in addition to the first two specifications, we want to study the dynamics of the daily spending response to the COVID-19 crisis. We therefore consider the following distributed lag model:
log(Yd,t) =
∑
i≥January272020
βi· 1day i+ γd+ γt+ εd,t. (3)
The coefficient βMarch132020measures the immediate response in spending after the first
speech of the French President, and coefficients βMarch142020, ..., βApril192020 measure the
additional marginal responses one day through 37 days after the first speech, respectively. Similarly, coefficients βJanuary272020, ..., βMarch122020 capture the differences in spending
between the years 2019 and 2020 in the pre-treatment days. The results can be interpreted as an event study, and the coefficients will be presented graphically.
6.2
Estimation results
We now investigate different aspects of the causal impact of COVID-19 on consumer spending. We begin by estimating the average response of spending to the COVID-19 crisis, then analyze the dynamics of the spending response using a distributed lag model. We then address the possibility that the impacts may be heterogeneous across sectors, re-gions, and with respect to the online/offline distinction, which may have implications for the adjustment of the economy to the shock.
6.2.1 The average response of card spending to the COVID-19 crisis
Table 2 summarizes the estimation results for models (1) and (2). Panel A gives results on average responses card expenditures from equation (1), while Panel B represents equa-tion (2), estimating announcement effects. The dependent variables are: the logarithm of total daily value of card spending in column (1), the logarith of total daily volume of card spending in column (2), and the logarithm of value per card transaction in column (3). Since 1pre is a binary variable equal to one for the days preceding the French President’s
first speech on the COVID-19 crisis in France (i.e., from January 27 2020 to March 12 2020), the associated coefficients measure the difference in daily spending in 2020 relative to the pre-treatment days in 2019 (i.e., January 27 2020 - March 12 2020). Similarly, as 1post is a binary variable equal to one for the days after the first announcement of the
con-tainment (i.e.,≥ March 13 2020), the coefficients on 1post capture the daily card spending
response in the days following the first speech on the COVID-19 crisis.
Column 1 of Panel A of Table 2 estimates the response of transaction values. Daily card transaction values decreased on average by 46% in the period following the first con-tainment announcement. The effect is large and statistically significant at the 1% level. We also find that the card transaction volumes decreased after the first announcement (-55% column (2)), while the average value per transaction increased by 19% (column (3)). The coefficients are also both statistically and unsurprisingly significant. The results indicate that consumers made fewer transactions and spent less during the containment period, but on average the transactions that they did make were larger.
In all three columns in Panel A of Table 2, the coefficients estimated on the pre-treatment period variable (i.e., 1pre) are both economically small and statistically
insignif-icant. These results are consistent with the hypothesis that the common trend assumption of the difference-in-difference setting is not violated.
Table 2: Average Daily Spending Response to the COVID-19 Crisis
Notes: This table reports the average daily card spending response (equations (1) and (2)) to the COVID-19 crisis from January 6 2020 to April 19 2020. Panel A and Panel B represent the estimation results of equations (1) and (2) respectively, in percentages (i.e., exp(β ) − 1). The dependent variable is the logarithm of total daily value of card spending in column (1), the logarithm of total daily volume of card spending in column (2) or the logarithm of value per card transaction in column (3). 1pre is a binary variable equal to one for the days before the first french President’s speech on the COVID-19 crisis in France (i.e., from January 27 2020 to March 12 2020). 1postis a binary variable equal to one for the days after the first announcement of the containment (i.e.,≥ March 13 2020). 1announceis a binary variable equal to one for the four days during the announcement window (i.e., from March 13 2020 to March 16 2020). 1containment is a binary variable equal to one for the days during the containment (i.e., ≥ March 17 2020). All regressions include day and year fixed effects. Robust standard errors clustered at the day of the year level are reported in parentheses. ***, **, * indicate significance at the 1%, 5% and 10% levels, respectively.
Panel B of Table2addresses announcement effects, based on the equation (2) regres-sion. President Macron made his first speech concerning the pandemic on March 12 2020, and the second on March 16 2020 to announce the containment the next day; we investigate both the first and second announcement effects on consumer spending behaviour. Again,
1announce is a dummy variable indicating the four days during the announcement window
(i.e., from March 13 2020 through March 16 2020), and 1containment is a dummy variable
indicating the days during the containment (i.e., from March 17 2020 onward).
Again, the pre-announcement dummies are insignificant, compatible with the condition required for validity of the difference-in-difference analysis. There are strongly significant declines in both value and volume (50% and 59% respectively) during the containment window, and a strongly significant increase in average transaction volume (20%), consistent with fewer shopping trips but a greater value of purchases in each. Announcement effects are generally not statistically significant, although there is a borderline-significant effect of increase in average transaction value, of about 10%.
6.2.2 The dynamic response of card spending to the COVID-19 crisis
We now turn to the daily dynamic evolution of the card expenditure response, before and during the containment period. Figures 14a to 14cplot the coefficients exp(βi) − 1 from
equation (3), representing the estimated daily spending response dynamics, for i = January 27 2020 through April 19 2020, along with their corresponding 95 percent confidence intervals. The x-axis denotes the day, and the y-axis shows the coefficient, representing percentage estimated expenditure response for the given day. Again, March 13 2020 was the first day following the initial announcement, and March 17 2020 was the first day of containment.
The last day before the containment period, that is March 16, shows clear spikes in transaction values, volumes, and values per transaction; total transaction value increased by close to 40%, followed by a dramatic drop in the first days of containment, approxi-mately stabilizing thereafter: as containment officially began on March 17 2020 at noon, there was a decrease in card transaction value of about 30%, followed by a further decrease of about 60% on March 18.17 The results are similar for total card transaction volumes, while average value per transaction significantly increased in the days after the first an-nouncement window.
17Sunday, March 15 2020 was a day of warm and sunny weather in much of France, and official directives to minimize non-essential contacts were not universally respected. The President spoke again on the evening of March 16 2020 on the seriousness of the situation and the necessity of an official containment.
(a) Value (b) Volume
(c) Value per transaction
Figure 13: Estimated Daily Spending Response Dynamics
Notes: This figure plots the coefficients exp(βi) − 1 estimated from equation (3), with i = January 27 2020, January 28 2020,..., April 19 2020, along with their corresponding 95 percent confidence intervals. The x-axis denotes the day and the y-axis shows the estimated daily percentage spending response.
Figure14plots the coefficients in weekly aggregates of the data.18 We now see a more regular pattern of decline in both value and volume of transactions, and of increase in the value per transaction.
18Note that x-axis values are for the week following: for instance, the x-axis value January 27 2020 cor-responds with the week of January 27, 2020 to February 2, 2020, and February 3 2020 with the week of February 3 2020 to February 9 2020.
(a) Value (b) Volume
(c) Value per transaction
Figure 14: Estimated Weekly Spending Response Dynamics
Notes: This figure plots the coefficients exp(βi) − 1 estimated from equation (3), with i = January 27 2020, February 3 2020,..., April 13 2020, along with their corresponding 95 percent confidence intervals. The x-axis denotes the date at weekly intervals and the y-axis shows the weekly percentage spending response.
Overall, the results in Figures 13 and 14 suggest that consumers responded strongly to the containment restrictions, first with some anticipatory purchases in advance of the restrictions, followed by steep declines in the number of transactions, and an increase in the average size of each transaction as consumers economized on trips to physical stores.
6.2.3 Off-line vs online: the dynamic response to the COVID-19 crisis
The aggregate expenditure results described in the previous section may obscure important differences between traditional point-of-sale expenditures and online expenditures, which may have interesting implications. In this section we examine this off-line/online contrast, both at the aggregate and sectoral levels. We begin with a decomposition of the analysis of the previous section into off-line and online components.
We would expect online activity to be much less affected by the restrictions on physical movement of consumers, and Figure15confirms this intuition.
(a) Off-line - Day (b) Online - Day
(c) Offline - Week (d) Online - Week
Figure 15: Estimated daily and weekly response of off-line and online consumption spend-ing
Notes: This figure plots the coefficients exp(βi) − 1 estimated from equation (3), with i = January 27 2020, January 28 2020,..., April 19 2020. The x-axis denotes the day or week, and the y-axis shows the estimated percentage daily or weekly spending response.
The patterns are broadly similar in comparing off-line and online expenditures, with two noteworthy exceptions. First, the spike in off-line expenditures in the last pre-containment day does not appear in online expenditures (comparing the top two panels); since online purchases were not to be restricted, there was no reason for consumers to ‘stock up’ in the days before containment. It may also be that a large proportion of goods purchased online can be considered as non-essential for everyday life and do not require immediate supply, or do not suffer from shortages or stock-outs, such as streaming services. In fact, we observe a small dip in online expenditures before the containment announcement, possibly reflecting
reduced travel bookings.
The second important difference requires comparing the vertical scales in the figures left to right: the declines in off-line expenditure, initially approximately -60%, are approx-imately twice as great as the declines in online expenditure, initially approxapprox-imately -30%. Table 3provides the regression results and precise numerical values corresponding to the intuitions available from the figures above. However, while off-line expenditures showed little recovery in the first weeks of the containment, online expenditures grew rapidly in the first two weeks of April, to the point where the value transacted almost returned to its pre-pandemic level.
Table 3: Average Daily Off-line and Online Spending Response to the COVID-19 Crisis
Notes: This table reports average daily card spending response to the COVID-19 crisis from January 6 2020 to April 19 2020. Panel A and Panel B represent the estimation results of equation (2) in percentages (i.e., exp(β ) − 1) using off-line and online transactions, respectively. The dependent variable is the logarithm of total daily transaction value in column (1), the logarithm of total daily volume in column (2) or the logarithm of value per card transaction in column (3). 1pre is a binary variable equal to one for the days before the first speech (i.e., from January 27 2020 to March 12 2020). 1announceis a binary variable equal to one for the four days during the announcement window (i.e., from March 13 2020 to March 16 2020). 1containment is a binary variable equal to one for the days during the containment (i.e., ≥ March 17 2020). All regressions include day and year fixed effects. Robust standard errors clustered at the day of the year level are reported in parentheses. ***, **, * indicate significance at the 1%, 5% and 10% levels, respectively.
It may at first seem surprising that the value of online commerce declined at all. How-ever, online commerce comprises numerous different categories, some of which, such as travel expenditures, were also curtailed by the containment; others such as informational content can be purchased and consumed online (e.g. digital books, music, newspapers) and
so might be unaffected or even increased. In order to investigate the possibility that on-line commerce may have increased in some areas in order to compensate for the difficulty of visiting physical stores, we therefore need to do a sectoral analysis. The next section provides this.
6.2.4 Sectoral disaggregation
If online and off-line consumer transactions are able to substitute for each other, so that each provides some backup in the event of disruption to the other channel (for example, disruption by power outage for online shopping, or a period of containment which disrupts shopping in physical stores), then we would expect to see instances in which transactions of one type substitute for the other during disruption. In this section, we look for evidence of this.
The impact of the containment differed across types of business. On March 15, the French Prime Minister declared the closure of many establishments open to the public: only ‘essential businesses’ such as for instance food stores, pharmacies, banks, tobacco stores, gas stations, and all essential public services were allowed to remain open. Non-essential businesses such as restaurants, clothing stores, bars, hotels, and travel agencies among others were instructed to close down.19
Figure 16 illustrates the daily impacts on thirteen types of businesses considered as essentials.20 The broad qualitative patterns are similar for these essential activities; a sub-stantial upward spike preceding the date of containment, followed by a decline in the value of transactions and an increase in variability. Funeral services are of course an exception.
19We use the Nomenclature des Activit´es Franc¸aises (NAF) provided by the National Institute of Statistics (INSEE) to classify the business sectors. The sectors and their codes are detailed in AppendixB.
20A more regular pattern for off-line and online transactions, at the weekly level, is presented in Figure24 in AppendixC.
(a) Grocery stores (b) Food stores (c) Sale via stalls of food
(d) Mini-markets (e) Supermarkets (f) Hypermarkets
(g) Pharmacies (h) Medical goods (i) Bakeries
(j) Health (k) Gas stations (l) Tobacco stores
(m) Funeral/related activities
Figure 16: Estimated daily expenditure in some essential businesses
Notes: This figure plots the coefficients exp(βi) − 1 estimated from equation (3), i = January 27 2020, January 28 2020,..., April 19 2020. The x-axis denotes the day and the y-axis shows the estimated percentage daily spending response.
Figure 18 provides contrasting information concerning nonessential sectors.21 Most sectors tend to show a sharp and sustained decline, amounting to virtually complete closure of the sector in several cases.
21A similar dynamic response function at the weekly level for off-line and online transactions is presented in Figure26in AppendixC.
(a) Restaurants (b) Beverage stores (c) Beauty care
(d) Personal care (e) Clothing (f) Footwear stores
(g) Textile stores (h) IT equipment (i) Appliance
(j) Automotive (k) Jewellery stores (l) Department stores
(m) Flower stores (n) Leisure (o) Bookshops
Figure 17: Estimated daily expenditure in some non-essential businesses
Notes: This figure plots the coefficients exp(βi) − 1 estimated from equation (3), i = January 27 2020, January 28 2020,..., April 19 2020. The x-axis denotes the day and the y-axis shows the estimated percentage daily spending response.
(a) Toy stores (b) Sporting equipment (c) Second-hand goods
(d) Household articles (e) Construction activities (f) Hardware/paint/glass
(g) Hotels (h) Transports (i) Travel agencies
(j) Optical shops
Figure 18: Estimated daily consumption of some non-essential businesses (continued)
Notes: This figure plots the coefficients exp(βi) − 1 estimated from equation (3), i = January 27 2020, January 28 2020,..., April 19 2020. The x-axis denotes the day and the y-axis shows the estimated percentage daily spending response.
Tables4and5allow us to examine the online/off-line contrast by sector. Entries in Ta-ble4are (transformed) coefficients on the post-containment indicator variable from equa-tion (1), for a variety of expenditure classifications deemed essential or nonessential.
Table 4: Average Expenditure Response to the containment, by sector
Notes: This table reports the share of online expenditure before and during containment average daily card spending response (equation (1)) to the COVID-19 crisis from January 6 2020 to April 19 2020, by sector. Panel A and Panel B represent the estimation results (i.e., 1post) in percentages (i.e., exp(β ) − 1) for each essential and non-essential activities, respectively (1post). The dependent variable is the logarithm of total daily value of card spending in columns (1)-(3) or the logarithm of total daily volume of card spending in columns (4)-(6). 1post is a binary variable equal to one for the days after the first announcement of the containment (i.e.,≥ March 13 2020). All regressions include day and
These results on the values of 1post provide a number of interesting insights into online/
off-line substitution and the contribution of the two payment channels toward reducing the impact of the shock.
Consider first the relatively straightforward case of non-essential businesses, Panel B of Table4. All sectors show steep declines in the value and volume of off-line transactions, in several cases virtually to the point of complete elimination of off-line sales (corresponding to a coefficient 1post of -1, or 100% reduction in activity). In some cases the same is true
for online sales – hotels, travel agencies for example – because the activity in general has largely been closed down. In other cases however, online activity is much less reduced or increased, as in the case of IT equipment. This case is especially noteworthy since the purchase of IT equipment is one mechanism by which consumers are able to minimize the impacts of containment, for example by the use of tele-conferencing software.
For essential activities, Panel A, the impacts on off-line activity are generally smaller, and insignificantly different from zero in a number of cases. The estimated value of 1post
for online expenditures is positive in all but one case. There are several cases for which off-line transacted value decoff-lines while onoff-line value increases. For the volume of transactions, the results are yet clearer and quite stark: the point estimate of 1post for volume of
trans-actions conducted off-line decreases in every case, while the volume of online transtrans-actions increases in all cases but one.22
These results should be interpreted in the light of the online percentage share informa-tion contained in Table5. Panel A again describes essential services. Here, the percentage of purchases made online was generally quite small before the containment period. Even during that period, given that most essential goods remained available in stores, the overall percentage of expenditure made online tended to remain small, despite the fact noted above that there were a number of large proportionate increases. Exceptions to this general ten-dency include medical goods, for which online expenditures accounted for approximately 32% during containment, and funeral services, which reached 15%.
22Online sales at gas stations are a very small proportion of their total sales, possibly representing pre-paid cards.
Table 5: Online expenditure share(%), by sector
Notes: This table reports the online percentage share of total expenditure, before and during containment, by sector. Panels A and B represent the shares for essential and non-essential activities, respectively.
For the non-essential goods and services recorded in Table5Panel B, we see high vari-ability across sectors and in the extent of the containment effect. Pre-containment online expenditure shares were relatively high for leisure, hotel, transportation and other travel services. More striking, however, is the jump in the online share of expenditures for a number of categories in which the online share was modest before containment; beauty products and personal care, clothing and footwear, textiles, appliances, jewelry and toys are examples (Panel B, columns 5,6). These are cases for which purchases in physical stores dropped dramatically during the containment period, so that the existence of the on-line option was largely responsible for maintaining consumer access to these products; the share of expenditures made online exceeded 50% in 14 of the 25 categories during contain-ment. Overall, there is clear evidence that consumers reduced the impact of restrictions on their ability to visit physical stores through the substitution of online purchases.
Redundancy increases the resiliency of systems. The availability of two alternative channels for personal consumption expenditure has allowed consumers to reduce the im-pact of shocks: in this case a shock leading to physical containment which was mitigated through the availability of online commerce (whereas in the case of a power outage or in-ternet failure, it would be the availability of physical stores that would allow consumers to mitigate the impact). We also see that consumers adapted quickly to minimize impact of the containment measures, shifting expenditures almost immediately in response.
6.2.5 Paris vs Outside Paris
A further interesting disaggregation of the results is geographical: the contrast between Paris and the rest of France. In this section, we estimate the daily response of consumption in Paris and outside Paris before and after the March 13 speech using equation 3. In this first speech, the population was invited to limit their movements on public transport, which is widely used in large cities such as Paris, less so of course in smaller centres or rural areas. Companies were also called upon to intensify tele-working.
Figure19exhibits a contrast in responses between Paris and other areas of France. First, while we observe a 20 percent increase in consumption on March 13 in the rest of France (Figure 19b), we do not observe any significant increase in consumption in Paris (Figure
19a). Second, the increase in consumption in the run-up to the President’s second speech on March 16 is also on a smaller scale: while it amounts to almost 60 percent outside
Paris, it is 20 percent in Paris. As well, the decline in the value of transactions during the containment is substantially greater in Paris than elsewhere.
(a) Paris (b) Outside Paris
(c) Paris - Week (d) Outside Paris - Week
Figure 19: Estimated daily and weekly response of consumption spending in Paris and outside Paris
Notes: This figure plots the coefficients exp(βi) − 1 estimated from equation (3), with i = January 27 2020, January 28 2020,..., April 19 2020. The x-axis denotes the day or week, and the y-axis shows the estimated percentage expenditure response.
Tables 6 again provides the precise regression results corresponding with the figures above, indicating a significantly greater response in Paris than elsewhere. The results sug-gest the possibility that population density may be a factor in consumer response to con-tainment and mobility restrictions, although the unique position of Paris within France may also play a role.
Table 6: Paris vs Outside Paris: Average Daily Spending Response to the COVID-19 crisis
Notes: This table reports average daily card spending response to the COVID-19 crisis from January 6 2020 to April 19 2020. Panel A and Panel B represent the estimation results of equation (1) in percentages (i.e., exp(β ) − 1) for Paris and Outside Paris , respectively. The dependent variable is the logarithm of total daily value of card spending in column (1), the logarithm of total daily volume of card spending in column (2) or the logarithm of value per card transaction in column (3). 1pre is a binary variable equal to one for the days before the first french President’s speech on the COVID-19 crisis in France (i.e., from January 27 2020 to March 12 2020). 1announce is a binary variable equal to one for the four days during the announcement window (i.e., from March 13 2020 to March 16 2020). 1containment is a binary variable equal to one for the days during the containment (i.e., ≥ March 17 2020). All regressions include day and year fixed effects. Robust standard errors clustered at the day of the year level are reported in parentheses. ***, **, * indicate significance at the 1%, 5% and 10% levels, respectively.
7
Conclusion
Understanding the response of the economy to major shocks is important not only for mak-ing policy durmak-ing the time of the shock, but also for managmak-ing institutions in the economy to reduce vulnerability (increase resiliency) to shocks. However, our ability to learn about responses to shocks has been limited by the frequency and geographical resolution of eco-nomic data available from official sources.23
Recent circumstances offer the possibility of obtaining some relatively detailed knowl-edge concerning response to an extreme event. The COVID-19 pandemic is one of the greatest shocks to have arisen in many years, and the individual transaction data available through Cartes Bancaires CB offers the opportunity to study its effects at an exceptional level of detail. These data are not only available at an extremely fine time scale, but also contain locational information allowing us to study local effects and individual movements. Equally important, the data set contains information concerning the classification of good or service purchased, and whether the purchase was made online or off-line. This informa-tion, recorded for billions of transactions, allows us to draw a number of conclusions.
We are able to measure not only the extent of the decline in personal consumption expenditures, but also the decline in individual mobility, and changes in the pattern of consumption expenditures throughout the day, throughout the week, and in the division between online and off-line expenditures. Moreover, by focusing on sectors of the econ-omy for which online purchase and delivery is possible, we are also able to investigate substitution between two alternative shopping channels (online and offline), and therefore the contribution of these alternatives to increasing the resilience of the economy to such shocks. We find clear evidence in some sectors that the impact of the shock was reduced by the possibility of substitution toward the online shopping channel. Of course, for other types of shock, such as a large-scale power outage, it would be by contrast the availability of traditional point-of-sale purchases which would provide resiliency, in that case poten-tially substituting for consumers’ inability to access the online channel.
The detailed study of the response of the economy to extreme events is in its infancy,
23For example,Galbraith and Tkacz (2013) studied the response of consumer expenditure in Canada to a number of events including the SARS epidemic and the major electrical blackout, both in 2003; although some daily debit card data were available for that study, it was limited by the fact that these data were nationally aggregated, whereas the effect of shocks was localized.
but the present study points not only to a number of potentially interesting conclusions, but to many interesting directions for future research. In particular, in a subsequent study we will examine the emergence of the economy from the period of disruption, and the dynamic path of consumption recovery by sector.
References
Daniel Aaronson, Agarwal Sumit, and French Eric. The spending and debt response
to minimum wage hikes. American Economic Review, 102(7):3111–39, December
2012. doi: 10.1257/aer.102.7.3111. URL http://www.aeaweb.org/articles?id=
10.1257/aer.102.7.3111.
S. Agarwal, J.B. Jensen, and Ferdinando Monte. The geography of consumption. Technical report, National Bureau of Economic Research, working paper 23616, 2019a.
Sumit Agarwal and Wenlan Qian. Consumption and Debt Response to Unanticipated In-come Shocks: Evidence from a Natural Experiment in Singapore. American Economic Review, 104(12):4205–4230, December 2014. ISSN 0002-8282. doi: 10.1257/aer.104. 12.4205.
Sumit Agarwal, Chunlin Liu, and Nicholas S. Souleles. The reaction of consumer spend-ing and debt to tax rebates—evidence from consumer credit data. Journal of
Polit-ical Economy, 115(6):986–1019, 2007. ISSN 00223808, 1537534X. URL http:
//www.jstor.org/stable/10.1086/528721.
Sumit Agarwal, Wenlan Qian, Bernard Y. Yeung, and Xin Zou. Mobile Wallet and En-trepreneurial Growth. AEA Papers and Proceedings, 109:48–53, May 2019b. ISSN 2574-0768. doi: 10.1257/pandp.20191010.
Laura Alfaro, Anusha Chari, Andrew N Greenland, and Peter K Schott. Aggregate and firm-level stock returns during pandemics, in real time. Working Paper 26950, National
Bureau of Economic Research, April 2020. URL http://www.nber.org/papers/
w26950.