Chemical composition of indicator minerals from
orogenic gold deposits and glacial sediments of the
Val-d’Or district (Québec, Canada)
Mémoire
Donald Grzela
Maîtrise en sciences de la Terre
Maître ès sciences (M. Sc.)
Québec, Canada
© Donald Grzela, 2017
iii
Résumé
Les tourmalines, les scheelites et les magnétites provenant des gisements aurifères de type orogénique (n=22) et des sédiments glaciaires (n=5) du district minier de Val-d’Or (Québec, Canada) ont été investiguées à la microsonde électronique (EPMA) et par ablation laser et spectrométrie de masse à plasma à couplage inductif (LA-ICP-MS) afin de déterminer leur signature chimique et d’évaluer leur potentiel en tant que minéraux indicateurs pour l’exploration aurifère. Les tourmalines de Type I provenant de dépôts aurifères de type orogénique encaissés dans des roches felsiques et intermédiaires calco-alcalines montrent de faibles teneurs en V, Cr, Mn, Fe, Co, Ni, Zn et Sn et une teneur élevée en Mg par rapport aux tourmalines de Type II provenant de dépôts aurifères de type orogénique encaissés dans des roches mafiques tholéiitiques. Les tourmalines de Type III provenant de dépôts aurifères de type orogénique situés au contact entre des roches mafiques volcaniques et métasédimentaires montrent une chimie similaire aux tourmalines de Type I avec des teneurs en Li, Mn et Pb légèrement plus élevées. Les tourmalines des gisements aurifères de type orogénique sont caractérisées par des teneurs en Zn, Cu, Sn et Pb plus faibles que les tourmalines associées aux miniéralisations de type Cu-Zn, Pb-Zn-Cu et Sn. Les tourmalines récupérées dans le till portent la signature chimique des tourmalines provenant des gisements aurifères de type orogénique avec une majorité portant la signature des tourmalines de Type I. Les scheelites provenant de dépôts aurifères de type orogénique encaissés dans des intrusions calco-alcalines de composition intermédiaire sont caractérisées par des teneurs en Na, ÉTR et Y plus élevées que les scheelites provenant de dépôts aurifères encaissés dans des roches sédimentaires ou mafiques. Les scheelites récupérées dans le till portent la signature chimique des scheelites provenant des gisements aurifères de type orogénique. Les magnétites sont rare dans les dépôts aurifères de type orogénique du district de Val-d’Or. Les magnétites d’origine hydrothermale provenant des veines aurifères sont caractérisées par des teneurs plus élevées en Cr, Zn, Mn, K, Ca, Ti et Al que les magnétites d’origine magmatique retrouvées dans les roches encaissantes de composition dioritique ou gabbroique. Les magnétites associées à la minéralisation aurifère forment des grains fins disséminés (<0,05 mm), ce qui suggère que les magnétites grossières récupérées dans le till ne proviennent probablement pas des veines de quartz aurifères.
v
Abstract
Tourmalines, scheelites and magnetites from orogenic gold deposits (n=22) and glacial sediments (n=5) of the Val-d’Or mining district (Québec, Canada) were investigated by Electron Probe Micro-Analyzer (EPMA) and Laser Ablation Inductively Coupled Plasma Mass Spectrometry (LA-ICP-MS) in order to determine their chemical signature and to assess their potential as indicator minerals for gold exploration. Type I tourmalines from orogenic gold deposits hosted in felsic and intermediate calc-alkaline rocks have low contents of V, Cr, Mn, Fe, Co, Ni, Zn, and Sn and a high content of Mg compared to Type II tourmalines from orogenic gold deposits hosted in mafic tholeiitic rocks. Type III tourmalines from orogenic gold deposits located at the contact between mafic volcanic and metasedimentary rocks show a chemistry similar to Type I tourmalines with slightly higher Li, Mn, and Pb contents. Tourmalines from orogenic gold deposits are characterized by lower contents of Zn, Cu, Sn, and Pb than tourmalines associated to Cu-Zn, Pb-Zn-Cu, and Sn mineralizations. Till tourmalines carry the chemical signature of tourmalines from orogenic gold deposits with a majority carrying the signature of Type I tourmalines. Scheelites from orogenic gold deposits of the Val-d’Or district hosted in calc-alkaline intrusions of intermediate composition are characterized by high Na, REE, and Y contents compared to scheelites from sediment- or mafic-hosted gold deposits. Till scheelites carry the chemical signature of scheelites from orogenic gold deposits. Magnetites are rare in orogenic gold deposits of the Val-d’Or district. Magnetites of hydrothermal origin occuring in gold veins are characterized by higher contents of Cr, Zn, Mn, K, Ca, Ti, and Al than magnetites of magmatic origin found in the dioritic or gabbroic host rocks. Magnetites associated to the gold mineralization form fine disseminated grains (<0.05 mm), which suggests that the coarse magnetites recovered in the till probably do not originate from the gold-bearing quartz veins.
vii
Table of contents
Résumé ... iii Abstract ... v List of figures ... ix Acknowledgments ... xiii Foreword ... xv Chapter 1 - Introduction ... 1 1.1 Generalities ... 1 1.2 Research objectives ... 1 1.3 Methodology ... 21.4 Presentation of the article ... 3
Chapter 2 - Tourmaline, scheelite, and magnetite compositions from orogenic gold deposits and glacial sediments of the Val-d'Or district (Québec, Canada): application to mineral exploration ... 5
2.1 Introduction ... 5 2.2 Geological setting ... 9 2.2.1 Regional geology ... 9 2.2.2 Gold mineralization ... 11 2.2.3 Quaternary geology... 12 2.3 Methodology ... 13 2.3.1 Sample selection ... 13 2.3.2 Sample preparation ... 14 2.3.3 Analytical methods ... 15 2.3.4 Statistical methods ... 17 2.4 Results ... 18
2.4.1 Gold grains count in till ... 18
2.4.2 Petrography ... 20
2.4.3 Geochemistry of tourmalines from orogenic gold deposits and till samples ... 24
2.4.4 Geochemistry of scheelites from orogenic gold deposits and till samples ... 39
2.4.5 Geochemistry of magnetites from orogenic gold deposits and till samples ... 48
2.5 Discussion ... 50
2.5.1 Compositional variations in tourmaline ... 50
2.5.2 Discriminating tourmaline composition using principal component analysis ... 52
viii
2.5.4 Incorporation of rare earth elements in scheelite ... 55
2.5.5 Discriminating scheelite composition using principal component analysis ... 56
2.5.6 Scheelite in till: application to mineral exploration ... 57
2.5.7 Magnetite in till: application to mineral exploration ... 59
2.6 Conclusions ... 59
Chapter 3 - Conclusions ... 63
Bibliography ... 67
Appendices ... 75
Appendix I: A summary of relevant geological information for deposits used in this study ... 75
Appendix II: List of samples and thin sections from orogenic gold deposits of the Val-d’Or district ... 76
Appendix III: List of till samples ... 87
Appendix IV: List of samples disaggregated by electric pulse disaggregation ... 88
Appendix V: Processing flow sheet for heavy mineral concentrates ... 89
Appendix VI: Detection limits for EPMA analyses ... 90
Appendix VII: Detection limits for LA-ICP-MS analyses ... 93
Appendix VIII: Electron probe micro-analysis data ... 95
ix
List of figures
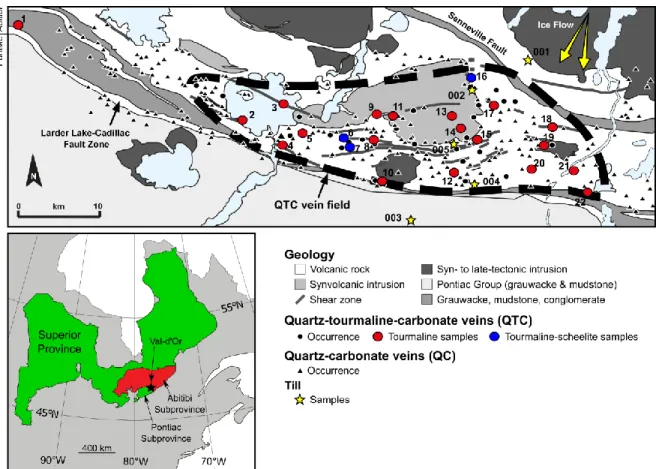
Figure 1: Simplified regional geological map of the Val-d’Or orogenic gold vein field showing the distribution of
quartz-carbonate and quartz-tourmaline-carbonate veins and till samples used in this study and the ice flow directions in the study area. Numbers in figure referring to gold deposits and prospects are as follow: 1: Lapa; 2: Kiena; 3: Siscoe; 4: Goldex; 5: Vein No. 5; 6: Sigma; 7: Lamaque Sud; 8: Audet; 9: Nord-Ouest; 10: Orenada; 11: Lac Herbin; 12: Paramaque; 13: Snowbank; 14: Canmet (nord); 15: O’Connell; 16: Beaufor; 17: Lucien Béliveau/New Béliveau; 18: Brosnor; 19: Buffadison; 20: Sigma 2; 21: Bloc Sud; 22: Lac Simon. See Appendix I for a summary of relevant geological information for each deposit. Geological map modified from Beaudoin and Pitre (2005) and ice flow directions after Paradis (2007). ... 11
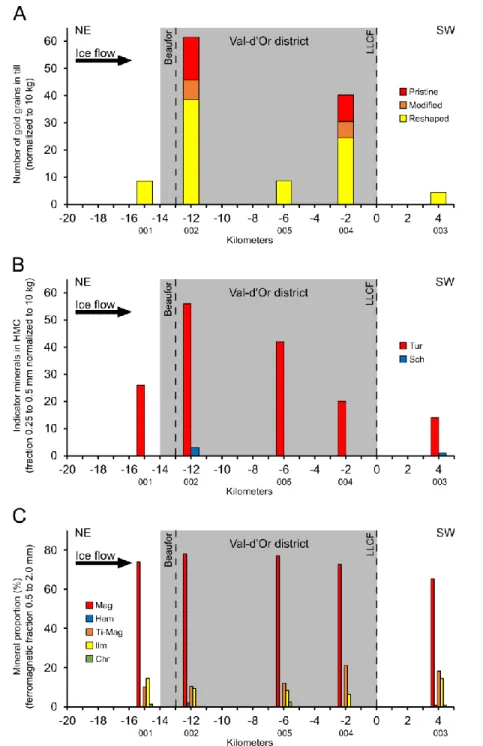
Figure 2: Proportion of indicator minerals recovered from till samples relative to distance for (A) gold grains
recovered in till normalized to 10 kg samples, (B) tourmaline and scheelite grains recovered in the HMC fraction 0.25 to 0.5 mm normalized to 10 kg samples, and (C) magnetite, hematite, titanomagnetite, ilmenite, and chromite grains recovered from the ferromagnetic fraction 0.5 to 2.0 mm. Samples 14-DG-001 (-15 km); DG-002 (-12 km); DG-005 (-6 km); DG-004 (-2 km); Larder Lake-Cadillac Fault Zone (0 km); 14-DG-003 (4 km). The gray zone represents the limits of the Val-d’Or district. Chromite: Chr; Hematite: Hem; Ilmenite: Ilm; Magnetite: Mag; Scheelite: Sch; Titanomagnetite: Ti-Mag; Tourmaline: Tur. ... 19
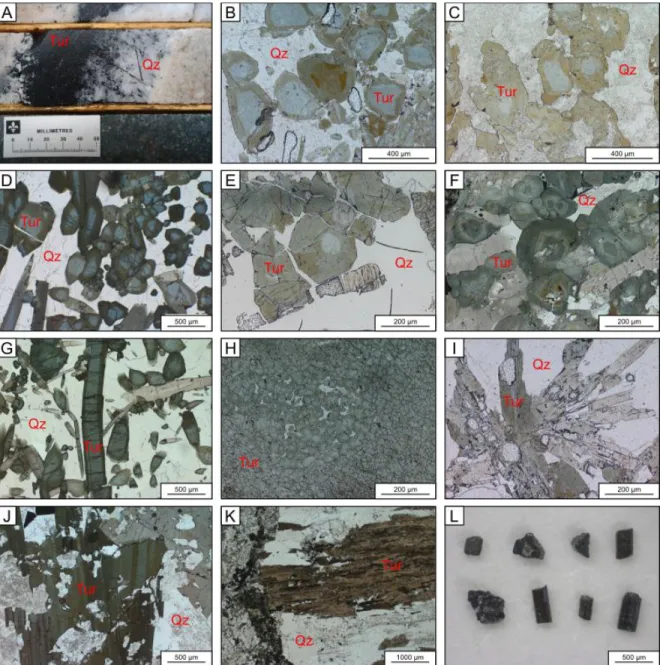
Figure 3: Photographs and microphotographs of tourmaline textures from quartz veins and till samples of the
Val-d’Or district. (A) Tourmalines occur as black euhedral needles in a quartz-tourmaline vein (Goldex). (B) Concentric and sector zoned tourmalines (Lac Herbin). (C) Concentric zoned tourmalines showing a light brown rim (Lapa). (D) Concentric zoned tourmalines showing a dark brown rim (Sigma 2). (E) Patchy zoned tourmalines (Goldex). (F) Oscillatory zoned tourmalines (New Béliveau). (G) Concentric zoned large tourmaline needles in quartz (Goldex). (H) Aggregate of small concentric zoned tourmaline needles (Goldex).
(I) Rosette of tourmaline needles (Lac Herbin). (J) Poikilitic tourmalines with quartz inclusions (Goldex). (K)
Aligned parallel tourmaline needles forming a fibrous mass (Bloc Sud). (L) Till tourmalines from glacial sediment sample 14-DG-002. Quartz: Qz; Tourmaline: Tur. ... 21
Figure 4: Photographs and microphotographs of scheelite textures from quartz veins of the Val-d’Or district. (A)
Scheelite occurs as a centimetric beige subhedral to euhedral crystal in a quartz-tourmaline vein (Beaufor).
(B) Aggregate of scheelite crystals associated with tourmalines (Beaufor). (C) Scheelites associated with
tourmalines (Sigma). Cathodoluminescence images of scheelite. (D) Homogeneous response (Sigma). (E) Homogeneous response (Triangle Zone). (F) Homogeneous response with an irregular brighter patch (Beaufor). Quartz: Qz; Scheelite: Sch; Tourmaline: Tur. ... 22
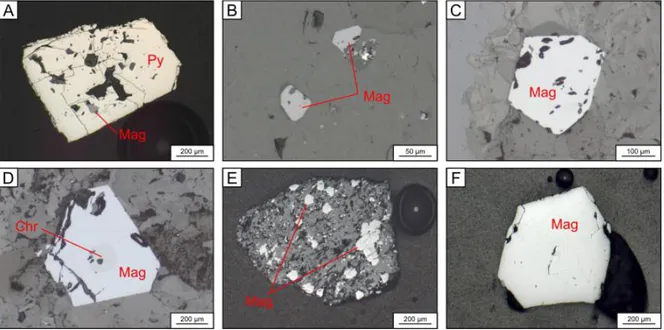
Figure 5: Photographs and microphotographs of magnetite textures from quartz veins, host rocks and till
samples of the Val-d’Or district. (A) Magnetite inclusions in pyrite from an EPD sample (Goldex). (B) Subhedral magnetites within a quartz-tourmaline vein (Goldex). (C) Euhedral magnetite in a diorite (Beaufor).
(D) Euhedral magnetite with a chromite core in a diorite (Beaufor). (E) Finely disseminated magnetite grains
in a mineral aggregate recovered in till. (F) Euhedral magnetite grain recovered in till. Chromite: Chr; Magnetite: Mag; Pyrite: Py. ... 23
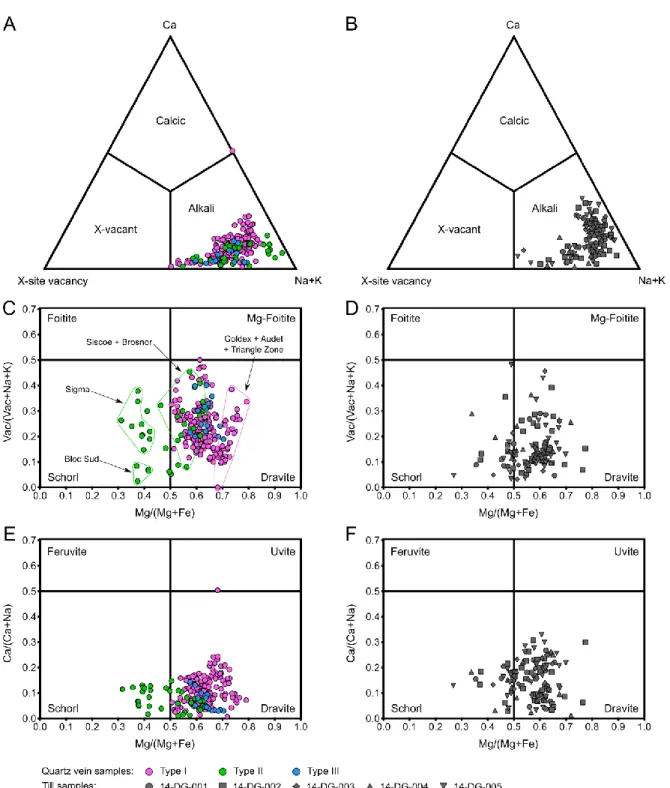
Figure 6: Classification of tourmalines from quartz veins (A, C & E) and till (B, D & F) of the Val-d’Or district. (A)
x
the same ternary diagram used in (A). (C) Vacant/(Vacant+Na+K) vs Mg/(Mg+Fe) diagram for tourmalines occurring in quartz veins. (D) Till tourmalines in the same diagram used in (C). (E) Ca/(Ca+Na) vs Mg/(Mg+Fe) diagram for tourmalines occurring in quartz veins. (F) Till tourmalines in the same diagram used in (E). Compositional diagrams after Henry et al. (2011). ... 25
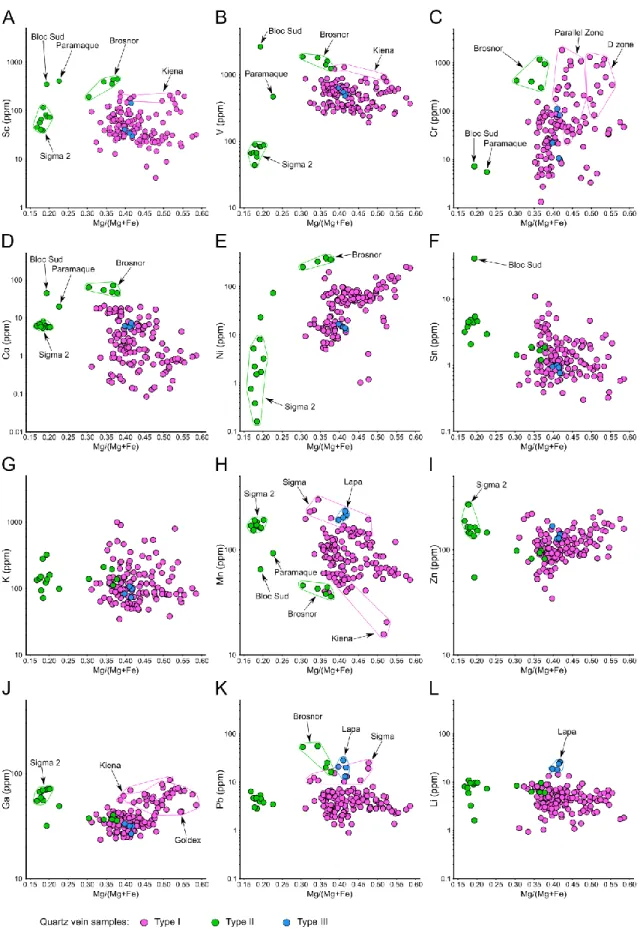
Figure 7: Tourmalines composition from quartz veins of the Val-d’Or district. Mg/(Mg+Fe) vs (A) Sc, (B) V, (C)
Cr, (D) Co, (E) Ni, (F) Sn, (G) K, (H) Mn, (I) Zn, (J) Ga, (K) Pb, (L) Li. ... 27
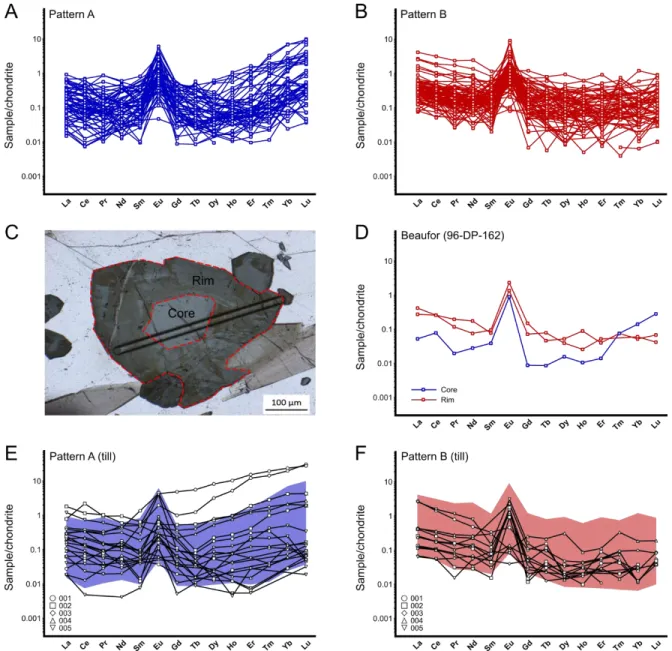
Figure 8: Chondrite normalized REE patterns in tourmalines from quartz veins of the Val-d’Or district. (A) Flat
patterns showing an enrichment in HREE with a positive Eu anomaly. (B) Flat patterns showing a slight enrichment of LREE with a positive Eu anomaly. (C) Microphotograph of a concentric zoned tourmaline grain (Beaufor). (D) The core and rim of the tourmaline grain shown in (C) are characterized by the REE patterns A and B, respectively. (E) Till tourmalines characterized by REE patterns A. (F) Till tourmalines characterized by REE patterns B. Chondrite composition from Taylor and McLennan (1985). ... 29
Figure 9: Representative EPMA chemical profiles of tourmalines from quartz veins of the Val-d’Or district. (A)
Concentric zoned tourmaline grain (Goldex) characterized by a blue core and a brown rim growth zonation.
(B) Sector zoned tourmaline grain (Lac Herbin) characterized by a brown core, where the o and r crystal
faces can be distinguished and a blue rim. The EPMA analyzed points (1, 2, 3, ...) were taken across the surface of the grain to characterize the compositional variations of the core and rim. ... 30
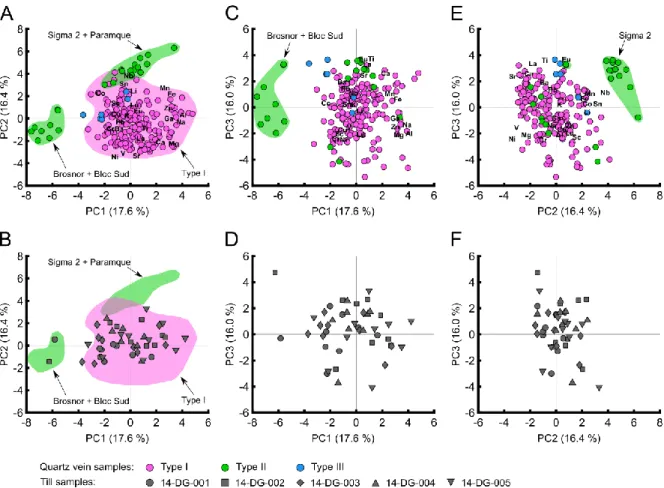
Figure 10: Principal component analysis results of EPMA data for tourmalines from orogenic gold deposits of
the Val-d’Or district. (A) PC1- PC2. (B) Till tourmalines projected on PC1-PC2. (C) PC1-PC3. (D) Till tourmalines projected on PC1-PC3. (E) PC2-PC3. (F) Till tourmalines projected on the PC2-PC3. ... 32
Figure 11 : Principal component analysis results of LA-ICP-MS data for tourmalines from orogenic gold deposits
of the Val-d’Or district. (A) PC1- PC2. (B) Till tourmalines projected on PC1-PC2. (C) PC1-PC3. (D) Till tourmalines projected on PC1-PC3. (E) PC2-PC3. (F) Till tourmalines projected on the PC2-PC3. ... 33
Figure 12: Principal component analysis results of tourmalines from various deposit types including orogenic
gold (this study; Hazarika et al., 2015; Hazarika et al., 2016; Jiang et al., 2002; Deksissa and Koeberl, 2002), vein-type Sn (Jiang et al., 2004), Cu-Mo porphyry (Iveson et al., 2016), and vein-type Pb-Zn-Cu±U (Yavuz et al., 2011). (A) PC1- PC2. (B) Till tourmalines projected on PC1-PC2. (C) PC1-PC3. (D) Till tourmalines projected on PC1-PC3. ... 36
Figure 13: Principal component analysis results of tourmalines from various deposit types including orogenic
gold deposits of the Val-d’Or district (this study), massive sulfide (Griffin et al., 1996; Slack et al., 1999), tourmalinite (Griffin et al., 1996), emerald (Galbraith et al., 2009), and from the pegmatitic and hydrothermal systems of the Schwarzwald area (Marks et al., 2013). (A) PC2. (B) Till tourmalines projected on PC1-PC2. (C) PC1-PC3. (D) Till tourmalines projected on PC1-PC3. ... 38
Figure 14: Scheelites composition (Sr, S, Pb, Mo, Mg, K, As, Nb, Mn, Cu, Zn, and V) from quartz veins of the
Val-d’Or district. ... 40
Figure 15: Chondrite normalized REE patterns in scheelites from quartz veins of the Val-d’Or district. (A)
xi
anomaly (Beaufor). (C) Bell-shaped patterns with a small negative Eu anomaly (Triangle Zone). (D) Till scheelites characterized by bell-shaped patterns with a small negative Eu anomaly. Chondrite composition from Taylor and McLennan (1985). ... 42
Figure 16: Principal component analysis results of LA-ICP-MS data for scheelites from orogenic gold deposits
of the Val-d’Or district. (A) PC1- PC2. (B) Till scheelites projected on PC1-PC2. (C) PC1-PC3. (D) Till scheelites projected on PC1-PC3. ... 43
Figure 17: Principal component analysis results of scheelites from various orogenic gold deposits (this study;
Sciuba et al., in prep.). (A) PC1- PC2. (B) Till scheelites projected on PC1-PC2. (C) PC1-PC3. (D) Till scheelites projected on PC1-PC3. (E) PC2-PC3. (F) Till scheelites projected on the PC2-PC3. ... 45
Figure 18: Principal component analysis results of scheelites from various orogenic gold (this study; Hazarika
et al., 2016; Sciuba et al., in prep.) and skarn deposits (Song et al., 2014). (A) PC1- PC2. (B) Till scheelites projected on PC1-PC2. (C) PC1-PC3. (D) Till scheelites projected on PC1-PC3. (E) PC2-PC3. (F) Till scheelites projected on the PC2-PC3. ... 47
Figure 19: Magnetite compositional diagrams. (A) Ni+Cr vs Si+Mg diagram for magnetites occurring in quartz
veins and intrusive host rocks. (B) Till magnetites in the same diagram used in (A). (C) Ca+Al+Mn vs Ti+V diagram for magnetites occurring in quartz veins and intrusive host rocks. (D) Till magnetites in the same diagram used in (C). Compositional diagrams after Dupuis and Beaudoin (2011). ... 49
xiii
Acknowledgments
This project would not have been possible without the support and experience of many individuals. First, my sincere gratitude is expressed to my research supervisor, Georges Beaudoin, for his geological expertise and guidance over the course of this project. I would also like to thank my co-supervisor, François Huot, for his valued support and advice throughout the entire project.
This research project was further made possible with the collaboration and financial support of Agnico Eagle Mines Limited (AEM), the Natural Sciences and Engineering Research Council of Canada (NSERC), and the Ministère de l’Énergie et des Ressources Naturelles (MERN) du Québec. I would like to thank Marc Legault, Patrice Simard, Jill Annette Marcotte, Tommy Leblanc, Richard Dubuc, Jocelyn Côté, and Émilie Boutroy of Agnico Eagle Mines Limited, Hervé Thiboutot of Integra Gold Corp, Daniel Gaudreault of Geologica, Jules Riopel and Mathieu Guay of Adventure Gold Inc., and all technicians for their geological insight and help in providing data for this research project. The expertise in Quaternary geology of Guillaume Allard of MERN was also greatly appreciated because sampling till in the Val-d’Or area was much harder than I expected.
I would also like to acknowledge the kind, cordial and helpful staffs of the Département de géologie et de génie géologique de l’Université Laval, especially Marc Choquette and André Ferland for their technical support with the EPMA and SEM, Edmond Rousseau for the preparation of thin sections, and Guylaine Gaumond, Julia Lebreux, and Marcel Langlois for their administrative assistance. I would also like to thank Dany Savard and Marko Prasek of Laboratoire des Matériaux Terrestres (LabMaTer) de l’Université du Québec à Chicoutimi for their technical support with the LA-ICP-MS. I would like to acknowledge Chantal Guillemette for her time and correction of this memoir.
I would like to thank the many friends and colleagues that I have made along the way, in particular Marjorie Sciuba, Clovis Cameron Auger, Nelly Manéglia, Sheida Makvandi, Alex Boulerice, Vincent Dubé-Bourgeois, Adina Bogatu, Frédéric Fleury, Roman Hanes, François-Xavier Masson, Arnaud Fontaine and the many more which I am sure that I have missed for their time, moral support and patience with my one-sided conversation about tourmaline.
Last but not least, I would like to thank my parents, Nicole and Daniel, for their ongoing patience, sacrifices, and continuous encouragement throughout the course of my
xiv
studies and sharing in my success as well as my frustrations. Finally, I would like to thank my brothers, Luc and Simon for their time and patience. This accomplishment would not have been possible without them. Thank you.
xv
Foreword
All chapters in this memoir, including the article in the second chapter, were entirely written by this author. The article entitled “Tourmaline, scheelite, and magnetite compositions from orogenic gold deposits and glacial sediments of the Val-d'Or district (Québec, Canada): application to mineral exploration” will be submitted for scientific publication in the Journal of Geochemical Exploration. The first author of this article, Donald Grzela, completed the field work, collected and prepared the samples, carried the analytical work, and interpreted the data. The co-authors of the article are Georges Beaudoin (Université Laval), the research supervisor of this master’s project, and François Huot (Université Laval), the co-supervisor of this master’s project.
1
Chapter 1 - Introduction
1.1 Generalities
Growing demand for commodities by the society has always pushed the human to find better ways to discover mineral resources. The development of the indicator mineral technique is part of the mineral industry effort to discover new resources. Since the 1980s, the application of the indicator mineral technique to geochemical exploration has grown significantly to search for concealed and undiscovered ore deposits in various terrains by tracing the dispersion of eroded mineral deposits in different surficial sediment media. The indicator mineral technique has been proven successful for diamond exploration (McClenaghan, 2005; McClenaghan and Kjarsgaard, 2007) and also has the potential to be applied for a range of commodities in various types of ore deposits (e.g., lode gold, magmatic Ni-Cu-PGE, Cu porphyry, VMS, MVT, skarn, and greisen).
Orogenic gold deposits represent 45% of gold deposits worldwide (≥1 Moz of gold; Goldfarb et al., 2005) and constitute 59% of the total gold production and reserves (Dubé and Gosselin, 2007) in Canada (e.g., Timmins, Kirkland Lake, and Val-d’Or), which makes orogenic gold deposits interesting targets for the mining industry. During the Pleistocene, over 95% of Canada’s surface was covered by glaciers, making indicator minerals particularly useful when exploring for gold in Canada’s glaciated terrains.
The interest of gold exploration in glaciated terrains of Canada makes the classic Au-bearing quartz-tourmaline-carbonate vein field of the Val-d’Or district an interesting location to study potential indicator minerals for orogenic gold deposits since the surface of the district was covered by ice during several periods of glaciation including the Nebraskan, Kansan, Illinoian, and Wisconsinan glaciations. Val-d’Or is located in the Abitibi-Témiscamingue region, 430 km north-west of the city of Montréal, Québec. The gold potential in the mining district of Val-d’Or has been known since the early 1910s, with the discovery of Au-bearing quartz veins in the Bourlamaque Batholith (Pilote et al., 2000). Since the 1930s, more than 45 Moz of gold were produced in the Cadillac, Malartic, and Val-d’Or districts, including 9 Moz produced at the Sigma-Lamaque deposit between 1935 and 2001 (Goldfarb et al., 2005; Dubé and Gosselin, 2007).
1.2 Research objectives
2
Exploration is to develop new exploration methods using physical and chemical characteristics of several indicator minerals (e.g., tourmaline, scheelite, rutile, arsenopyrite, galena, magnetite, and hematite) in order to discover new orogenic gold deposits. This master’s project on the chemical composition of indicator minerals from orogenic gold deposits and glacial sediments of the Val-d’Or district is conducted in close collaboration with two M.Sc. candidates working on indicator minerals from the Kittilä (Finland) and the Meliadine (Nunavut, Canada) orogenic gold deposits and one Ph.D. candidate working on indicator minerals from worldwide orogenic gold deposits.
This project aims at defining the chemical signature of tourmalines, scheelites, and magnetites from orogenic gold deposits located within the Val-d’Or district and comparing it with the chemical composition of indicator minerals recovered in nearby glacial sediments to determine their provenance. The specific objectives considered to achieve the primary goal of this project are: 1) identify the potential indicator minerals for orogenic gold deposits located within the Val-d’Or district, 2) determine which indicator minerals are recoverable in heavy mineral concentrates of glacial sediments, 3) determine the chemical composition of tourmalines, scheelites and magnetites from orogenic gold deposits and glacial sediments, and 4) interpret the chemical data to establish discriminant features and to determine the provenance of the indicator minerals recovered in glacial sediments.
1.3 Methodology
First, representative rock and core samples from orogenic gold deposits located across the Val-d’Or district and glacial sediments samples forming a 20-km long transect oriented northeast-southwest across the district were selected for this study. A detailed petrographic study was completed to identify the mineral assemblages, petrogenesis, and textures of the Au-bearing quartz-tourmaline-carbonate veins. The till indicator minerals were recovered from the Heavy Mineral Concentrates (HMC) using a binocular microscope and Energy-Dispersive X-ray Spectroscopy (EDS) from a Scanning Electron Microscope (SEM) to verify the chemistry of the selected grains. The major and trace element contents of tourmalines, scheelites, and magnetites from orogenic gold deposits and glacial sediments were determined using an Electron Probe Micro-Analyzer (EPMA) and Laser Ablation Inductively Coupled Plasma Mass Spectrometry (LA-ICP-MS). The chemical data was interpreted using binary, ternary, spider, and compositional diagrams and statistical analysis method such as Principal Component Analysis (PCA). The composition of tourmalines, scheelites, and magnetites recovered in glacial sediments was compared with
3
the chemistry of indicator minerals from orogenic gold deposits of the Val-d’Or district and other deposit types to determine their provenance.
1.4 Presentation of the article
The second chapter of this memoir consists of an article entitled “Tourmaline, scheelite, and magnetite compositions from orogenic gold deposits and glacial sediments of the Val-d'Or district (Québec, Canada): application to mineral exploration”. The article will be submitted for scientific publication in the Journal of Geochemical Exploration and has been written by Donald Grzela, who completed the field work, collected and prepared the samples, carried the analytical work, and interpreted the data. The co-authors of the article, Georges Beaudoin and François Huot, contributed to the project definition, field work, and data interpretation.
The article begins by briefly describing the regional geology, the geological characteristics of orogenic gold deposits and the Quaternary geology of the Val-d’Or district. A brief description of the sample selection, sample preparation, analytical methods and statistical methods used in the study follows. The petrographic characteristics of representative orogenic gold mineralization samples are then described, followed by the chemistry of tourmalines, scheelites, and magnetites in order to determine their chemical signature. The composition of till tourmalines, scheelites, and magnetites is then compared with the chemical signature of indicator minerals from various deposit types in compositional diagrams and in PCA to determine their provenance.
5
Chapter 2 - Tourmaline, scheelite, and magnetite compositions
from orogenic gold deposits and glacial sediments of the Val-d'Or
district (Québec, Canada): application to mineral exploration
2.1 Introduction
The indicator mineral technique has grown significantly since the 1980s and has been successfully used in mineral exploration to explore for many types of ore deposit. A broad set of indicator minerals is now used in exploration for many deposit types including diamond-bearing kimberlite, lode gold, magmatic Ni-Cu-PGE, Cu porphyry, VMS, MVT, W-Mo porphyry, skarn, and greisen (Averill, 2001; Heimann et al., 2005; McClenaghan, 2005; McClenaghan and Kjarsgaard, 2007; Averill, 2011; Kelley et al., 2011; McClenaghan and Cabri, 2011; Oviatt et al., 2013; Paulen et al., 2011; McClenaghan et al., 2014; Lehtonen et al., 2015).
McClenaghan (2005) defines indicator minerals as “mineral species that, when appearing as transported grains in clastic sediments, indicate the presence in bedrock of a specific type of mineralization, hydrothermal alteration or lithology”. An indicator mineral may be the commodity itself such as gold or a mineral associated with the mineralization, alteration or host rock. Their physical and chemical characteristics such as the capacity to resist weathering and/or mechanical transport, mid- to high-density, hardness, visual distinctiveness (e.g., color and florescence), and chemical stability in surficial environment allow them to survive and to be easily recovered in sample media such as soil, stream, alluvial, glacial, or aeolian sediments. Indicator minerals are particularly useful for mineral exploration in glaciated terrains where physical weathering is important. However, the technique has also been proven effective in tropical and arid terrains (McClenaghan, 2005). The indicator minerals technique differs from conventional chemical methods for soil, stream sediments and till because the mineral abundance, grain morphology, surface textures and mineral chemistry can be reported for each individual grain recovered from the Heavy Mineral Concentrates (HMC), which give useful information on transport distance and potential provenance. The advantages of using the indicator mineral technique for geochemical exploration include: 1) discovering halos or dispersive mineral trains much larger than the mineralized target including associated alteration, 2) targeting multiple types of deposit in a single exploration survey, 3) detecting only a few grains, derived from mineralization and/or alteration, in an area distal to the source where the HMC is diluted by
6
minerals derived from regional lithologies, and 4) defining distance from the source based on mineral dispersal trains (McClenaghan, 2005). The indicator mineral technique was successfully used to discover gold deposits such as the Golden Pond East and West at Casa Berardi, Québec (Sauerbrei et al., 1987), the Aquarius deposit in Timmins, Ontario (Gray, 1983) and the 17 Zone in Rainy River, Ontario (Averill, 2001).
Gold is a metal of high interest in the mineral industry. Orogenic gold deposits represent 45% of gold deposits worldwide containing more than 1 Moz of gold, which is more than intrusion-related deposits (28%), epithermal deposits (25%), and paleoplacers (3%; Goldfarb et al., 2005). In Canada, orogenic gold deposits constitute 59% of the total gold production and reserves (Dubé and Gosselin, 2007), which makes them important exploration targets for the mining industry. Over 95% of Canada’s surface was covered by glaciers during the Pleistocene, making the use of indicator minerals particularly important for exploration in Canada. Gold grains are the best indicator minerals for detecting the presence of gold mineralization, however, other minerals such as sulfides (e.g., pyrite, pyrrhotite, arsenopyrite, chalcopyrite, sphalerite, galena, pyrargyrite, proustite, and cinnabar), platinum-group minerals, tellurides, scheelite, cassiterite, and rutile may also be useful depending on the deposit types, bedrock geology, and weathering regime of the area (McClenaghan and Cabri, 2011). In orogenic gold deposits of the Val-d’Or district, tourmalines, scheelites, and magnetites occur as common or accessory minerals within the Au-bearing quartz-tourmaline-carbonate veins and they are concentrated in local glacial sediments. Their physical and chemical characteristics make them potential indicator minerals for orogenic gold deposits.
Tourmaline is a complex acentric bore-bearing cyclosilicate forming as a major or accessory mineral in various types of sedimentary, igneous, and metamorphic rocks and in hydrothermal and magmatic deposits (Slack, 1996; Slack and Trumbull, 2011; van Hinsberg et al., 2011a). Tourmaline forms over a significant range of pressures (<0.06 to >6 GPa) and temperatures (<150 to >950 °C) in various geological settings (Dutrow and Henry, 2011) and shows a distinctive chemical signature by incorporating a wide array of major, minor and trace elements (Henry et al., 2011). Minerals of the tourmaline supergroup share the general chemical formula: XY3Z6(T6O18)(BO3)3V3W with site occupancies as follow: X = Ca2+, Na+, K+, and vacancy; Y = Ti4+,Al3+, Fe3+, Cr3+, V3+, Mg2+, Fe2+, Mn2+, and Li+; Z = Al3+, Fe3+, Cr3+, V3+, Mg2+, and Fe2+; T = Si4+, Al3+, and B3+; B = B3+; V = O2- and OH-; and W = O2-, OH, F-, and Cl- (Hawthorne and Henry, 1999). The best known species of the tourmaline
7
supergroup include dravite (NaMg3Al6Si6O18(BO3)3OH4), schorl (NaFe3Al6Si6O18(BO3)3OH4), and elbaite (Na(Li,Al)3Al6Si6O18(BO3)3OH4; Dutrow et Henry, 2011; Henry et al., 2011). The composition of major, minor and trace elements in tourmaline is controlled by 1) fluid/rock interaction, 2) fluid composition, flux, mixing, and boiling, 3) composition of the host rock, 4) element partition coefficient between tourmaline, fluids and co-forming minerals, 5) temperature, 6) pressure, and 7) redox state (Griffin et al., 1996; Slack and Trumbull, 2011). Its complex and variable chemistry, coupled to a negligible intracrystalline element diffusivity, allow tourmaline to record and preserve the chemical signature of its host environment, making it an ideal indicator mineral (van Hinsberg et al., 2011b). Chemical stability and physical characteristics such as specific gravity (2.9-3.2), hardness (7.0-7.5) and lack of cleavage make tourmaline a robust mineral highly resistant to weathering and transport in clastic sediments (Hawthorne and Dirlam, 2011).
Scheelite is a calcium tungstate mineral occurring as a common or accessory mineral in various types of magmatic and hydrothermal ore deposits including pegmatite, greisen, Sn-W veins, porphyry, skarn, VMS, epithermal, and orogenic gold (Hsu and Galli, 1973; Kontak et al., 2015; Poulin, 2016). Scheelite crystallizes at pressures ranging between 0.02 and 0.15 GPa and temperatures between 200 and 500 °C (Wood and Samson, 2000). Low oxygen and sulfur fugacity conditions are necessary for scheelite crystallization (Brugger et al., 1998). Scheelite has the basic chemical formula CaWO4, and its crystal structure has two unique cation sites: an [8]-coordinated site, in which Ca2+ may be replaced by Sr2+, Pb2+, Fe2+, Mn2+, Ba2+, and REE3+, and a [4]-coordinated site, in which Mo6+, As5+, and Nb5+ substitute for W6+ (Ghaderi et al., 1999; Raimbault et al., 1993). Scheelite forms a complete solid solution series with powellite (CaMoO4). Substitution of trivalent REE for divalent Ca occurs by three coupled substitutions to balance the charge difference: 1) 2Ca2+ = REE3+ + Na+, 2) Ca2+ + W6+ = REE3+ + Nb5+, and 3) 3Ca2+ = 2REE3+ + Ca-site vacancy (Ghaderi et al., 1999). The composition of major, minor and trace elements in scheelite is controlled by similar factors than tourmaline with the addition of oxygen and sulfur fugacity (Hsu and Galli, 1973; Robert and Brown, 1986b). Scheelite can resist to weathering and can be concentrated in clastic sediments due to chemical stability in surficial environment and physical properties such as specific gravity (5.9-6.1) and hardness (4.5-5.0). However, scheelite is brittle and survives only moderate distances during glacial or fluvial transport (McClenaghan et al., 2015). Scheelite is characterized by a strong bluish-white color fluorescence in short ultraviolet radiation (Klein and Dutrow, 2008), making it one of the most common indicator minerals used to explore for W, Sn, and Au mineralizations (Averill, 2001;
8
McClenaghan, 2005) due to easy visual identification.
Magnetite is an iron oxide mineral commonly found in various types of sedimentary, igneous, and metamorphic rocks (Klein and Dutrow, 2008) and occurs as a major or an accessory mineral in various deposit types including BIF, IOCG, Kiruna-type apatite-magnetite, Fe-Ti, porphyry, skarn, Ni-Cu-PGE, VMS, Opemiska-type Cu veins and clastic-dominated Pb-Zn deposits (Heimann et al., 2005; Leach et al., 2010; Dupuis and Beaudoin, 2011; Nadoll et al., 2014). Magnetite belongs to the spinel group and is characterized by the basic chemical formula XY2O4, where divalent cations such as Mg, Ni, Mn, Co, and Zn can substitute for Fe2+ in X-site and trivalent cations such as Al, Cr, V, Mn, and Ga replace Fe3+ in Y-site (Wechsler et al., 1984; Biagioni and Pasero, 2014). A tetravalent cation (e.g., Ti4+) coupled with a divalent cation can be incorporated in the X- and Y-sites of the magnetite structure. Minerals from the magnetite series include magnesioferrite (MgFe2O4), franklinite (ZnFe2O4), jacobsite (MnFe2O4), and trevorite (NiFe2O4). The composition of major, minor and trace elements in magnetite is controlled by 1) magma composition, 2) temperature, 3) pressure, 4) cooling rate, 5) oxygen and sulfur fugacity, 6) silica and sulfide activity, 7) ionic radius and overall charge balance of substituting elements, and 8) composition of co-forming minerals and partition coefficients of various substituting elements between competing mineral phases (Buddington and Lindsley, 1964; Fleet, 1981; Wechsler et al., 1984; Whalen and Chappell, 1988; Frost, 1991; Frost and Lindsley, 1991; Ghiorso and Sack, 1991; Haggerty, 1991; Cornell and Schwertmann, 2003; Mollo et al., 2013; Biagioni and Pasero, 2014; Nadoll et al., 2014). Chemical stability in surficial environment and physical properties such as specific gravity (5.1-5.2) and hardness (5.0-6.0) allow magnetite to resist weathering and to concentrate in clastic sediments. Magnetite easily separated from the HMC because it has the highest magnetic susceptibility among all naturally-occurring minerals.
The Val-d’Or district was chosen as a case study to investigate the chemical composition of tourmalines, scheelites and magnetites from orogenic gold deposits because 1) the Val-d’Or district is a classic example of orogenic gold deposits where outcropping mineralized zones were eroded by glaciers, 2) tourmalines, scheelites and magnetites occur as common or accessory minerals within the Au-bearing quartz veins or the host rocks, and 3) tourmalines, scheelites and magnetites are concentrated within the local glacial sediments. Given that tourmaline, scheelite, and magnetite occur in various rock types or mineral deposits, characterizing the chemical signature (major, minor, and trace elements) of those minerals in orogenic gold deposits is necessary in order to identify the provenance
9
of tourmalines, scheelites, and magnetites recovered in glacial sediments sampled in the Val-d’Or district. Although, the major element composition of tourmalines from various deposit and rock types has been the focus of several studies, limited studies have been carried on trace elements in tourmaline (e.g., Slack and Coad, 1989; Griffin et al., 1996; Slack et al., 1999; Yavuz, 1999; Jiang et al., 2002, Jiang et al., 2004; Galbraith et al., 2009; Roberts et al., 2006; Mark et al, 2013; Chapman et al., 2015; Hazarika et al., 2015, 2016). Most studies on scheelite focus on understanding the partitioning and distribution of its REE, with limited studies carried on its trace elements (e.g., Cottrant, 1981; Brugger et al., 2000a,b; Roberts et al., 2006; Dostal et al., 2009; Song et al., 2014; Hazarika et al., 2016; Poulin, 2016). However, compared to tourmaline and scheelite, trace elements in magnetite have been the subject of several studies for various ore deposits (e.g., Dupuis et Beaudoin, 2009; Dare et al., 2012, 2014; Boutroy et al., 2014; Nadoll et al., 2011, 2012, 2014, 2015; Makvandi et al., 2016a, b). Here, we used the major, minor and trace elements composition of tourmalines, scheelites, and magnetites from orogenic gold deposits to identify discriminant criteria using binary and ternary diagrams and Principal Component Analysis (PCA). We then compared the composition of tourmalines, scheelites, and magnetites recovered in glacial sediments with the chemistry of indicator minerals from the Val-d’Or Au-bearing quartz veins to determine their provenance and to demonstrate the use of tourmaline, scheelite, and magnetite as indicator minerals for gold exploration in a glaciated terrain.
2.2 Geological setting
2.2.1 Regional geology
The Val-d’Or district is located along the eastern segment of the Southern Volcanic Zone (Chown et al., 1992; Daigneault et al., 2002; Ludden et al., 1986) at the boundary between the Abitibi and Pontiac subprovinces of the Superior Province (Fig. 1; Card, 1990). The volcano-sedimentary Abitibi and the metasedimentary Pontiac subprovinces are separated by the Larder Lake-Cadillac Fault Zone (LLCFZ), a crustal-scale shear zone, dipping steeply to the north and extending on more than 200 km along strike (Robert et al., 1995).
The Val-d’Or district consists of a complex volcano-sedimentary sequence of ultramafic to felsic volcanic rocks erupted between 2714 ± 2 Ma and 2702 ± 2 Ma (Pilote et al., 2000; Scott et al., 2002), known as the Malartic and Louvicourt groups. The volcanic rocks are overlain by minor sedimentary rock assemblages, which includes the Lac Caste
10
Formation (<2691 ± 8 Ma; Feng et Kerrich, 1991), the Cadillac Group (<2688 Ma; Davis, 1991), and the Kewagama Formation (<2687 Ma; Davis, 1991). The Malartic Group is composed of the La Motte-Vassan, Dubuisson, and Jacola formations that consist of komatiitic and tholeiitic basaltic flows and sills interpreted to have formed an Archean oceanic floor controlled by extensional mantle plume tectonics (Desrochers et al., 1993; Scott et al., 2002). The Val-d’Or and Héva formations of the Louvicourt Group consist of mafic to felsic volcaniclastic and volcanic rocks formed in a volcanic arc (Daigneault et al., 2002; Scott et al., 2002). The Cadillac Group consists of grauwackes, pelitic schists, polymitic conglomerates, and iron formations (Imreh, 1984) interpreted as a syn-orogenic flysch-type assemblage (Daigneault et al., 2002; Mueller et al., 1996). The Lac Caste and Kewagama formations represent an inter-arc turbidite sequence, which is part of the flysch basin system linking the Northern Volcanic Zone with the Southern Volcanic Zone (Daigneault et al., 2002). Syn-volcanic to post-tectonic mafic to felsic bodies intruded the volcano-sedimentary sequence of the Val-d’Or district during three main events: synvolcanic stocks and batholiths (2706 ± 1 Ma to 2700 ± 1 Ma; e.g., Bourlamaque batholith; Wong et al., 1991; Pilote et al., 2000), syn- to late-tectonic intrusions (2694 ± 2 Ma to 2680 ± 2 Ma; Jamielita et al., 1990; Morasse et al., 1993; Wong et al., 1991; Pilote et al., 2000) and undeformed late- to post-tectonic stocks and dikes (2675 Ma to 2611 Ma; Feng et Kerrich, 1991; Feng et al., 1992). South of the LLCFZ, the Pontiac Group (<2685 ± 3 Ma; Davis, 2002) consists of grauwackes and mudstones intercalated with ultramafic volcanic rocks (Dimroth et al., 1982; Ludden et al., 1986; Pilote et al., 2000).
All rocks in the Val-d’Or district, with the exception of late dikes, have been metamorphosed up to the greenschist facies between 2693 ± 11 Ma (Hanes et al., 1992) and 2677 ± 6 Ma (Feng et al., 1992). Metamorphism gradually increases southward from upper greenschist facies along the LLCFZ to the amphibolite facies in the Pontiac Subprovince. Three major phases of deformation have been recognized in the Val-d’Or district. During the first phase of the deformation (D1), several mafic to ultramafic tectonostratigraphic terranes were accreted to form the Malartic Composite Block. Desrochers and Hubert (1996) suggested that the calc-alkaline felsic volcanic and volcanoclastic rocks of the Val-d’Or Formation overly unconformably the Malartic Composite Block. Scott et al. (2002), however, described the Val-d’Or Formation in a concordant contact with the underlying Jacola Formation, indicating a change from tholeiitic mafic volcaniclastic to calc-alkaline flows and volcanoclastics rocks of intermediate to felsic composition. The tholeiitic mafic to felsic flows and volcanoclastics of the Héva Formation
11
form a stratigraphic continuum with the underlying Val-d’Or Formation. A second phase of deformation (D2) produced the dominant subvertical E-W foliation, faults, and shear zones hosting most of the Au-bearing quartz veins as a result of north-south compression event (Dimroth et al., 1983a, b; Robert, 1989; Desrochers and Hubert, 1996). Deformation ended with dextral transcurrent movement (D3) that reactivate the LLCFZ and several second-order shear zones (Robert et al., 1995; Neumayr et al., 2000; Daigneault et al., 2002).
Figure 1:Simplified regional geological map of the Val-d’Or orogenic gold vein field showing the distribution of quartz-carbonate and quartz-tourmaline-carbonate veins and till samples used in this study and the ice flow directions in the study area. Numbers in figure referring to gold deposits and prospects are as follow: 1: Lapa; 2: Kiena; 3: Siscoe; 4: Goldex; 5: Vein No. 5; 6: Sigma; 7: Lamaque Sud; 8: Audet; 9: Nord-Ouest; 10: Orenada; 11: Lac Herbin; 12: Paramaque; 13: Snowbank; 14: Canmet (nord); 15: O’Connell; 16: Beaufor; 17: Lucien Béliveau/New Béliveau; 18: Brosnor; 19: Buffadison; 20: Sigma 2; 21: Bloc Sud; 22: Lac Simon. See Appendix I for a summary of relevant geological information for each deposit. Geological map modified from Beaudoin and Pitre (2005) and ice flow directions after Paradis (2007).
2.2.2 Gold mineralization
Two generations of shear zone-related gold quartz veins, based on crosscutting relationships, are recognized in the Val-d’Or district. Early quartz-carbonate veins (≥2686 Ma) are mainly associated with second-order shear zones and are cut by 2694 to 2680 Ma syntectonic dikes of tonalitic to dioritic composition (Couture et al., 1994; Robert et
12
al., 1995). Early quartz-carbonate veins (e.g., Norlartic, Siscoe, and Callahan) are commonly folded and boudinaged within sub-vertical shear zones as a result of the D2 deformation (Sauvé et al., 1993; Robert et al., 1995). Younger (≤2684 Ma) quartz-tourmaline-carbonate veins (e.g., Sigma, Lamaque, and Beaufor) are developed in the late stages of the D2 shortening and formed either subvertical fault-fill or subhorizontal extensional veins. They are typically associated to third-order shear zones and cut all intrusive rocks. The plutonic and volcanic rocks of the Val-d’Or district host most of the gold-bearing quartz veins, although some veins also occur within the metasedimentary rocks of the Pontiac Subprovince. Gold deposits rarely occur in first-order shear zones such as the LLCFZ, with the exception of a few deposits and prospects (e.g., Lapa and Orenada; Simard et al. 2013; Desrochers and Robert, 2000; Neumayr et al., 2000). Gold mineralization within the LLCFZ occurs as disseminated gold associated to arsenopyrite. Other gold deposits, such as Kiena (Morasse et al., 1995) and Akasaba (Sauvé et al., 1993) are interpreted as porphyry-gold and skarn mineralizations, respectively.
2.2.3 Quaternary geology
During the last 2 Ma, several glaciations such as the Nebraskan, Kansan, Illinoian, and Wisconsinan have shaped the surface of the Abitibi Subprovince. The most distinct glacial footprint on the current landscape results from the complex sequence of ice flows during the Wisconsinan glaciation (Veillette and McClenaghan, 1996; McClenaghan, 2001). However, evidences of previous glaciations are also recorded on the surface of bedrock. The initial ice flow (flow I) of the Wisconsinan glaciation was oriented toward the northwest during the early expansion of the Laurentide Ice Sheet (Veillette, 1995). The ice flow orientation shifted counterclockwise toward the west (flow II), the southwest (flow III), and the south-southwest (flow IV) during the main phase of the Laurentide Ice Sheet. During deglaciation, the glacier was divided in two lobes forming an opening, which resulted in the deposition of Lake McConnell and Harricana interlobate moraines. From either side of the opening in the ice sheet, ice flows (flow V) were converging (Veillette and McClenaghan, 1996; Paradis, 2007) heading toward the southeast on the west side of the opening and southwest on the east side. The Cochrane surge (flow VI) is recorded by the youngest striations, oriented toward the south, southeast and east-southeast, extending from the James Bay region to the area where glacial Lake Ojibway formed. The Matheson till deposited during the Wisconsinan glaciation is overlain by thick glaciolacustrine silt and clay deposits (5 to 30 m) accumulated in the glacial Lake Ojibway, Cochrane till, and extensive
13
peatland (Veillette, 1995; McClenaghan, 2001). The till sampling area, east of Val-d’Or, is only affected by ice flow V oriented toward the south and southwest (Fig. 1).
2.3 Methodology
2.3.1 Sample selection 2.3.1.1 Quartz veins
Six hundred thirty-six mineralized rock samples (Appendix II) from 54 gold deposits and prospects from the Val-d’Or district were available for this study. Samples were collected from subvertical veins in shear zones, subhorizontal extensional veins, and various tectonic and hydraulic breccias hosted in volcanic, plutonic and sedimentary rocks. The selection offers a representative distribution of the gold mineralization across the district and includes samples collected by the author during the summer 2014 and from three M.Sc. theses (Pitre, 2000; Roussy, 2003; Rezeau, 2012). One hundred fifty-five representative polished thin sections (Appendix II) were available for 34 gold deposits and prospects. Chemical analyses were carried on indicator minerals from 22 gold deposits and prospects (Fig. 1; Appendix I). Tourmalines occur in quartz veins hosted in various lithologies including: 1) felsic to intermediate calc-alkaline intrusions, 2) mafic plutonic and volcanic rocks of tholeiitic affinity, and 3) at the contact between mafic to ultramafic volcanic and metasedimentary rocks within the LLCFZ, which are designated as types I, II, and III tourmalines, respectively. In the Val-d’Or district, Type I tourmalines are the most common and they occur in several deposits across the district including the Beaufor, Canmet (nord), Lac Herbin, Nord-Ouest, and Snowbank deposits hosted within the Bourlamaque batholith, a calc-alkaline quartz diorite intrusion. Type I tourmalines are also present at the O’Connell deposit hosted in the Connell Pluton, an apophysis of the Bourlamaque batholith (Sauvé et al., 1993) and at the Buffadison deposit hosted in the Bevcon Pluton, a calc-alkaline intrusion of tonalitic to dioritic composition. Type I tourmalines also occur at the Audet, Goldex, Lucien Béliveau/New Béliveau, Lamaque Sud, Kiena and Sigma deposits, which are hosted in various small calc-alkaline intrusions of dioritic composition intruded in volcanic rocks. Type II tourmalines occur at the Sigma 2 and Bloc Sud deposits hosted in a differentiated tholeiitic intrusion of tonalitic to gabbroic composition (Vicour sill) and at the Paramaque deposit hosted in a tholeiitic intrusion of gabbroic composition (Annamaque sill), which are both located at the contact between the Val-d’Or and Héva formations. Type II tourmalines also occur at the Siscoe deposit hosted in the Siscoe stock, a homogeneous quartz gabbro intrusion of
14
tholeiitic affinity at the contact with the Dubuisson Formation and at the Brosnor deposit hosted in tholeiitic basalts of the Jacola Formation. Type III tourmalines occur at the Lapa and Oreneda deposits, both located within the LLCFZ at the contact between volcanic rocks of tholeiitic and calc-alkaline affinities (Piché Group) and metasedimentary rocks.
Scheelites were sampled at the Beaufor and Sigma deposits and at the Triangle Zone of the Lamaque Sud gold project. Scheelites from the Sigma and Beaufor deposits occur in quartz veins hosted in a dioritic intrusion of calc-alkaline affinity, whereas scheelites from the Triangle Zone occur in a breccia hosted in a calc-alkaline intrusion of dioritic composition.
Magnetites are rare in quartz veins of the Val-d’Or district. Hydrothermal magnetites occur within the quartz veins of the Goldex, Sigma, and Louvicourt deposits, whereas hydrothermal hematites were found in the Lac Herbin and at the Vein No. 5 deposits. Magmatic magnetites occur in the calc-alkaline dioritic host rocks of the Beaufor deposit and in the tholeiitic gabbroic host rocks of the Bloc Sud deposit.
2.3.1.2 Glacial sediments
Glacial sediment samples (Appendix III) were collected for the purposes of determining which indicator minerals are recoverable from the HMC and comparing the chemical signature of the recovered indicator minerals with those associated to gold mineralization of the Val-d’Or district. Five glacial sediment samples of 9 to 13 kg were collected, east of the city of Val-d’Or, along a 20-km long transect oriented northeast-southwest, following the ice flow V (Fig. 1). Each till sample was collected from the Matheson basal till in the C horizon. The northernmost sample (14-DG-001) is located up-ice, north of the Val-d’Or district. Samples 14-DG-002, 14-DG-005, and 14-DG-004 are located along the transect within the Val-d’Or district. The southernmost sample (14-DG-003) is located down-ice, 4 km south of the LLCFZ, within the Pontiac Subprovince.
2.3.2 Sample preparation
2.3.2.1 Heavy mineral concentrates
Representative mineralized rock samples (n=11; Appendix IV) were disaggregated using a CNT-MC Inc.’s Spark 2 Electric-Pulse Disaggregator (EPD) to liberate minerals. Heavy mineral concentrates (HMC) of mineralized rocks and glacial sediments were prepared by Overburden Drilling Management Limited, in Ottawa, following the method described on the processing flow sheet (Appendix V). Glacial sediments and disaggregated
15
mineralized rock samples were sieved (wet) at 2.0 mm. The <2.0 mm material was passed over a shaking table to pre-concentrate heavy minerals. Visible gold grains were counted and the visible gold assay was calculated. The <2.0 mm material was sieved (dry) to 0.25 mm. The heavy mineral pre-concentrate was separated using a liquid with a specific gravity of 3.0 to recover indicator minerals. The ferromagnetic heavy minerals were separated from the HMC using a magnet and sieved (dry) to produced four fractions (<0.25 mm, 0.25 to 0.5 mm, 0.5 to 1.0 mm and 1.0 to 2.0 mm). The non-ferromagnetic fraction of heavy minerals was sieve (dry) to produced four fractions with the same grain-size intervals as the ferromagnetic fraction. The 0.25 to 0.5 mm, 0.5 to 1.0 mm and 1.0 to 2.0 mm ferromagnetic and non-ferromagnetic fractions were randomly split in sub-samples at Université Laval, Québec. Following the procedure described in Sappin et al. (2014), grains (~100 grains) from the 0.5 to 2.0 mm grain-size ferromagnetic fraction of each sample were mounted in epoxy sections and polished for chemical analysis by EPMA. Tourmaline grains were hand picked from the 0.25 to 0.5 mm grain-size fraction under a binocular microscope, whereas scheelite grains were identified using a UV light. Tourmaline and scheelite grains were mounted in epoxy sections and polished for chemical analyses by EPMA and LA-ICP-MS. The <0.25 mm grain-size fraction was not used in this study because the grains are too small to complete chemical analyses.
2.3.3 Analytical methods
2.3.3.1 Electron Probe Micro-Analysis (EPMA)
Major and minor elements in tourmaline, scheelite, and magnetite were analyzed with a CAMECA SX-100 electron probe equipped with five WDS spectrometers at the Université Laval, Québec. Major elements were analyzed in tourmaline (Fe, Cr, Ca, Na, Mg, Si, and Al) and scheelite (Ca and W) using a 10 µm beam, 15 kV voltage and 20 nA current, counting 10 s on both sides for background and 20 s at peak. Minor elements were analyzed in tourmaline (Mn, Ti, Zn, Cu, Ni, Co, V, Sc, K, Cl, Sr, and F) and scheelite (Fe, Sr, Mo, Na, and Y), using a 10 µm beam, 15-25 kV voltage and 100 nA current, counting 15-30 s on both sides for background and 40-120 s at peak. Tourmaline was normalized to 29 oxygens and the structural formula was calculated using an Excel spreadsheet from Henry et al. (2011), assuming stoichiometric value for B (3 apfu) and OH (4 apfu; except if F and/or Cl where measured by EPMA). Magnetite was analyzed for minor elements (V, Cr, Zn, Cu, Ni, Mn, K, Sn, Ca, Ti, Al, Si and Mg), using a 10 µm beam, 15 Kv voltage, and 100 nA current, counting 15-20 s on both sides for background and 40-80 s at peak, which is similar to
16
analytical conditions described in Dupuis and Beaudoin (2011), Boutroy et al. (2014), and Makvandi et al. (2016a). The calibration of the instrument was achieved using a range of natural and synthetic standards. The range of detection limits for each element is reported in Appendix VI.
2.3.3.2 Laser Ablation-Inductively Coupled Plasma-Mass Spectrometry (LA-ICP-MS)
Trace elements in tourmaline and scheelite were analyzed with a RESOlution M-50 Excimer 193 nm laser coupled to an Agilent 7700x ICP-MS at the Laboratoire des Matériaux Terrestres (LabMaTer) of Université du Québec à Chicoutimi. Tourmaline was analyzed by ablating linear trenches in order to determine the concentration in 7Li, 9Be, 11B, 23Na, 25Mg, 27Al, 39K, 43Ca, 45Sc, 47Ti, 51V, 53Cr, 55Mn, 57Fe, 59Co, 60Ni, 65Cu, 66Zn, 71Ga, 85Rb, 86Sr, 89Y, 92Zr, 93Nb, 95Mo, 118Sn, 133Cs, 137Ba, 139La, 140Ce, 141Pr, 146Nd, 152Sm, 153Eu, 155Gd, 159Tb, 163Dy, 165Ho, 166Er, 169Tm, 172Yb, 175Lu, 178Hf, 181Ta, 207Pb, 232Th, and 238U in the core and rim of the grains. LA-ICP-MS analysis used a beam size of 33-44 µm, a laser frequency of 10-15 Hz, and a speed stage of 5 µm/s. Calibration was completed using NIST SRM 610, GSD and GSE as external standards, with Si (determined by EPMA) as an internal standard. Reference materials NIST SRM 612, GSD and GSE were used to monitor the quality of the analyses. Scheelite was analyzed by ablating linear trenches in order to determine the concentration in 7Li, 11B, 23Na, 24Mg, 29Si, 3S 39K, 43Ca, 47Ti, 51V, 53Cr, 55Mn, 57Fe, 59Co, 63Cu, 66Zn, 75As, 86Sr, 89Y, 92Zr, 93Nb, 95Mo, 107Ag, 118Sn, 137Ba, 139La, 140Ce, 141Pr, 146Nd, 147Sm, 153Eu, 157Gd, 159Tb, 163Dy, 165Ho, 166Er, 169Tm, 172Yb, 175Lu, 181Ta, 182W 208Pb, 232Th, and 238U. LA-ICP-MS analysis used a beam size of 44 µm, a laser frequency of 10-15 Hz, and a speed stage of 5-20 µm/s. Calibration was completed using NIST SRM 610, GSD and GSE as external standards, with Ca (determined by EPMA) as an internal standard. Reference materials NIST SRM 612, GSD and GSE were used to monitor the quality of the analyses. Data reduction was completed using the Iolite software. The range of detection limits for each element is reported in Appendix VII.
2.3.3.3 Cathodoluminescence
Cathodoluminescence imaging of scheelite was conducted using a CAMECA SX-100 electron probe equipped with a CAMECA cathodoluminoscope at the Université Laval, Québec. Cathodoluminescence images were acquired using a 15 kV voltage and 20 nA current and was recorded using grey-scale images. Cathodoluminescence results from the emission of photon of characteristic wavelength of the electromagnetic spectrum (ultraviolet, visible and infrared) from a material exposed to high-energy electron bombardment (Götze,
17 2012; Götze et al., 2001).
2.3.4 Statistical methods
2.3.4.1 Censored geochemical data
In this study, EPMA and LA-ICP-MS datasets contain values below detection limits for one or several elements. To overcome the problem of censored distribution, different methods have been proposed to impute replacement values for the purpose of statistical analysis (Grunsky, 2010). In this study, the robComposition package implemented in the software R (Grunsky et al., 2013; Makvandi et al., 2016a) has been used to impute replacement values using the imputation of K-nearest neighbors (impKNNa) function using the Aitchison distance. Imputed values are based on the median of corresponding data of the K-nearest un-censored neighbors where K is ≥1. Data with more than 40% censored value can not be statistically investigated using this method (Hron et al., 2010).
2.3.4.2 Closure of geochemical data
Three different types of log-ratio transformation have been proposed by Aitchison (1986): additive log-ratio, isometric log-ratio, and centered log-ratio to eliminate the effect of closure caused by concentration variations. In additive log-ratio, one of the elements is used as a divider, since the transformation is asymmetric and the value is dependant of the denominator, the additive log-ratio is not recommended for compositional data (Egozcue et al., 2003). Isometric-log ratio is symmetric with orthonormal basis and adequate for compositional data using PCA, however, it is difficult to select the orthonormal basis of reference (Egozcue et al., 2003). Centered-log ratio transformation is symmetric with an orthonormal basis and recommended for multivariate statistical techniques such as PCA (Egozcue et al., 2003). In this study, the data is transformed using centered-log ratio, in which the variable is divided by the geometric mean of the variable concentration.
2.3.4.3 Principal component analysis (PCA)
The PCA was conducted on both EPMA and LA-ICP-MS datasets transformed for censored values and closure, using a script (Makvandi et al., 2016a) for the software MATLAB, to describe the variance within the dataset. The PCA projects a high dimensional multivariate dataset onto a lower dimensional latent variable subspace. Samples and elements having similar chemical features plot together on the scatter plots. Grouped elements are positively correlated, while elements in opposite quadrants have a negative correlation. The largest variance is recorded by the first principal component (PC1), while
18
the second principal component (PC2) records the second largest variance orthogonal to the first, and so on. In this study, PCA were used to discriminate indicator minerals from the mineralized samples based on their chemical composition. The chemistry of till indicator minerals is projected on PC1-PC2, PC1-PC3, and PC2-PC3 defined by indicator minerals from gold mineralization samples to infer their provenance.
2.4 Results
2.4.1 Gold grains count in till
Gold grains were recovered in all glacial sediment samples with the largest gold grain reaching a size of 0.25 mm in length. The number of gold grains normalized to 10 kg samples increases from 9 in the up-ice sample (14-DG-001) to 61 in the northernmost sample (14-DG-002) within the Val-d’Or district (Fig. 2A). Samples 14-DG-005, 14-DG-004, and 14-DG-003 contain, respectively, 9, 40, and 4 gold grains (Fig. 2A), indicating a diminution of gold grains in till samples located down-ice of sample 14-DG-002. Gold grains recovered in samples 14-DG-002 and 14-DG-004 within the district show pristine, modified, and reshaped forms, whereas samples 14-DG-001, 14-DG-005, and 14-DG-003 show reshaped grains only. The presence of pristine grains in sample DG-002 (n=16) and 14-DG-004 (n=10) suggests a proximity to gold deposits. However, the pristine form of a gold grain recovered in till may result from the disaggregation of a polymineralic grain containing gold, which retains the pristine form of a gold grain on a longer transport distance and makes the argument of proximity questionable. Till sample 14-DG-005 was collected just south of gold deposits and contains only reshaped gold grains.
19
Figure 2: Proportion of indicator minerals recovered from till samples relative to distance for (A) gold grains
recovered in till normalized to 10 kg samples, (B) tourmaline and scheelite grains recovered in the HMC fraction 0.25 to 0.5 mm normalized to 10 kg samples, and (C) magnetite, hematite, titanomagnetite, ilmenite, and chromite grains recovered from the ferromagnetic fraction 0.5 to 2.0 mm. Samples 001 (-15 km); 14-DG-002 (-12 km); 14-DG-005 (-6 km); 14-DG-004 (-2 km); Larder Lake-Cadillac Fault Zone (0 km); 14-DG-003 (4 km). The gray zone represents the limits of the Val-d’Or district. Chromite: Chr; Hematite: Hem; Ilmenite: Ilm; Magnetite: Mag; Scheelite: Sch; Titanomagnetite: Ti-Mag; Tourmaline: Tur.
20
2.4.2 Petrography
2.4.2.1 Petrography of tourmalines from quartz veins and till samples
Tourmalines are a common mineral in subvertical veins in shear zones and in subhorizontal veins in extensional fractures between shear zones of the Val-d’Or district. In fault-fill veins, tourmalines typically form parallel ribbons defined as a “slip surface” during shearing, whereas, in extensional veins, tourmalines are distributed close to the walls of the veins where they typically form rosettes of needles (Robert and Brown, 1986b). The average volume proportion of tourmalines in Au-bearing quartz veins of the Val-d’Or district ranges between 10 and 15%, with some veins locally reaching up to 90%. Tourmalines are rare at the Lapa and Kiena deposits. In macroscopic observation, tourmalines are black (Fig. 3A) and are characterized by a translucent brown colour when light passes through the grain. In thin section, tourmalines typically display zonations characterized by a blue core and a brown rim (Fig. 3B), which likely reflects compositional variations during growth. Lapa and Orenada tourmalines are characterized by a lighter brown rim (Fig. 3C), whereas Sigma 2 tourmalines show a darker brown rim (Fig. 3D), which differentiate them from most tourmalines of the Val-d’Or district. The color intensity of the rim likely reflects compositional variations. Tourmalines also show complex sector zoning (Fig. 3B), irregular patchy zoning (Fig. 3E), and more rarely oscillatory zoning (Fig. 3F). Tourmalines are typically characterized by euhedral, fine- to coarse-grained acicular crystals, rarely exceeding 0.5 mm in diameter. Coarse tourmaline grains tend to occur as isolated needles surrounded by quartz (Figs. 3A & G), whereas smaller tourmaline needles commonly form massive and irregular aggregates within the quartz veins (Figs. 3A & H). Tourmalines also form rosettes (Fig. 3I), poikilitic textures with inclusions of calcite and quartz within the tourmaline crystals (Fig. 3J), and may be aligned parallel to each other forming fibrous masses (Fig. 3K).
Tourmaline grains were recovered from the size fraction 0.25 to 0.5 mm of the HMC from all glacial sediment samples, and no tourmaline grain was recovered from the size fractions larger than 0.5 mm. The number of tourmaline grains normalized to 10 kg samples increases from 26 in the up-ice sample DG-001) to 56 in the northernmost sample (14-DG-002) within the Val-d’Or district before gradually decreasing to 14 in the down-ice sample (14-DG-003) located south of the district (Fig. 2B). Samples 14-DG-002, 14-DG-005, and 14-DG-004, located within the limit of the Val-d’Or district, contain more tourmaline grains compared to the northernmost and southernmost samples. Tourmaline grains recovered in the glacial sediment samples are characterized by a black color (Fig. 3L) and a translucent
21
brown colour when light passes through the grain. Most tourmaline grains occur as euhedral needles, broken perpendicular to the c-axis, corresponding to the primary texture of tourmalines associated to gold mineralization. Aggregates of tourmaline needles and quartz were also recovered in till samples. In backscattered electron images, tourmaline grains from till do not show any zonation. The petrographic characteristics of tourmaline grains recovered in glacial sediment samples are similar to those of tourmalines observed in Au-bearing quartz veins.
Figure 3: Photographs and microphotographs of tourmaline textures from quartz veins and till samples of the
Val-d’Or district. (A) Tourmalines occur as black euhedral needles in a quartz-tourmaline vein (Goldex). (B) Concentric and sector zoned tourmalines (Lac Herbin). (C) Concentric zoned tourmalines showing a light brown rim (Lapa). (D) Concentric zoned tourmalines showing a dark brown rim (Sigma 2). (E) Patchy zoned tourmalines