ANALYSIS OF DIOXINS AND DIOXIN-LIKE PCBS IN HOME PRODUCED EGGS:
LEVELS AND SOURCES
Ilse Van Overmeire1, Gauthier Eppe2, NadiaWaegeneers3, Luc Pussemier3, Leo Goeyens1, Ludwig De Temmerman3, and Joris Van loco1
1Scientific Institute of Public Health, J. Wytsmanstraat 14, B-1050, Brussels, Belgium
2CART Mass Spectrometry Laboratory, Chemistry Department, University of Liège, Allée de la Chimie 3, B-6c
Sart-Tilman, B-4000 Liège, Belgium
3Veterinary and Agrochemical Research Centre, (VAR-CODA-CERVA), Leuvensesteenweg 17, B-3080 Tervuren,
Belgium
Introduction
It has been demonstrated previously that eggs originating from free foraging animals and from hens of private owners are contaminated with higher levels of dioxins than eggs from animals held indoors. 1-4 The outdoor environment is believed to be the main contamination source of these eggs. In the frame of a recently performed study a number of families, living in different parts of Belgium, voluntarily participated in a national study determining the levels of different contaminants in their home produced eggs (dioxins, PCBs, pesticides, flame retardants, PAHs, heavy metals and mycotoxins). Here we present and discuss the obtained levels of dioxins and dioxin-like PCBs in eggs and soils. A second paper deals with the risk assessment 5
Materials and Methods
59 small farms and private homes in Belgium were visited once (in spring 2007) or twice (both in autumn 2006 and in spring 2007). This yielded 98 egg samples, 20 soils, 20 feces and 11 kitchen waste samples. Each analysed egg sample was a pool of 10 to 15 eggs. The soil samples were a mixture of 15 sub-samples from the top 10 cm at various locations in the outdoor run. Dioxins were determined by the CALUX method and by CG-HRMS as described.4, 6
Results and Discussion
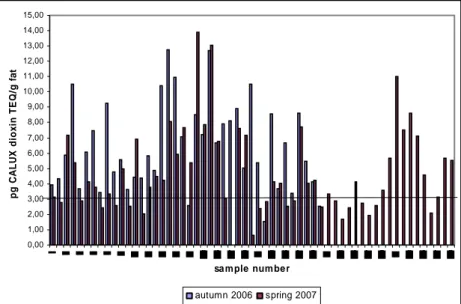
a) Levels in eggsThe dioxin results for the eggs (n = 98) obtained by the CALUX method are shown in Figure 1. The values range from 1.52 to 12.77 pg TEQ/ g fat in autumn 2006 and from 0.65 to 13.92 pg TEQ/ g fat in spring 2007. The obtained results clearly confirm the contamination of home produced eggs with dioxins as observed in our previous smaller study.4 10 samples of eggs of which 9 with a high CALUX TEQ value in autumn (>3.45 pg TEQ/g fat) were also analysed by GC-HRMS in autumn 2006 and in spring 2007 (n = 20) for confirmation of the contamination. The TEQ results are given in Table 1. It can be concluded that dl-PCBs are also present in the eggs and that the EU maximum level of 6 pg WHO-TEQ/ g fat for the sum of PCDD/Fs and dl-PCBs is exceeded in 9 samples. When using the WHO 2005 TEFs a decrease of 8 to 19% on PCDD/F TEQ values is observed. For dl-PCBs the drop is between 12 to 34%. However, the relative contribution of PCDDFs and dl-PCBs (%) to the TEQ value changes slightly when using 2005 TEF values as indicated in Table 1.
0,00 1,00 2,00 3,00 4,00 5,00 6,00 7,00 8,00 9,00 10,00 11,00 12,00 13,00 14,00 15,00 sa mple numbe r pg C A LU X di ox in TE Q/ g f a t autumn 2006 spring 2007
Figure 1: CALUX dioxin results for home produced eggs, the maximum allowed level for dioxins and furans is indicated by the horizontal line)
Table 1: Upperbound GC-HRMS values for egg samples analysed in autumn 2006 eggs PCDD/F (pg TEQ/ g fat) dl-PCBs (pg TEQ/ g fat) Total TEQ (pg/ g fat) PCDD/F (% total TEQ) dl-PCBs (% total TEQ) sample TEF 1998 TEF 2005 TEF 1998 TEF 2005 TEF 1998 TEF 2005 TEF 1998 TEF 2005 TEF 1998 TEF 2005 1 9.20 7.97 86.15 74.35 95.35 82.32 10 10 90 90 2 4.28 3.45 3.38 2.23 7.66 5.67 56 61 44 39 3 9.03 7.82 7.36 5.34 16.39 13.16 55 59 45 41 4 4.38 3.75 3.57 2.91 7.95 6.67 55 56 45 44 5 14.60 13.07 8.56 6.92 23.16 19.99 63 65 37 35 6 2.11 1.95 1.17 1.03 3.28 2.98 64 65 36 35 7 9.03 7.78 5.03 4.41 14.06 12.19 64 64 36 36 8 5.79 5.29 4.73 3.94 10.52 9.23 55 57 45 43 9 4.52 3.98 5.39 4.14 9.91 8.12 46 49 54 51 10 4.81 4.18 3.42 3.00 8.23 7.18 58 58 42 42 median 5.30 4.74 4.88 4.04 10.22 8.68 55 59 45 41 mean 6.78 5.92 12.88 10.83 19.65 16.75 53 55 47 45
b) Source of contamination in eggs
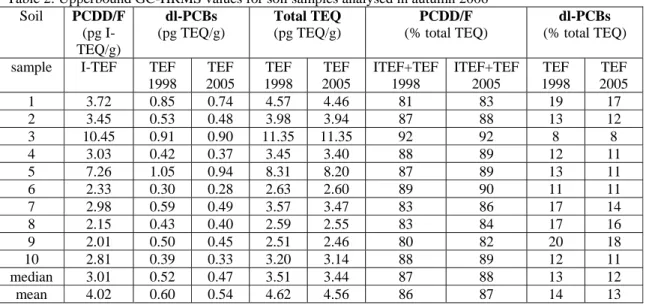
A limited study on 10 samples was performed to check the hypothesis of soil being the main source of contamination as suggested by the literature.7,8 The results for soil samples obtained by GC-HRMS are shown in Table 2. For soils we used I-TEFs for PCDD/F TEQ calculations since it was suggested that the WHO TEFs are less appropriate to use for abiotic samples.9
Modeling of the transfer of dioxins from different sources (soil, commercial feed, kitchen waste, forage and worms) showed that the soil is the major source of dioxin contamination in eggs. The similar dioxin profiles of eggs and soil (Figure 2) support this finding.
0 ,0 0 2 0 ,0 0 4 0 ,0 0 6 0 ,0 0 8 0 ,0 0 10 0 ,0 0 12 0 ,0 0 14 0 ,0 0 16 0 ,0 0 18 0 ,0 0 2 0 0 ,0 0 2, 3, 7, 8 - Tetr aCDD 1, 2 , 3, 7 , 8 Pen taC DD 1, 2, 3, 4, 7, 8 - He xaCDD 1, 2, 3, 6, 7, 8 - He xaCDD 1, 2, 3, 7, 8 , 9 - Hexa CDD 1, 2 , 3, 4, 6, 7, 8 - He ptaCDD Oct aCDD ( OCDD ) PCDF s 2, 3 , 7, 8 - T etraC DF 1, 2 , 3, 7 , 8 Pen taC DF 2, 3 , 4, 7 , 8 - Pent aCDF 1, 2, 3, 4, 7 , 8 - Hexa CDF 1, 2 , 3, 6 , 7, 8 - H exaC DF 1, 2 , 3, 7 , 8, 9 - He xaCDF 2, 3 , 4, 6 , 7, 8 - He xaCDF 1, 2 , 3, 4 , 6, 7 , 8 - He ptaCDF 1, 2 , 3, 4, 7, 8, 9 - He ptaCDF Oct aCDF (OCDF ) m e a n c on c ( pg/ g) eggs soils
Figure 2: PCDDF profile in eggs and soil
Most of the private hen holders use commercial feed and sometimes kitchen leftovers are also offered in addition as feed to the hens. Our analyses of kitchen waste samples indicated that their levels were all well below current maximum level for dioxins and dioxin-like PCBs (mean value obtained was 0.24 pg total WHO TEQ/g).
Table 2: Upperbound GC-HRMS values for soil samples analysed in autumn 2006 Soil PCDD/F (pg I-TEQ/g) dl-PCBs (pg TEQ/g) Total TEQ (pg TEQ/g) PCDD/F (% total TEQ) dl-PCBs (% total TEQ) sample I-TEF TEF
1998 TEF 2005 TEF 1998 TEF 2005 ITEF+TEF 1998 ITEF+TEF 2005 TEF 1998 TEF 2005 1 3.72 0.85 0.74 4.57 4.46 81 83 19 17 2 3.45 0.53 0.48 3.98 3.94 87 88 13 12 3 10.45 0.91 0.90 11.35 11.35 92 92 8 8 4 3.03 0.42 0.37 3.45 3.40 88 89 12 11 5 7.26 1.05 0.94 8.31 8.20 87 89 13 11 6 2.33 0.30 0.28 2.63 2.60 89 90 11 11 7 2.98 0.59 0.49 3.57 3.47 83 86 17 14 8 2.15 0.43 0.40 2.59 2.55 83 84 17 16 9 2.01 0.50 0.45 2.51 2.46 80 82 20 18 10 2.81 0.39 0.33 3.20 3.14 88 89 12 11 median 3.01 0.52 0.47 3.51 3.44 87 88 13 12 mean 4.02 0.60 0.54 4.62 4.56 86 87 14 13 We observed a clear trend between high soil levels and high egg levels although not for all cases with a high soil level a corresponding high level in eggs is found. Therefore we also evaluated information obtained by the hen holders about their living environment and possible contaminant sources. E.g. for sample 3 a high soil result is obtained while the TEQ for the corresponding eggs is not so elevated. Additional information shows that ashes are spread in this garden and that waste burning occurs. For sample 1 (very high dl-PCB value in the eggs) the
questionnaire learned that frying fats are regularly given to hens as feed and in the past the place was used as a storage place for building materials and diesel motors. In private gardens a wide diversity of hen houses and living conditions were observed, e.g. also the number and age of hens. Apparently there are many factors that may play a role in the contamination process (dioxin bioavailability, soil covering by grass (the more grass covering, the lower the dioxin levels in eggs). Probably these factors must also be taken into account when evaluating the egg contamination.
Acknowledgements
This study was financed by the Federal Public Service Health, Food Chain Safety and Environment (contract RT-06/9-CONTEGG).
References
1. De Vries M., Kwakkel R.P, Kijlstra A. NJAS Wageningen Journal of life Science s 2006; 54: 207-222. 2. Kijlstra A., Traag W.A., Hoogenboom L.A.P. Poulry Science 2007; 86: 2042-2048.
3. Schoeters G. and Hoogenboom R. Mol Nutr Food Res. 2006; 50: 908-914.
4. Van Overmeire I., Pussemier L., Hanot V., De Temmerman L., Hoenig M. and Goeyens L. Food Add. Contam. 2006; 23: 1109-1122.
5. Sioen I., Van Overmeire I., Eppe G., Waegeneers N., Pussemier L., De Henauw S., Goeyens L. submitted to this symposium
6. Focant J.F., Eppe G., Pirard C., De Pauw E. J. Chrom. A 2001; 925: 207-221. 7. Stephens R.D., Petreas M.X., Hayward D.G.Sc.Total Env.1995; 175: 253-273. 8. Schuler F., Schlatter C. Chemosphere 1997; 34: 711-718.
9. Van Den Berg M., Birnbaum L.S., Denison M., De Vito M., Farland W., Feely M., Fiedler H., Hakansson H., Hanberg A., Haws L., Rose M., Safe S., Schrenk D., Tohyama C., Tritscher A., Tuomisto J., Tysklind M., Walker N., Peterson R.E. Toxicol. Sc. 2006; 93: 223-241.