Use of Interbull traits as indicators for only locally evaluated traits as milk quality traits
5
0
0
Texte intégral
(2) Integration of Indicator Traits. By substituting by Wf s t we can also write that Tf s f = Tf Wf s t . Using this equivalence we can subtract from current estimates of s t (transformed scale) the contributions from fixed traits estimated from current solutions and add the contribution to canonical traits from a priori considered known breeding values for these fixed traits.. Milk quality traits are potentially highly related. Therefore a natural choice is to use a multi-trait model. Also the number of quality and indicator traits that should potentially be evaluated together is very high. Therefore a natural choice was to use a multi-trait canonical transformation extended to multiple diagonalization model (MTCT-MD) allowing missing values. Such evaluation programs exist nowadays, as MTJAAM (Gengler, 1998) and can be adapted. The requirement was therefore to develop a method that integrates into this type of modelling. It should allow integrating solutions for indicator traits and adjusting reliabilities for their contribution. Development of the software is under way, we will give in the present study only the basic algorithms and the theoretically achievable reliabilities from indicator traits.. sˆ t = sˆ t − Tf Wf sˆ t + Tf sf. Based on [3] the following equations to update estimates at round n based on a priori considered known breeding values and previous (round n-1) estimates, can be developed:. sˆ nt = [I − Tf Wf ]sˆ nt −1 + Tf sf. Strategy for the Integration of Indicator Traits Let s be a vector of breeding values of all traits for a given animal and s t a vector of transformed breeding values where T is the transformation matrix. The relationship between both vectors of breeding values can be given as s t = Ts and. (. ( )). * diag PEV sˆ t =. s = Ws t where W = T −1 . The vector of transformed solutions can also be written and decomposed in an alternative way:. [I − Tf Wf ]diag(PEV(sˆ t ) )[I − Tf Wf ]' + Tf diag(PEV(s f ) )Tf '. [5]. ( ) *. [1]. where PEV sˆ t are the PEV for adjusted transformed solutions and PEV (sˆ t ) are the PEV of transformed solutions from local data. Equations [5] are in line with the original estimation methods used to obtain PEV for transformed traits (Misztal and Wiggans, 1988; Gengler and Misztal, 1996). However in order to adjust for parent contributions the adjustment of PEVs has to be done iterating for those.. where f designates indicator traits for which breeding values on the original scales are considered known and fixed and v designates local traits for which breeding values are estimated and considered unknown and variable. To simplify representation traits will be considered ordered. In a similar fashion one can rewrite s = Ws t. Solutions and reliabilities for original traits are obtained by backtransformation. One can show that backtransformation of [4] guaranties obtaining of fixed solutions.. as: s W s = v = Ws t = v s t s f Wf . [4]. Reliabilities of breeding values can also be adjusted using the updating equations given in [4]. The strategy used in our implementation was the one presented by Gengler and Misztal (1995) where Prediction Error Variance (PEV) were computed on a transformed scale and final reliabilities obtained by backtransformation of PEV. Equations [4] can be adapted to reflect relationships between diagonal elements of PEVs as shown in equations [5].. Results and Discussion. s t = Ts = Tv s v + Tf s f. [3]. [2]. 191.
(3) In order to demonstrate the improvement of reliabilities, maximum theoretical achievable reliabilities from correlated indicator traits only were obtained using formula [5] and standard selection index theory. PEV were computed locally on a transformed scale and adjusted, then backtransformed to the original scales using an optimal and perfect diagonalization of genetic and phenotypic (co)variances.. show the expected behaviour. Interesting was that the correlations among fat, saturated and monounsaturated fat were not all high and quiet different showing some potential for differentiated selection. For example with a correlation of 0.62 one can imagine improving monounsaturated fatty acids independently from saturated ones. At the same time monounsaturated fatty acids are less related to overall fat than saturated.. Genetic Parameters for Milk Quality Traits and Search of Indicator Traits. Table 2. Genetic correlations among milk and major milk components. Table 1 contains first heritability estimates for certain milk quality traits. The values obtained are very encouraging showing that several traits had a very acceptable heritability. Most differences seem to be linked to the metabolically pathways distinguishing fatty acids that are more feed related (lower heritabilities) from those that are less related to feeding.. Trait Milk Fat (%) Protein (%) Saturated (%). Mono. -0.11 0.74 0.31 0.62. Complexity of fatty acid profiles makes it very difficult to consider them all easily. Literature cited by Soyeurt (2006) has shown interest in product/substrat ratios as indications for activity of delta-9 desaturase an important enzyme in the synthesis of unsaturated fatty acids.. Table 1. Heritabilities of milk, fatty acids and fatty acid ratios. Trait Milk Fat (%) Protein (%) Saturated fat (%) Mono unsaturated fat (%) C12:0 (%) C14:0 (%) C16:0 (%) C16:1 9-cis (%) C18:0 (%) C18:1 9-cis (%) C18:2 9-cis, 12-cis (%) C14:1/C14:0 C16:1/C16:0 C18:1/C18:0. Fat -0.23. Component (%) Protein Sat. -0.40 -0.19 0.57 0.97 0.54. Heritability 0.21 0.31 0.28 0.35 0.16 0.30 0.32 0.36 0.25 0.30 0.12 0.22 0.14 0.11 0.17. Table 3. Genetic correlations among milk and ratios as indicators of delta-9 desaturase activity. Trait Milk Fat (%) Protein (%) C14:1/C14:0 C16:1/C16:0. Delta-9 desaturase indicator ratios C14:1/C14:0 C16:1/C16:0 C18:1/C18:0 0.01 0.16 0.02 -0.47 -0.58 -0.79 -0.08 -0.40 -0.40 0.84 0.72 0.77. Table 3 gives genetic correlation on delta-9 desaturase activity related fatty acid ratios and milk yield, fat and protein content. Even if the three ratios are different traits they are highly related and show more negative correlations to fat than to protein content. These large differences are in line with results for monounsaturated fatty acids, a product of delta-9 desaturase activity. For the rest of this study we will solely focus of these three traits.. Potential indicator traits for milk quality traits are milk, fat and protein. Some preliminary computations showed the interest to used content instead of yield for fat and protein. Table 2 gives correlations among milk, fat, protein, saturated and monounsaturated fat content. Genetic correlations among milk, fat and protein content. 192.
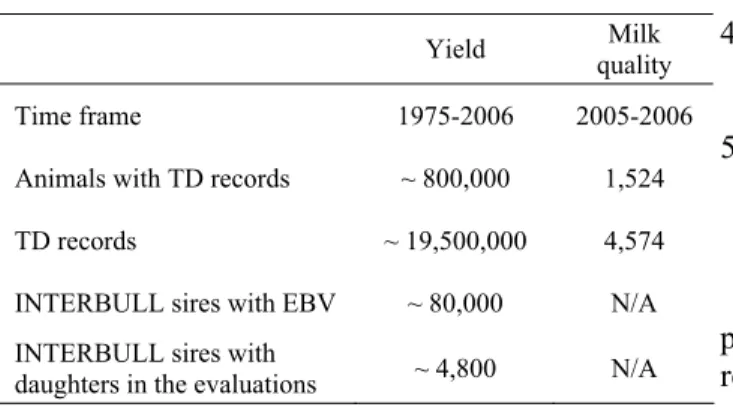
(4) Table 4. Data available for genetic evaluation of milk quality traits. Yield Time frame. 1975-2006. Animals with TD records. ~ 800,000. TD records. ~ 19,500,000. 2. INTERBULL routine-run. 3. Integration of INTERBULL results regular local routine-run using classical methods. Milk 4. Milk quality evaluation run with a multiquality trait-canonical transformation animal model without integration of INTERBULL EBV 2005-2006 5. Restart of run 4, integrating breeding values 1,524 from run 2 using the strategy described in this study. 4,574. INTERBULL sires with EBV. ~ 80,000. N/A. INTERBULL sires with daughters in the evaluations. ~ 4,800. N/A. The adapted MTJAAM (Gengler, 1998) program used has also the feature that reliabilities are estimated directly in the programs. EBV and Producting Abilities (EBV + Permanent environment) will be reported to allow producers to manage individually milk quality traits for cows (adjusting feeding etc.) and to eventually select cows and sires on milk quality. Available Data. Table 4 summarizes currently available data. Experimental data has been collected from March 2005 to March 2006 except for July and August from 25 farms for 1,524 cows and 4,574 test-day records. There is potential to extend this data collection scheme automating data acquisition in an experimental phase to around 50,000 cows and annually 500,000 test-day records. However even in this case the available data will be dwarfed compared to the more than 19,500,000 test-day records and the more than 31 years of time frame. This has implication on modelling.. Improvement of Reliabilities. Table 5 shows the theoretically maximum reliability that can be achieved from only correlated indicator traits under the hypothesis that no additional direct information was available and a perfect diagonalization of the genetic and phenotypic (co)variance matrices was used. Table 5. Evolution of maximum expected reliability for certain milk quality traits from sole correlated trait information for a given indicator trait reliability (same reliability for all indicator traits).. Experimental Genetic Evaluation System. Even if a local interest exists in milk quality traits any genetic evaluation for such traits will be low cost, capitalizing on existing data collection and evaluation schemes and focusing also on management. Milk quality data will be added to currently existing milk records and pedigree information. In this context the use of a multi-trait-canonical transformation animal model (MT-CT-AM) similar to the one used for type traits in the Walloon Region is an optimal compromise between quality of evaluation and cost-efficiency. The genetic evaluation strategy could be summarized like this:. Indicator 0.1 0.2 0.3 0.4 0.5 0.6 0.7 0.8 0.9. C14:1/C14:0 0.087 0.175 0.262 0.349 0.437 0.524 0.612 0.699 0.786. C16:1/C16:0 C18:1/C18:0 0.091 0.097 0.183 0.194 0.274 0.292 0.365 0.389 0.456 0.486 0.548 0.583 0.639 0.681 0.730 0.778 0.822 0.875. In practice these high values will not be obtained. However the assumption that no direct information is available is also not necessarily true as locally observed milk quality traits records can contribute through parents.. 1. Regular local routine-run for production traits using a random-regression multi-trait multi-lactation test-day model.. 193.
(5) Conclusion. References. This paper shows the potential for selection in milk quality traits especially ratios expressing delta-9 desaturase activity. The heritabilties and genetic correlations shown are preliminary, however they are so promising that research for the development of an experimental genetic evaluation system is underway. This study showed the theoretical development needed to integrate INTERBULL traits as indicators for only locally evaluated traits as milk quality traits. The software developed is likely to be used also in the regular genetic evaluation system in order to replace the current methods.. Gengler, N. & Misztal, I. 1996. Approximation of reliability for multiple-trait animal models with missing data by canonical transformation. J. Dairy Sci. 79, 317-328. Gengler, N. 1998. MTJAAM manual http://nce.ads.uga.edu/~ignacy/numpub/cont ributed/gengler/mtjaam/MTJAAM.MAN. Misztal, I. & Wiggans, G.R. 1988. Approximation of prediction error variances in large-scale animal models. J. Dairy Sci. (Supp1. 2), 27-32. Soyeurt, H. 2006. Contribution à l’étude de la variabilité génétique de la composition en acide gras du lait d’origine bovine. DEA Thesis. 69pp. Soyeurt, H., Dardenne, P., Dehareng, F., Lognay, G., Veselko, D., Marlier, M., Mayeres, P., Bertozzi, C. & Gengler, N. 2006. Estimating fatty acid content in cow milk using midinfrared spectrometry. J. Dairy Sci. (in press). Tarrés, J., Piedrafita, J. & Ducrocq, V. 2006. Validation of an approximate approach to compute genetic correlations between longevity and linear traits. Genet. Sel. Evol. 38, 65-83. VanRaden, P.M. 2001. Methods to combine estimated breeding values obtained from separate sources. J. Dairy Sci. 84(E. Suppl.), E47-E55. Weigel, K.A., Lawlor, T.J., VanRaden, P.M. & Wiggans, G.R. 1998. Use of linear type and production data to supplement early predicted transmitting abilities for productive life. J. Dairy Sci. 81, 2040-2044.. Acknowledgments Nicolas Gengler, who is Research Associate, and Coraline Croquet who is Research Fellow of the National Fund for Scientific Research (Brussels, Belgium), acknowledge their support. Additional support was provided by the National Fund for Scientific Research (Brussels, Belgium) as MIS F.4552.05 grant. The authors gratefully acknowledged the support of the Walloon Breeding Association.. 194.
(6)
Figure

Documents relatifs
Studying soil invertebrate responses to environmental changes is of great interest. plant ecology), functional components of communities have revealed 135.. valuable insights into
Partial least squares (PLS) regressions were performed to evaluate the predictive ability of the internal quality parameters of apples during growth and ripening
Dans ce filtrage nous devons donc commencer par vérifier la cohérence des résultats à ce niveau : nous avons deux listes, qui correspondent aux macro-classes qui ont
In this work the widest possible scope is covered, fifty-two of the attributes are related to part of speech, thirty-six to describe the conceptual/emotional category,
Extrinsic quality refers to traits which are associated with the product, namely (i) production system characteristics (from the animal to the processing stages including for
L’archive ouverte pluridisciplinaire HAL, est destinée au dépôt et à la diffusion de documents scientifiques de niveau recherche, publiés ou non, émanant des
We also build series representative of the connectivity level of the individuals: Connected u , N earbyAP s u , and N earbyBT s u tracking respectively APs to which the user
We could recover information for a maximum of 77 species, representative of most orders of brown algae (Supplemental Dataset 1). We estimated ancestral states for
