Université de Montréal
The Effects of Neuroligin-2 Absence on Sleep Architecture and EEG Activity in Mice
Présenté par Bong Soo SEOK Dirigé par Dre. Valérie MONGRAIN
Mémoire présenté à la Faculté de médecine en vue de l’obtention du grade de maîtrise en neurosciences
August, 2017
Résumé
Les troubles du sommeil sont comorbides avec la plupart des troubles psychiatriques, mais le lien entre ceux-ci n'est pas bien compris. Neuroligin-2 (NLGN2) est une molécule d'adhésion cellulaire qui joue un rôle dans la formation de synapses et la neurotransmission. En outre, NLGN2 a été associé à la schizophrénie, mais son implication dans le sommeil reste inexplorée. Dans le présent mémoire, l'effet de Nlgn2 knockout (KO) sur l'architecture du sommeil et l'activité EEG chez la souris a été étudié.
Deux électrodes d'électroencéphalographie (EEG) ont été implantées au-dessus de
l'hémisphère droit chez des souris pour enregistrer l’activité EEG pour quatre jours consécutifs. Les états de vigilance (éveil, sommeil paradoxal [REM], sommeil à ondes lentes [NREM]) ont été identifiés sur des époques de 4 s et la durée de l'état de vigilance a été calculée. L'analyse spectrale a été effectuée sur des époques sans artefact en utilisant la transformée rapide de Fourier.
Les souris Nlgn2 KO ont montré plus d'éveil et moins de sommeil NREM et REM par rapport aux souris normales (WT). Les changements dans les durées d’éveil et de sommeil proviennent des altérations au le cours de la période de 12h obscurité, car les souris KO ont présenté une durée normale de sommeil/éveil pendant la période de lumière de 12h. L’activité spectrale a montré un effet de génotype significatif pour les fréquences rapides (25 à 50 Hz) pendant tous les états de vigilance, avec les souris KO ayant moins d’activité que les WT. Les souris KO ont aussi montré une activité spectrale accrue à 2-5 Hz pendant le sommeil NREM. Ces données suggèrent que NLGN2 participe à la régulation de la durée du sommeil ainsi qu'à l'activité de l'EEG pendant l'éveil et le sommeil.
Mots clés: Neuroligine-2, états de vigilance, knock-out, architecture de sommeil-éveil, EEG,
Abstract
Sleep disorders are comorbid with most psychiatric disorders, but the link between these is not well understood. Neuroligin-2 (NLGN2) is a cell adhesion molecule that plays roles in synapse formation and neurotransmission. Moreover, NLGN2 has been associated with
schizophrenia, but its implication in sleep remains unexplored. In the present thesis, the effect of
Nlgn2 knockout (KO) on sleep architecture and EEG activity in mice has been investigated.
Two electroencephalography (EEG) electrodes were implanted above the right hemisphere in Nlgn2 KO mice and littermates to record EEG for four consecutive days. Vigilance states (wakefulness, rapid eye movement sleep [REM sleep], non-REM sleep [NREM sleep]) were identified on 4 sec epochs and vigilance state duration was calculated. Spectral analysis was performed on epochs without artifact using a Fast Fourier Transform.
Nlgn2 KO mice showed more wakefulness and less NREM and REM sleep compared to
wild-type (WT) mice. The changes in wakefulness and sleep durations originated from alterations during the 12h dark period because KO mice exhibited normal sleep/wakefulness duration during the 12h light period. The relative power spectra showed a significant genotype effect for fast frequencies (25-50Hz) during all vigilance states, with KO mice having less activity than littermates. The KO mice exhibited increased spectral activity at 2-5 Hz during NREM sleep. Moreover, abnormal burst of EEG activity was identified in the KO mice during wakefulness and REM sleep.
These data suggest that NLGN2 participates in the regulation of sleep duration as well as EEG activity during wakefulness and sleep.
Table of contents Résumé ---1 Abstract ---3 Table of Contents ---4 List of Tables ---7 List of Figures ---7 List of Abbreviations ---12 Acknowledgements ---15 Chapter 1. Introduction ---17 1.1. Sleep ---18 1.1.1. Functions of Sleep ---19
1.1.2. EEG Signal Phenotypes ---21
1.1.3. Models of Sleep Regulation ---23
1.1.4. GABAergic Transmission and Sleep ---26
1.2. Comorbidity ---27
1.2.1. Sleep Disorders ---27
1.2.2. Medical and Neurological Disorders ---29
1.2.3. Psychiatric Disorders ---30
1.3. Cell Adhesion Molecules ---32
1.3.1. Neuroligins ---32
1.3.1.1. Structure and Gene ---33
1.3.1.3. Association with Psychiatric Disorders ---36
1.3.2. Effects on Sleep ---37
Chapter 2. Objectives and Hypotheses ---39
2.1. Rationale and General Objective ---40
2.2. Hypotheses ---41
2.3. Specific Contribution of the Candidate ---41
Chapter 3. Methods ---43
3.1. Animals ---44
3.1.1. Nlgn2 KO Mice ---44
3.1.2. Genotyping ---44
3.1.3. Protein Extraction and Western Blotting ---45
3.1.4. Sex and Age ---47
3.2. Electrocorticographic/Electromyographic Electrode Implantation Surgery ---48
3.3. Protocol: Housing Condition and 24-h Baseline Recording ---49
3.4. EEG Recording ---50
3.5. EEG Analysis ---52
3.6. Abnormal EEG Activity Identification ---54
3.7. Statistical Analysis ---54
Chapter 4. Results ---56
4.1. Sleep Architecture ---57
4.1.1. Duration of Vigilance States ---57
4.1.2. Consolidation/Fragmentation of Vigilance States ---61
4.3. Power Spectra ---73
4.3.1. Spectral Power Density ---73
4.3.2. Delta Power ---77
4.3.3. Sigma Power ---79
Chapter 5. Discussion ---81
5.1. Summary of the Results ---82
5.1.1. Sleep Architecture ---82
5.1.2. Abnormal EEG Activity ---83
5.1.3. Wakefulness and Sleep Quality ---84
5.2. Effects of NLGN2 on Inhibitory Transmission ---85
5.2.1. Subcellular Localization of GABA Receptors by NLGN2 ---86
5.2.2. Effects of NLGN2 Absence in the Electrophysiology of Neurons ---89
5.3. NLGN2 and Sleep ---91
5.3.1. NLGN2 and the Flip-Flop Switch Model ---91
5.3.2. NLGN2 and Thalamocortical System ---93
5.3.2.1. Spindle Waves ---94
5.3.2.2. Delta Waves ---96
5.4. NLGN2 and Epileptiform Activity ---97
5.5. Limitations ---100
5.6. Perspectives ---102
5.7. Conclusion ---103
List of Tables
Chapter 4. Results
Table 4.1 – Absolute spectral power statistical comparison between genotype. Frequency bins, that were significantly different by one-way ANOVA (marked by yellow shading), were
subjected to t-test to compare the difference between WT and KO mice. Frequencies that exhibit significant difference between WT and KO mice are marked by orange shading.
Table 4.2 – Relative spectral power statistical data comparison between genotype. Frequency bins, that were significantly different by one-way ANOVA (marked by yellow shading), were subjected to t-test to compare the difference between WT and KO mice. Frequencies that exhibit significant difference between WT and KO mice are marked by orange shading.
List of Figures
Chapter 1. Introduction
Figure 1.1 – Schematic diagram of the flip-flop switch model that represents a seesaw like effect of sleep and wakefulness. (a) During wakefulness, monoaminergic wake inducing regions (LC, TMN, Raphe), which are reinforced by orexin (ORX) neurons, inhibit GABAergic sleep inducing regions (VLPO, eVLPO). (b) During sleep, GABAergic sleep inhibits orexin neurons and wake inducing regions. The mutual inhibition between wake and sleep inducing regions induces abrupt transition. LC, locus coeruleus containing noradrenaline; TMN,
tuberomammillary nucleus containing histamine; Raphe, dorsal and median raphe nuclei containing serotonin; eVLPO/VLPO, (extended) ventrolateral preoptic nucleus containing GABA (g-aminobutyric acid) and galanin. This figure has been taken from Saper, et al. 2005. Figure 1.2 – Splice codes of neuroligins (NLGN) and neurexins (NRXN) determining binding partners and synapse formation. (a) In addition to the canonical splicing site A (red colored arrowhead) in Nlgn genes, Nlgn1 has an extra splicing site B (blue colored arrowhead). Nrxn genes have a canonical splicing site 4 and each Nrxn gene can be subdivided depending on the size of extracellular domain. Nrxn gene with long extracellular domain is classified as Nrxna and
Nrxn gene with short extracellular domain is classified as Nrxnb. (b) Nlgn including splicing site
B such as Nlgn1AB and Nlgn1B couples with Nrxn1b excluding splicing site 4 to guide
excitatory synapse formation. Nlgn excluding splicing site B such as Nlgn1A, Nlgn1(-), Nlgn2A, and Nlgn2(-) couples with Nrxn1a independent to the presence of splicing site 4 as well as
Nrxn1b4(+) to guide inhibitory synapse formation. This figure has been taken from Dalva, et al.
Chapter 3. Methods
Figure 3.1 – A gel showing genotyping of Nlgn2 knockout (KO) mice, and heterozygous (HET) and wild-type (WT) littermates. WT mice displayed bands at 582 bp that migrated less than KO mice which display bands at 565 bp. HET mice displayed two bands at 565 and 582 bp (but the WT bands in HET has been systematically weaker and higher migrating).
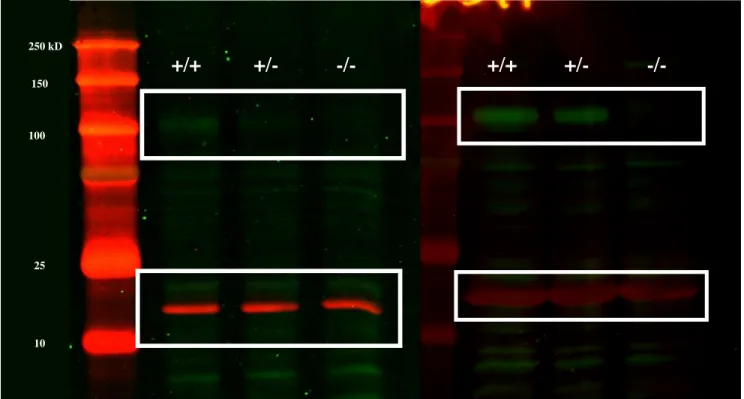
Figure 3.2 – Western blots showing NLGN2 and Actin stainings in brain extracts of Nlgn2 KO mice, as well as WT and HET littermates. Green bands in the upper white rectangles represent NLGN2, and red bands in the bottom white rectangles represent actin.
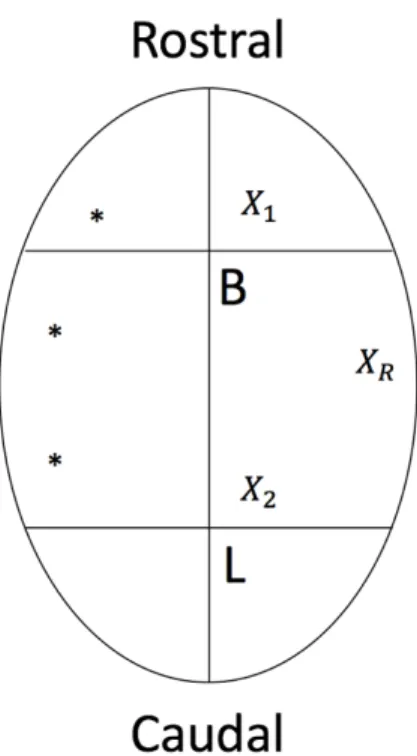
Figure 3.3 – Schematic diagram of electroencephalographic (EEG) electrode locations. Three
EEG electrodes were implanted on the right hemisphere; B= Bregma, L=Lambda, 𝑋"= Anterior
EEG electrode location, 𝑋#= Posterior EEG electrode location, 𝑋$= Reference electrode location,
*= anchor screw location.
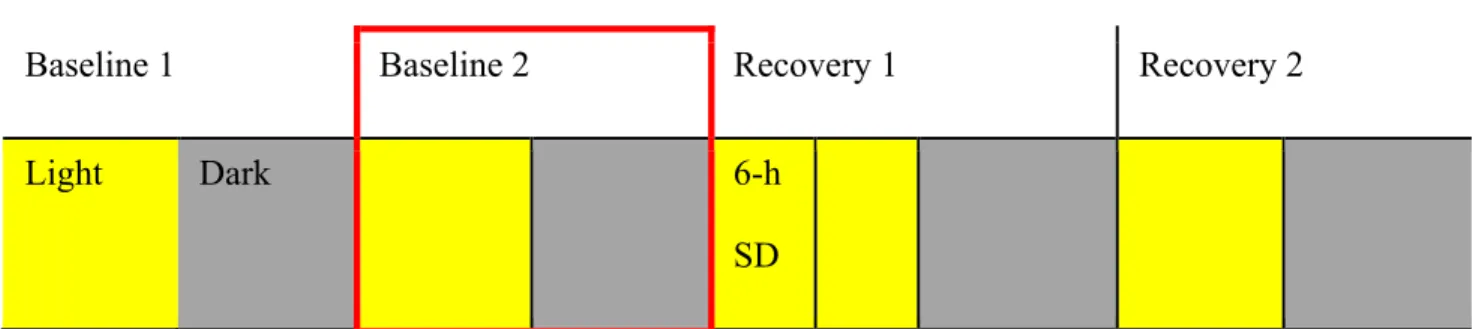
Figure 3.4 – Experimental design of the study. Brain activity of mice was continuously recorded for four consecutive days starting with light period. Sleep deprivation was performed on
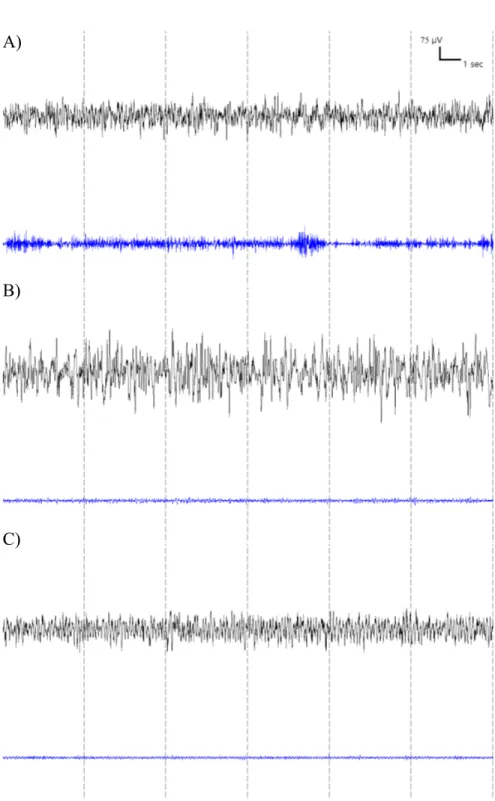
Recovery 1. Baseline 2, marked by red rectangle, was selectively investigated in this thesis. Figure 3.5 – Representative 24-sec EEG and EMG traces for each vigilance states of WT mouse. (A) Wakefulness is characterized by low voltage fast frequency EEG activity with high EMG activity. (B) NREM sleep is characterized by high voltage slow frequency EEG activity with low EMG activity. (C) REM sleep is characterized by prevalent regular theta EEG activity and blunted EMG activity.
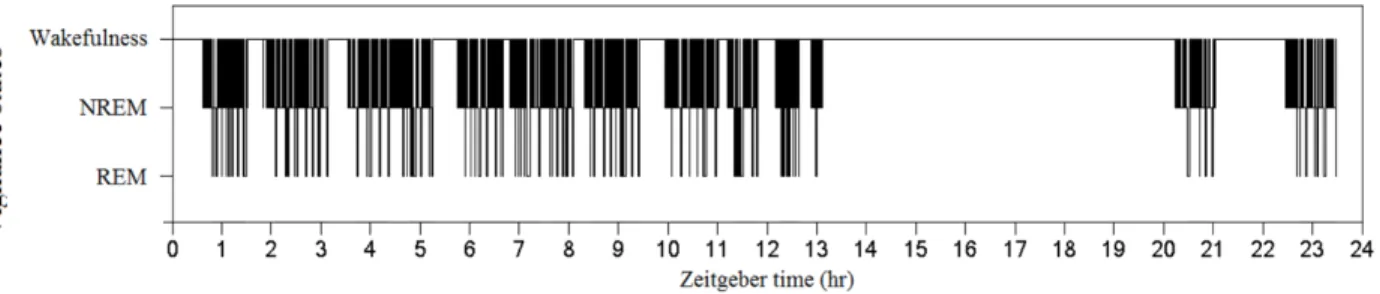
Figure 3.6 – Hypnogram of a wildtype mouse, subject# 850. Vigilance states of 24-h brain recording have been visually identified and hypnogram has been generated based on the visual identification. This hypnogram well illustrates the nocturnal rhythm of mice.
Chapter 4. Results
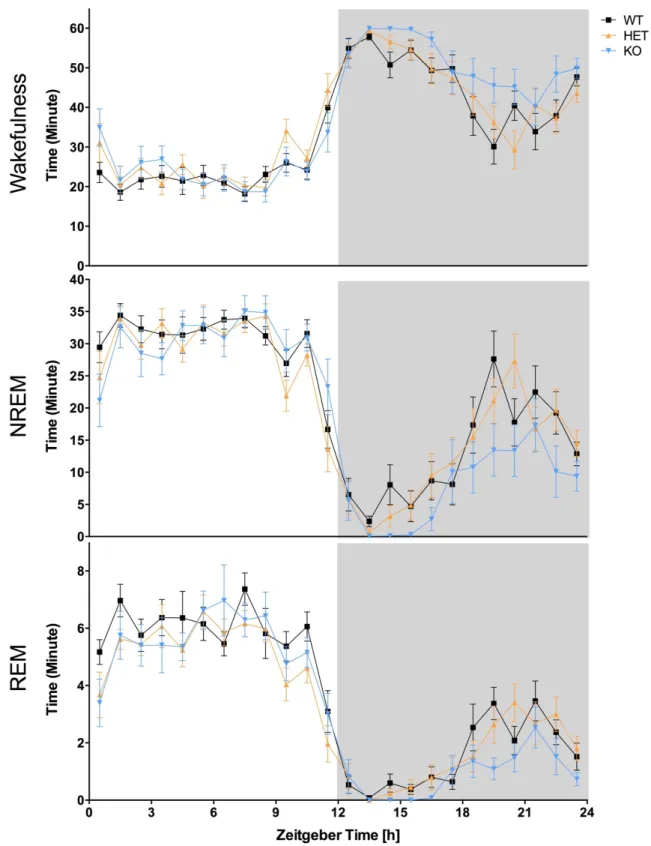
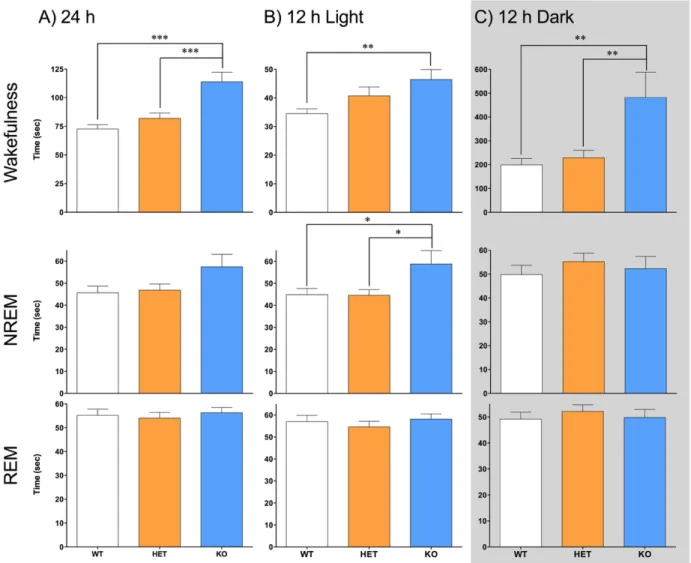
Figure 4.1 – (A) Duration of vigilance states during 24-h was measured in Nlgn2 knockout (KO) mice, and heterozygous (HET) and wild-type (WT) littermates. A significant genotype effect was observed in all vigilance states. Different number of stars represents the significant differences assessed by simple effect analysis between indicated points (*: p<0.05, **: p<0.01; also for panels B and C). (B) Duration of vigilance states during the 12-h light period. There was no genotype effect found in all vigilance states. (C) Duration of vigilance states during the 12-h dark period. A significant genotype effect was found for all vigilance states.
Figure 4.2 – The time course of the duration of vigilance states for the full 24-h baseline recording.Genotypes were significantly different in the duration of all vigilance states and the hourly duration of all vigilance states were also significantly different; however, there was no interaction between the genotype and the time course.
Figure 4.3 – (A) Mean duration of vigilance state episodes during 24-h. Nlgn2 KO mice showed longer mean duration of wake episodes than both HET and WT mice (*: p<0.05, **: p<0.01, ***: p<0.001; also for panels B and C). (B) Mean duration of vigilance state episodes during 12-h light period. While the mean duration of wake episodes of KO mice was significantly longer than WT mice, the mean duration of NREM sleep episodes of KO mice was longer than both WT and HET mice. (C) Mean duration of vigilance state episodes during 12-h dark period. KO mice showed longer mean duration of wake episodes than both HET and WT mice.
Figure 4.4 – The time course of the mean duration of vigilance state episodes for the full 24-h baseline recording. Genotypes were significantly different in the mean duration of wake episodes only, but the time course was significantly different in the mean duration of episodes of all vigilance states. These two variables, genotype and the time course, were interacting each other in NREM sleep. The significant interaction was observed between WT and KO mice at 2, 3, 4, 5, 6, 8, 10, and 14-h of the time course as represented by red symbols.
Figure 4.5 – (A) Total number of vigilance state episodes during 24-h baseline recording. KO mice had significantly less total number of wake episodes and NREM sleep episodes than WT and HET mice (*:p<0.05, **:p<0.01, ***:p<0.001; also for panels B and C). (B) Total number of vigilance state episodes during 12h light period. KO mice had significantly less total number of wake episodes than WT mice and had significantly less total number of NREM sleep episodes than WT and HET mice. (C) Total number of vigilance state episodes during 12 dark period. KO mice had significantly less total number of wake episodes and NREM sleep episodes than WT mice. The total number of REM sleep episodes of KO mice was significantly less than WT and HET mice.
Figure 4.6 – The time course of the total number of vigilance state episodes for the full 24-h baseline recording. Genotypes were significantly different in the total number of wake episodes and NREM sleep episodes, but the time course was significantly different in the total number of all vigilance state episodes. These two variables, genotype and the time course, were not
interacting with each other significantly.
Figure 4.7 – Abnormal EEG activity. (A) Example of abnormal burst of EEG activity during wakefulness and REM sleep in KO mice in comparison to normal EEG activity in WT mice. The abnormal event was not observed during NREM sleep. (B) The abnormal events represented by green dots were frequently observed in KO mice and the range of the abnormal event duration was wider in KO mice than HET and WT mice.
Figure 4.8 – Mean duration and average number of abnormal EEG activity during the full 24-h, the 12-h light period, and the 12-h dark period. Nlgn2 KO mice exhibited significantly more of abnormal EEG activity than WT and HET mice during all periods. The duration of abnormal EEG activity was also significantly longer in KO mice compared to both HET and WT mice in the full 24-h and the 12-h light period. During the 12-h dark period, KO mice exhibited
significantly longer duration of the abnormal events than HET mice only.
Figure 4.9 – Occurrence of the abnormal events in vigilance states of Nlgn2 KO mice. The abnormal events were mostly occurring during wakefulness and REM sleep.
Figure 4.10 – (A) Absolute spectral power between 1 and 50Hz in Nlgn2 knockout (KO) mice and wild-type (WT) and heterozygous (HET) littermates for the three vigilance states calculated over the 24-h baseline recording. Differences between KO and WT mice are indicated by red symbols (p < 0.05, t-tests; same in B). In general, spectral power of KO mice was higher than WT and HET mice across most of frequencies (B) Relative spectral power between 1 and 50Hz in Nlgn2 KO mice and littermates for the three vigilance states. In general, spectral power of KO mice at high frequency was lower than WT and HET mice.
Figure 4.11 – (A) 24-h dynamics of absolute delta (1-4Hz) activity in Nlgn2 KO mice, and HET and WT littermates during wakefulness and NREM sleep. Significant genotype by interval interaction was found in both wakefulness and NREM sleep. Differences between KO and WT mice are indicated by red symbols [same in B]. In general, KO mice exhibited higher delta power at most of intervals compared to WT and HET mice during both wakefulness and NREM sleep (B) 24-h dynamics of relative delta activity in Nlgn2 KO mice, and HET and WT littermates during wakefulness and NREM sleep. Significant genotype by interval interaction was found in both wakefulness and NREM sleep. During the 12-h light period, KO mice showed higher delta power compared to WT and HET mice in both wakefulness and NREM sleep. During the 12-h dark period. KO mice exhibited lower delta power in general compared to WT and HET mice in both wakefulness and NREM sleep.
Figure 4.12 – (A) 24-h dynamics of absolute sigma (10-13Hz) activity in Nlgn2 KO mice, and HET and WT littermates during NREM sleep. Significant genotype by interval interaction was found in NREM sleep. Differences between KO and WT mice are indicated by red symbols (same in B). In general, KO mice exhibited higher sigma power across all intervals compared to WT and HET mice. (B) 24-h dynamics of relative delta activity in Nlgn2 KO mice, and HET and WT littermates during NREM sleep. Significant genotype by interval interaction was not found for NREM sleep.
Chapter 5. Discussion
Figure 5.1 – The types of abnormal epileptiform activity that were observed from NS-Pten mutant mice during wakefulness. Short trains of repetitive spikes lasting less than 5 seconds were resembled to the abnormal EEG activity that was observed from Nlgn2 KO mice. The figure has been taken from Ljungberg et al 2009.
Figure 5.2 – Summary diagram of the proposal. (A) Under normal conditions, GABARs are inserted at extrasynaptic site. The GABARs are diffusely distributed or clustered at synaptic or extrasynaptic sites by trapping laterally diffusing GABARs. NLGN2 has been suggested to drive postsynaptic assembly of GABAARs containing a2/g2 or a1/a2 at perisomatic inhibitory
synapses by interacting with gephyrin/collybistin or DGC/S-SCAM complexes respectively. (B) In the absence of NLGN2, postsynaptic cluster of gephyrin/collybistin complex is disrupted,
possibly DGC/S-SCAM complex as well. Therefore, synaptic GABAARs would diffuse out of
the synaptic site and evenly distributed throughout the neuron. Then, extrasynaptic GABAARs
postsynaptic sites. It could be possible that NLGN2 regulates the subcellular localization of GABARs. This figure is influenced by one of figures from Bang, et al., 2013. DGC: Dystrophin-glycoprotein complex; S-SCAM: Synaptic scaffolding molecule; VGAT: Vesicuular gamma-aminobutyric acid transporter; NLGN: Neuroligin; NRXN: Neurexin; GABAR: Gamma-aminobutyric acid receptor.
Figure 5.3 – Representative traces of abnormal EEG activity. While wildtype mice (A) showed normal EEG signals, NLGN2 overexpressing mice (TgNL2.6; B) exhibited brief bursts of EEG activity during all of vigilance states. The abnormal EEG activity was consistently observed during wakefulness and REM sleep. This figure has been taken from Hines et al 2008.
List of Abbreviations
Acetylcholinesterase (AChE) Alzheimer’s disease (AD)
American Academy of Sleep Medicine (AASM) Analyses of variance (ANOVAs)
Ascending Reticular Activating System (ARAS) Autism spectrum disorders (ASDs)
Benzodiazepines (BZs) Calcium (𝐶𝑎#')
Cell adhesion molecules (CAMs) Deep sleep (N3) Distilled water (𝑑𝐻#𝑂) Dystrophin-glycoprotein complex (DGC) Electroencephalography (EEG) Electromyography (EMG) Ephrin (Efn)
Ephrin receptor family (Eph) Excitatory/inhibitory (E/I)
Extended ventrolateral preoptic nucleus (eVLPO) Falling asleep (N1)
Functional Magnetic Resonance Imaging (fMRI) GABA (Gamma-aminobutyric acid)
Hertz (Hz)
Heterozygous (HET)
Hyperpolarization-activated cation current, h-current (𝐼2) Immunoglobulin (Ig)
Knock-in (KI) Knockout (KO) Light sleep (N2) Locus coeruleus (LC)
Low threshold, or transient 𝐶𝑎#' current (𝐼 3)
Miniature excitatory postsynaptic currents (mEPSCs) Miniature inhibitory postsynaptic currents (mIPSCs) N-Methyl-D-aspartic acid (NMDA)
Neurexins (NRXNs) Neuroligins (NLGNs) Neuronal subset (NS)
Non-rapid eye movement (NREM) Obstructive sleep apnea (OSA) Orexin (ORX)
Parkinson’s disease (PD) Postsynaptic density (PSD)
Postsynaptic density protein 95 (PSD 95) PSD 95-DlgA-ZO1 (PDZ)
Rapid eye movement (REM) Serotonin (5-HT)
Serotonin transporters (SERT) Sleep deprivation (SD)
Slow wave activity (SWA) Splicing site 4 (SS#4) Splicing site A (SS#A) Splicing site B (SS#B)
Standard error of the mean (SEM) Synaptic homeostasis hypothesis (SHY) Synaptic scaffolding protein (S-SCAM) Tuberomammillary nucleus (TMN) Ventrolateral preoptic nucleus (VLPO) Wild-type (WT)
Acknowledgements
First of all, I would like to attribute this accomplishment to my supervisor, Dr. Mongarin. Studying at Université de Montréal has completely changed my life style in terms of new language, new school, and new neighborhood. Dr. Mongrain understood my situation and supported me to get through the Master’s degree. She was always there for me whenever I needed help or had a question about school material, research or writing. Without her guidance, I could not have completed the Master’s degree.
I would like to show my appreciation to Dr. Gibbs of the Hôpital du Sacré-Coeur de Montréal and Dr. Jia of the University of Toronto who help me to identify the abnormal EEG/epileptiform activity in Nlgn2 KO mice. They did not hesitate to share their opinions and interpretations regarding the abnormal signals.
To meet an optimal research environment, I believe two factors have to be satisfied. First, good research topic. Second, friendly colleagues. I was lucky to have them both. I will cherish the time I worked with my bright colleagues, Lydia, Julien, Nicolas, Cassandra, Erika, and Emma.
I would like to show my gratitude to my parents and my dearest friends, Nuribalhae Lee, Eugene Kang, and Joohwan Hyun. They never stopped believing in my choices and provided me a place to rest.
Lastly, I am deeply indebted to Dr. Robitaille and Dr. Takahashi. They were my mentors as well as thesis juries. Despite of their busy schedule, they always spared their time for me to help completing the Master’s degree.
Animal and human behavior is driven by biological and cognitive needs for their survival as supported by five major theories of motivation: intrinsic theory, drive reduction theory, arousal theory, psychoanalytic theory, and humanistic theory (Graham & Weiner, 1996; Gollwitzer, Delius, & Oettingen, 2000). Biological and cognitive needs/motives can be
categorized into the innate and acquired drives respectively (Knoll, 2005). Unlike the acquired drives for attaining dispensable goals, the innate drives such as hunger, thirst, libido, and sleep are essential in the survival of individual and species (Knoll, 2005). Innate drives encourage organisms to consume nutrients and pass on their genes to the next generation, but the purpose of sleep is less intuitive. In the introduction, sleep will be well described in terms of its functions, electroencephalogram (EEG) signal phenotypes, and control mechanisms. Then, we will address how sleep disorders are comorbid with medical and psychiatric disorders and how postsynaptic cell adhesion molecules contribute to sleep regulation.
1.1 Sleep
Sleep is an innate drive that can be observed in all animal species from invertebrates to vertebrates (Tobler, 2000). During sleep, animals enter a quiescent state with greatly reduced responsiveness (Siegel J. , 2005); therefore, sleep had been considered earlier as a passive process that manifested in the decrease of sensory input (Bremer, 1935) or Ascending Reticular Activating System (ARAS) activity (Moruzzi & Magoun, 1949). The lesion studies by von Economo rejected the passive theory of sleep and showed that sleep was actively generated by the anterior hypothalamus (von Economo, 1930). Sleep is not simply a state of immobility and unalertness. When sleep is prevented, the amount of sleep loss can be recuperated by following sleep (Dinges, Rogers, & Baynard, 2005). Moreover, sleep comprises two main different stages
in mammals, non-rapid eye movement (NREM) sleep and rapid eye movement (REM) sleep. These two stages oscillate throughout sleep (Aserinsky & Kleitman, 1953).
1.1.1. Functions of Sleep
Despite the fact that sleep is an essential part of animal functioning as prolong sleep deprivation is more fatal than starvation in animals (Rechtschaffen, 1998), there is no clear explanation for the functions of sleep.
From an evolutionary perspective, sleep has been adjusted to fit the ecological niche depending on the specie (Siegel, 2005; Siegel, 2009). The ecological hypothesis of sleep suggests that sleep can be shaped by factors like body size, diet, predation, and physical environment (Webb, 1974; Meddis, 1975). Mammals consume a lot of energy on maintaining body temperature and activities such as food consumption and predator avoidance, so sleep serves to conserve energy by reducing activity and body temperature (Webb, 1974). Small animals have higher surface area to volume ratio that radiates more heat per unit of mass; therefore, they require more energy to maintain a normal body temperature which make them prone to sleep more than large animals (Webb, 1974). The amount of sleep is further modified by the need for foraging requirements (Allison & Cicchetti, 1976; Elgar, Pagel, & Harvey, 1988; Siegel J. , 2005). Compared to carnivores, herbivores eat food poor in nutrients. In order to meet the energy requirement, herbivores spend more time in foraging/eating and sleep less than
carnivores (Elgar, Pagel, & Harvey, 1988). Moreover, sleep helps animals to avoid danger during the time when they are most vulnerable (Meddis, 1975; Siegel J. , 2005). For such a reason, predators spend more time in sleep than preys. The ecological view of sleep is well supported by physical restoration hypothesis, but it contradicts some observations. Sleep is an ecologically
costly state that animals are exposed to external environmental threats, but it has survived throughout the course of evolution. Some animals such as migrating birds and dolphins require continuous vigilance, but they have developed alternating unihemispheric sleep to satisfy the need rather than eliminating sleep (Siegel J. , 2005). Moreover, there was no significant
difference in energy consumption between wakefulness and sleep (Horne, 1980). Sleep may not have a functional role in physical restoration because muscle and other organs can recover from strain during quiet wakefulness.
Numerous studies have suggested a functional role of sleep in brain restoration as sleep deprivation causes cognitive impairments (Dinges, 2006). Sleep deprived subjects not only display decreased alertness towards monotonous tasks, but also show impairments in
multitasking, task involving higher cognitive functions, and task requiring sustained attention (Lim & Dinges, 2008). Sleep may restore brain function by eliminating toxic factors
accumulated during wakefulness or replenishing important resource. During sleep, interstitial space in the brain increases by about 60% that enhances the convective exchange between cerebrospinal fluid and interstitial fluid (XieL, et al., 2013); therefore, b-amyloid can be more effectively cleared out. Sleep may also replenish energy stores in the brain according to the energy hypothesis of sleep by Benington and Heller (Benington & Heller, 1995). During prolonged wakefulness, glycogen stores in astrocytes of the brain are depleted and extracellular adenosine accumulates in some brain regions including basal forebrain area which promotes sleep by inhibiting cholinergic neurons (Benington & Heller, 1995; Porkka-Heiskanen, Strecker, & McCarley, 2000). Sleep not only replenishes astrocytic glycogen level, but also decreases adenosine level in the cortex, basal forebrain, hypothalamus, and brainstem (Benington & Heller, 1995; Porkka-Heiskanen, Strecker, & McCarley, 2000). Moreover, multiple genes encoding
various enzymes and proteins are upregulated in the cerebral cortex and hypothalamus during sleep that might reconstruct multiple cellular components in preparation for the subsequent wakefulness (Mackiewicz, et al., 2007). The expression of Homer1a involved in neuroprotection is reliably affected by sleep loss but not affected by the corticosterone surge (Maret, et al., 2007; Mongrain, et al., 2010). During sleep, the overall level of HOMER1a decreased in the whole-forebrain while the post synaptic density (PSD) HOMER1a level increased (Diering, et al., 2017). The increased PSD HOMER1a level down scales excitatory synapses during sleep that might facilitate memory consolidation by improving signal-to-noise ratio (Diering, et al., 2017).
Additionally, a role of sleep in memory and learning has been demonstrated in a number of studies. In animals, sleep enhanced the performance of tasks learned during prior wakefulness by reactivating the task-related circuits primarily in hippocampus during NREM sleep (Born, Rasch, & Gais, 2006; Wilson & McNaughton, 1994). The reactivation during NREM sleep may
consolidate memory traces of previous learning in the absence of interference from external information. By functional Magnetic Resonance Imaging (fMRI), the reactivation of the hippocampal areas that were activated during route learning in a virtual town during NREM sleep was confirmed in human (Peigneux, et al., 2004). Therefore, the role of sleep in brain functioning has been widely accepted.
1.1.2. EEG Signal Phenotypes
Continuous EEG recording has been performed to identify vigilance states as well as to quantify the quality of vigilance states (Aserinsky & Kleitman, 1953; Cooley & Tukey, 1965). Wakefulness is characterized by desynchronized low amplitude fast frequency EEG activity. When eyes are closed in the preparation for sleep, beta and theta activities (13-30 Hz and 4-8 Hz,
respectively) diminish and alpha activity (8-13 Hz) becomes dominant particularly in the occipital lobe. Under normal circumstances, sleep first appears in the form of NREM sleep. In humans, NREM sleep can be categorized into three stages according to the American Academy of Sleep Medicine (AASM) manual for the scoring of sleep and associated events: falling asleep (N1), light sleep (N2) and deep sleep (N3). During N1 stage of falling asleep, alpha activity diminishes and low amplitude mixed-frequency EEG activity appears. Theta activity can be prominently observed from the mixed-frequency EEG activity. Then, N1 stage progressively transit to N2 stage of light sleep. During N2 stage, specific EEG features can be observed such as spindles (12-15 Hz) and k-complexes, but there is no difference in the general brain activity between N1 and N2 stages. Finally, NREM sleep enters N3 stage of deep sleep which is characterized by delta (0.7-4.5 Hz) activity. In the course of sleep, REM sleep follows NREM sleep and these two states oscillate. REM sleep is also known as paradoxical sleep because its EEG activity is very similar to wakefulness (Jouvet, 1965). REM sleep can also be subdivided into tonic and phasic stages depending on saccadic eye movements (Sánchez-López & Escudero, 2011). During REM sleep, EMG become atonic and theta activity is prominently observed. Except humans and primates, most rodents exhibit single stage of NREM sleep that is generally equivalent to N3 stage (Lesku, Martinez-Gonzalez, & Rattenborg, 2009).
Visual inspection of the EEG reveals states of the brain such as wakefulness, sleep, and seizure, but it does not inform the activity of brain or the quality of vigilance states. To test how deep a subject is asleep, acoustic stimulus threshold for arousal was measured in the sleeping subject (Neckelmann & Ursin, 1993). A 1000 Hz sine tone increasing 1.5 dB per second for 45 seconds was turned on at different vigilance states and the latency to arousal was measured (Neckelmann & Ursin, 1993). N2 stage showed higher arousal threshold than N1 stage and REM
sleep (Neckelmann & Ursin, 1993). Moreover, the amount of delta activity in NREM sleep is positively correlated with the level of arousal threshold (Neckelmann & Ursin, 1993). Delta activity in NREM sleep has been used as an indicator of sleep intensity or pressure (Borbély, 1982; Pappenheimer, et al., 1975). Delta activity is not only observed in NREM sleep, but also observed in wakefulness. Delta activity in wakefulness was increased during the performance of a mental task such as a difficult mental calculation task or the Sternberg paradigm (Harmony, et al., 1996). The amount of delta activity in wakefulness was positively correlated with the difficulty of a mental task (Harmony, et al., 1996). A mental task requiring greater attention to internal processing may enhance the delta activity and delta activity in wakefulness can be used as a parameter for wake quality. Sleep spindle is a waxing and waning wave at 10-13Hz that occurs during N2 stage. It has been used as an index of memory consolidation because spindle density was increased after learning pairs of unrelated words (Gais, et al., 2002) or a maze task (Meier-Koll, et al., 1999). Moreover, sigma activity enhances sleep continuity in the presence of disturbing auditory stimulus (Dang-Vu, et al., 2010).
1.1.3. Models of Sleep Regulation
There are three major hypotheses on sleep control mechanism: two-process model, flip-flop switch model, and synaptic homeostasis hypothesis. These hypotheses construct the
foundation of the research question in this study, so each model will be described in great details in following paragraphs.
The two-process model of sleep regulation suggests that there are two different processes, a homeostatic process S and a circadian process C, interacting together to regulate sleep
and dissipates in the course of sleep (Borbély, 1982; Borbély & Achermann, 1999). Unlike process S, process C is independent from the duration of vigilance states (Borbély, 1982). It is regulated by the intrinsic pacemaker suprachiasmatic nuclei of the hypothalamus in mammals which modulates the timing of sleep and wakefulness (Borbély, 1982; Daan, Beersma, & Borbély, 1984). Process C sets up an upper and lower threshold on process S (Borbély, 1982; Daan, Beersma, & Borbély, 1984). When the pressure of process S accumulates and hits the upper threshold of process C, sleep is initiated (Borbély, 1982; Borbély & Achermann, 1999; Daan, Beersma, & Borbély, 1984). Sleep terminates as the pressure of process S dissipate to the lower threshold of process C (Borbély, 1982; Borbély & Achermann, 1999; Daan, Beersma, & Borbély, 1984). The two important concepts of the model are that process S and C are
independent and sleep loss can be recovered by intensifying NREM sleep not necessary increasing NREM sleep duration (Borbély, 1982).
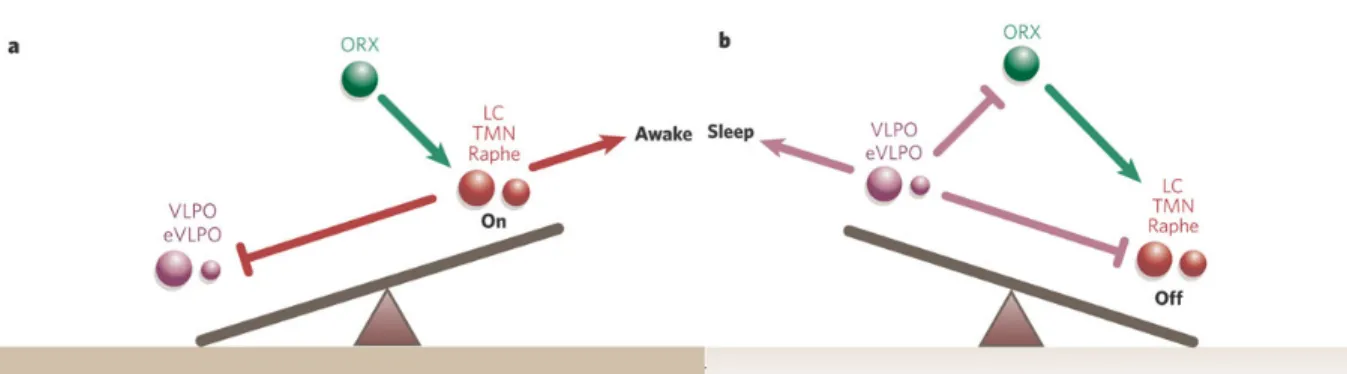
The Flip-flop switch model of sleep regulation well demonstrates the brain circuitry and neurotransmitters that regulate sleep and wakefulness [Figure 1.1] (Saper, Scammell, & Lu, 2005; Saper, Chou, & Scammell, 2001). Sleep inducing regions and wake inducing regions are
mutually inhibited to generate abrupt transition between these two states (Saper, Chou, & Scammell, 2001; Saper, Scammell, & Lu, 2005). Wake inducing regions, locus coeruleus,
tuberomammillary nucleus, and raphe nucleus, are monoaminergic (Aston-Jones & Bloom, 1981; Steininger, et al., 1999) and sleep inducing regions, ventrolateral preoptic nucleus (VLPO) and extended VLPO (eVLPO), are GABAergic [Gamma-aminobutyric acid] (Sherin, et al., 1996; Gaus, et al., 2002). Monoaminergic wake inducing regions can inhibit GABAergic sleep inducing regions by noradrenaline and serotonin (Gallopin, et al., 2000). Tuberomammillary neurons contain not only histamine, but also GABA which can inhibit VLPO (Vincent, Hökfelt,
& Wu, 1982). The flip flop switch is stabilized by orexin which reinforce the monoaminergic tone (Lee, Hassani, & Jones, 2005; Chemelli, Willie, & Sinton, 1999). Orexin may prevent unwanted transitions into sleep.
Figure 1.1 – Schematic diagram of the flip-flop switch model that represents a seesaw like effect
of sleep and wakefulness. (a) During wakefulness, monoaminergic wake inducing regions (LC, TMN, Raphe), which are reinforced by orexin (ORX) neurons, inhibit GABAergic sleep inducing regions (VLPO, eVLPO). (b) During sleep, GABAergic sleep inhibits orexin neurons and wake inducing regions. The mutual inhibition between wake and sleep inducing regions induces abrupt transition. LC, locus coeruleus containing noradrenaline; TMN,
tuberomammillary nucleus containing histamine; Raphe, dorsal and median raphe nuclei containing serotonin; eVLPO/VLPO, (extended) ventrolateral preoptic nucleus containing GABA (g-aminobutyric acid) and galanin. This figure has been taken from Saper, et al. 2005.
The synaptic homeostasis hypothesis (SHY) is well compatible with the postulated functions of sleep such as memory consolidation and brain restoration. The hypothesis suggests that synaptic strength increases during wakefulness due to the occurrence of plastic processes and the synaptic strength decreases back to a basal level during sleep (Tononi & Cirelli, 2003). The downscaled synaptic strength is an energetically stable state and beneficial for memory consolidation and learning (Tononi & Cirelli, 2003). The high synaptic strength at the end of wakefulness synchronizes neurons which generate the high amplitude slow wave of early sleep (Esser, Hill, & Tononi, 2007). Delta activity which reflects the process S (Borbély, 1982) has been hypothesized to be positively correlated with the synaptic strength (Turrigiano & Nelson,
2004). However, the SHY remains controversial because Tononi and Cirelli have not identified the molecular mechanisms that alter synaptic strength as a function of sleep, and they have not excluded the role of other biological processes that occur during sleep (Frank, 2013).
1.1.4. GABAergic Transmission and Sleep
GABAergic transmission has been implicated in the physiology and pharmacology of sleep according to the development of sedative-hypnotic drugs for insomnia treatment
(Winsky-Sommerer, 2009). Benzodiazepines (BZs) and Z-drugs are positive allosteric modulators that amplify the GABA effects (Winsky-Sommerer, 2009). These drugs bind to the interface between a- and g-subunits of 𝐺𝐴𝐵𝐴7 receptor called BZ-binding site (Sigel & Buhr, 1997).
𝐺𝐴𝐵𝐴7 receptors containing g-subunits are mainly localized synaptically due to the absence of d-subunit (Sieghart, et al., 1999; Nusser, Sieghart, & Somogyi, 1998; Fritschy & Brünig, 2003) and mediate phasic inhibition (Mody, De Koninck, Otis, & Soltesz, 1994). BZs and Z-drugs decrease sleep onset latency and increase sleep continuity (Winsky-Sommerer, 2009). These drugs alter sleep architecture by promoting NREM sleep and suppressing REM sleep (Borbély &
Achermann, 1991; Lemmer, 2007; Brunner, et al., 1991; Lader, 1992); moreover, they increase the spectral power of sigma activity and decrease the spectral power of delta activity (Lancel, 1999; Trachsel, et al., 1990; Brunner, et al., 1991).
THIP (gaboxadol), neuroactive steroids, tiagabine and alcohol are modulators of extrasynaptic 𝐺𝐴𝐵𝐴7 receptors containing d-subunits which mediate tonic inhibition (Nusser, Sieghart, & Somogyi, 1998; Fritschy & Brünig, 2003). The modulators enhance the total sleep time without affecting REM sleep (Winsky-Sommerer, 2009); moreover, they increase the spectral power of delta activity and decrease the spectral power of sigma activity (Faulhaber,
Steiger, & Lancel, 1997; Lankford, et al., 2008; Walsh, et al., 2005; Roth, Wright, & Walsh, 2006).
These observations imply that synaptic and extrasynaptic 𝐺𝐴𝐵𝐴7 receptors regulate sleep
differentially (Winsky-Sommerer, 2009). Synaptic 𝐺𝐴𝐵𝐴7 receptors which mediate phasic
inhibition might play a role in the induction/consolidation of NREM sleep and spindles, but they are also involved in the suppression of REM sleep and the slow-wave generation
(Winsky-Sommerer, 2009). Extrasynaptic GABAA receptors which mediate tonic inhibition play a role in
NREM sleep consolidation and EEG synchronization (Winsky-Sommerer, 2009). With the help of sedative-hypnotic drugs, it has been elucidated that GABAA receptors affect sleep differently
depending on their synaptic localization; however, how phasic and tonic inhibitions modulate sleep needs to be understood
1.2. Comorbidity
Comorbidity is the presence of one or more additional disorders with a primary disease (Valderas, et al., 2009). The association among medical, psychiatric, and sleep disorders has been recognized by epidemiological studies (Dikeos & Georgantopoulos, 2011; Spiegelhalder, et al., 2013), but the link that causes the comorbidity is poorly understood. In this section, the detailed description of comorbid disorders will be stated to reveal associations with sleep.
1.2.1. Sleep Disorders
Sleep disorders such as insomnia, periodic limb movement disorder, and obstructive sleep apnea (OSA) affect the duration, timing, and quality of sleep; however, the detrimental effects of sleep impairment have been underrecognized (Hillman, Murphy, & Pezzullo, 2006). Direct and
indirect health costs of sleep disorders and of associated conditions in Australia in 2004 was about $7.5 billion which accounted for 3.5% of the total burden of diseases in Australia (Hillman, Murphy, & Pezzullo, 2006). OSA and insomnia are the most common sleep disorders affecting the general population, but about 75% of insomniacs are secondary to medical, psychiatric, circadian, or other sleep disorders (Hillman, Murphy, & Pezzullo, 2006). These two sleep disorders both result in sleep loss.
Insomnia is characterized by difficulty falling and/or staying asleep, early morning awakenings, and nonrestorative or poor quality sleep (Ohayon, 2002; Mendelson & et al, 2004; Roth, 2007). People who suffer with insomnia utilize greater health resources and show higher risk of developing medical and psychiatric comorbidities (Terzano, et al., 2004; Alkens & Rouse, 2005; Ohayon, 2002). The major medical comorbidities are heart disease, neurologic disease, and chronic pain (Taylor, et al., 2007; Terzano, et al., 2004; Ohayon, 2002). The major psychiatric comorbidities are depressive disorders, anxiety disorders, and psychotic disorders (Ohayon, 2002; Terzano, et al., 2004). Insomniacs show 8 to 10 times higher risk of developing major depressive disorder (Roberts, Shema, Kaplan, & Strawbridge, 2000) and sleep disturbance has been observed prior to the development of psychotic episodes in schizophrenics (Zarcone & Benson, 1997; Chemerinski, et al., 2002).
OSA is characterized by repetitive episodes of shallow or paused breathing during sleep due to partial or complete obstructions of the upper airway (Pinto, et al., 2016). OSA can cause frequent night awakening resulting in excessive daytime sleepiness, reduced productivity, and impaired quality of life which are similar to insomnia symptoms (Pinto, et al., 2016; Ohayon, 2002). The major comorbidities associated with OSA are insomnia, hypertension, obesity, and depression and these comorbid disorders become more prevalent in OSA patients with more
severe symptom (Luyster, Buysse, & Strollo, 2010; Pinto, et al., 2016). Insomnia could be a confounding factor that causes comorbidity in OSA patients.
1.2.2. Medical and Neurological Disorders
Chronic pain patients often complain about sleep disturbances, including difficulty falling and staying asleep as well as sleep interruption. Polysomnographic studies in painful medical conditions such as postoperative pain and rheumatic diseases have shown reduced sleep
efficiency and altered sleep architecture (Onen, Onen, Courpron, & Dubray, 2005). Chronic pain patents exhibited an increase in wakefulness and N1 stage, and a decrease in N3 stage and REM sleep; moreover, alpha activity intrusions during sleep was also observed (Wittig, et al., 1982). While there are strong evidences that suggest the bidirectional pain-sleep relationship (Tang, Wright, & Salkovskis, 2007; Edwards, et al., 2008), the severity of pain does not indicate the severity of sleep disturbance (Smith, et al., 2000).
Neurological disorders are diseases of the central and peripheral nervous systems such as epilepsy, Alzheimer’s disease (AD) and Parkinson’s disease (PD), which are co-morbid with sleep disturbances. Epilepsy is a disorder characterized by recurring abnormal bursts of neural activity in the brain called seizure. People with epilepsy show sleep disturbances and abnormal sleep architecture which can be improved by epilepsy treatments (Derry & Duncan, 2013; Malow, Bowes, & Lin, 1997). Depending on the time of seizure occurrence, sleep is
differentially affected (Bazil, Castro, & Walczak, 2000). While patients with nocturnal seizure showed reduced sleep efficiency and increased REM latency, patient with diurnal seizure exhibited reduced NREM and REM sleep after the seizure events (Bazil, Castro, & Walczak,
2000). Moreover, polysomnographic studies have demonstrated a significant decrease in N2, N3, and REM sleep of epilepsy patients (Bazil, Castro, & Walczak, 2000).
AD is the most common form of a primary dementia characterized by dramatically shrunken brain (von Strauss, et al., 1999). Polysomnographic studies in AD revealed increased REM latency, and decreased N2 stage and REM sleep (Kundermann, et al., 2011). PD is a movement disorder that is characterized by rigidity, resting tremor, bradykinesia, changes in speech, and impaired postural reflexes (Suzuki, et al., 2011). The degeneration of dopaminergic neurons in substantia nigra has been suggested to be the main cause of PD, but the involvement of the serotonergic, noradrenergic, and cholinergic systems cannot be neglected (Jellinger, 1991). The changes in monoaminergic and cholinergic systems can lead to sleep disturbances as
revealed by polysomnographic sleep measure in drug-naïve PD patients (Joy, et al., 2014). They showed reduced sleep efficiency, increased sleep onset latency, prolonged N2 stage, and
decreased REM sleep (Joy, et al., 2014). Both AD and PD patients show REM sleep abnormalities.
1.2.3. Psychiatric disorders
Depression and anxiety disorders are the main affective disorder that exhibit sleep disturbances. According to polysomnographic studies, patients with major depression showed decreased sleep efficiency and altered sleep architecture characterized by decreased total sleep time, increased sleep onset latency, decreased NREM sleep proportion, increased REM sleep proportion as well as decreased REM latency (Benca, et al., 1992). Patients with anxiety disorders exhibited decreased total sleep time, reduced sleep efficiency, and increased sleep
latency; however, there was no change in proportion of NREM and REM sleep (Benca, Obermeyer, Thisted, & Gillin, 1992).
Schizophrenia is a mental disorder characterized by a combination of positive [e.g. hallucinations, delusion], negative [e.g. apathy, lack of emotion], and cognitive symptoms [e.g. disorganized thoughts, memory problems] (Berman, et al., 1997). Polysomnographic studies in schizophrenia revealed decreased total sleep time, decreased sleep efficiency, disturbed sleep continuity, increased sleep onset latency as well as reduced sleep spindles; however, there was no change in proportion of NREM and REM sleep (Benca, et al., 1992; Wamsley, et al., 2012).
Autism spectrum disorders (ASDs) are neurodevelopmental disorders which exhibit impairments in social interaction. Since sleep disturbance has a negative impact on the quality of life, it is important to carry out polysomnographic studies in autism (Devnani & Hegde, 2015). ASD children showed an increase in the proportion of N1 stage and a decrease in total sleep time and REM sleep latency (Devnani & Hegde, 2015). REM sleep of the ASD children was more significantly altered as decreased REM quantity, increased undifferentiated/indeterminate sleep, and immature organization of eye movements were observed (Devnani & Hegde, 2015). The etiology of sleep disturbances in psychiatric disorders is not well understood, but sleep impairment has been suggested to cause a negative effect on the capacity to treat psychiatric patients.
The association among sleep, medical, and psychiatric disorders has been suggested, but the underlying link that causes the comorbidity is not well understood. In this thesis, the effect of NLGN2 on sleep has been evaluated that will give a clue on the link between comorbid disorders.
1.3. Cell Adhesion Molecules
Neurons communicate or transmit information through electrical or chemical synapses (Purves, et al., 2008). At electrical synapses, presynaptic and postsynaptic neurons are directly linked together by a gap junction which allows electric current to flow passively (Purves, et al., 2008). In contrast to electrical synapses, there is a space between presynaptic and postsynaptic neurons called synaptic cleft in chemical synapses which requires the secretion of
neurotransmitters to induce cell-to-cell communication (Purves, et al., 2008). Chemical synapse is slower than electrical synapse, but it allows the amplification of signal as well as an additional level of signal regulation for the nervous system (Purves, et al., 2008). The synaptic cleft at chemical synapse is maintained by synaptic cell adhesion molecules (CAMs) which provide a mechanical link between pre- and post-synaptic terminals (Dalva, McClelland, & Kayser, 2007). There are several CAMs such as neurexins and neuroligins, Ephs and ephrins, immunoglobulin (Ig)-containing cell adhesion molecules and cadherins. These molecules have been suggested to do more than just bridging two neurons like regulating the formation, maturation, function and plasticity of synapses (Dalva, McClelland, & Kayser, 2007; Bang & Owczarek, 2013). Moreover, they share common protein domains which may allow them to coordinate synapse development in a similar way, but their unique motifs differentiate the function of each CAM and indicate the need of different CAMs to form a synapse. In this study, neuroligins will be specifically dealt with.
1.3.1. Neuroligins
Neuroligins (NLGNs) are postsynaptic cell adhesion molecules that play important roles in the establishment of functional synapses (Poulopoulos, et al., 2012; Südhof, 2008). While there
are only 4 NLGN genes found in rodents (Bolliger, et al., 2008), 5 NLGN genes have been identified in humans (Bolliger, et al., 2001). NLGN1 and 2 are expressed predominantly in the central nervous system, but NLGN2, 3 and 4 can be also detected in the peripheral nervous system (Suckow AT, et al., 2008; Philibert, et al., 2000). In humans, NLGN1 and 2 are only expressed in the brain (Bang & Owczarek, 2013).
1.3.1.1. Structure and Gene
NLGNs consist of a large extracellular catalytically inactive acetylcholinesterase (AChE) homologous domain which leads to the homo- or heterodimerization of NLGN (Poulopoulos, et al., 2012). The dimerization is required for surface trafficking of NLGNs (Poulopoulos, et al., 2012). Also, NLGNs have a short intracellular postsynaptic density protein 95 (PSD 95)-DlgA-ZO1 (PDZ)-binding domain that binds to postsynaptic components (Kurschner, et al., 1998). PDZ-binding domain of NLGNs does not only bind to postsynaptic scaffolding protein PSD95, but also bind to synaptic scaffolding protein (S-SCAM). S-SCAM is a postsynaptic scaffolding that interconnects NLGN with other CAMs such as b-cadherin and IgSF9b (Nishimura, et al., 2002; Woo, et al., 2013). While PSD 95 is only localized to excitatory synapses, S-SCAM is localized to both excitatory and inhibitory synapses. Proximal to the PDZ-binding domain of NLGN2 is the proline-rich region where collybistin and gephyrin binds (Nguyen, Horn, & Nicoll, 2016). The binding of the scaffolding protein gephyrin to NLGN2 activates collybistin (Kins, Betz, & Kirsch, 2000; Poulopoulos, et al., 2009). The activated collybistin tethers gephyrin to the
postsynaptic membrane which recruits both glycine and 𝐺𝐴𝐵𝐴7 receptors (Poulopoulos, et al.,
2009). Gephyrin is only localized to inhibitory postsynaptic sites (TyagarajanSK & FritschyJM, 2014).
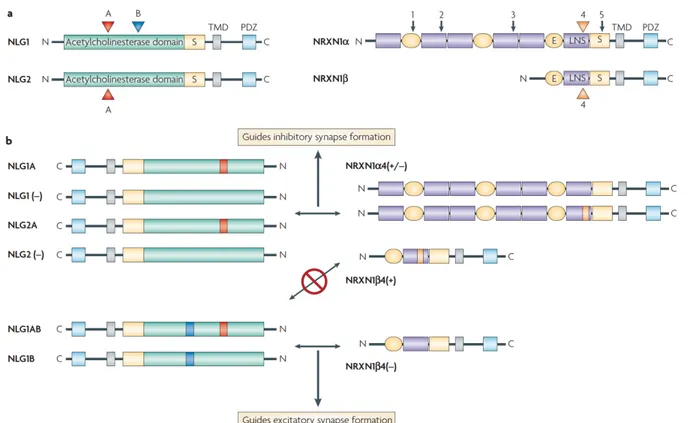
NLGNs undergo alternative splicing which determines their binding partners and regulates the expression selectivity toward excitatory or inhibitory synapses (Figure 1.2). Each of NLGN genes has a canonical splicing site A (SS#A) and NLGN1 has an additional splicing site B (SS#B). NLGN1 with SS#B selectively binds to only b-neurexin (NRXN) without splicing site 4 (SS#4), whereas NLGN1 without SS#B binds to a-NRXN without SS#4 and b-NRXN with or without SS#4 (Boucard, et al., 2005; Koehnke J, et al., 2010). The additional SS#B in NLGN1 favours the expression of NLGN1 toward excitatory/glutamatergic synapses, whereas NLGN1 without SS#B and NLGN2 are expressed predominantly at inhibitory/GABAergic synapses (Chih, Gollan, & Scheiffele, 2006). NLGN3 is a shared component in both excitatory and inhibitory synapses (Budreck & Scheiffele, 2007).
Figure 1.2 – Splice codes of neuroligins (NLGN) and neurexins (NRXN) determining binding
genes have a canonical splicing site 4 and each Nrxn gene can be subdivided depending on the size of extracellular domain. Nrxn gene with long extracellular domain is classified as Nrxna and
Nrxn gene with short extracellular domain is classified as Nrxnb. (b) Nlgn including splicing site B such as Nlgn1AB and Nlgn1B couples with Nrxn1b excluding splicing site 4 to guide
excitatory synapse formation. Nlgn excluding splicing site B such as Nlgn1A, Nlgn1(-), Nlgn2A, and Nlgn2(-) couples with Nrxn1a independent to the presence of splicing site 4 as well as
Nrxn1b4(+) to guide inhibitory synapse formation. This figure has been taken from Dalva, et al.
2007.
1.3.1.2. Functions
There are a number of in vitro studies suggesting a functional role of NLGNs in
synaptogenesis. Overexpression and knockdown of NLGNs result in an increase and decrease of synapse number respectively as well as changes in dendritic spine density (Chih, Engelman, & Scheiffele, 2005). When neurons were co-cultured with NLGN expressing HEK29 cells, the de
novo formation of morphological and functional presynaptic structure in contacting axons was
triggered (Scheiffele, et al., 2000). However, in vivo studies have demonstrated a contradicting effect of NLGNs in synaptogenesis compared to in vitro studies. Mice lacking NLGN1-3 died shortly after birth not because of a reduced synapse number, but due to the impaired
neurotransmission in brainstem respiratory centers (Varoqueaux, et al., 2006) . The insignificant change in synapse number of triple-KO mice left a controversial question whether NLGNs are involved in synapse formation or not.
On the other hand, both in vitro and in vivo studies have demonstrated the importance of NLGNs in synaptic maturation and function. Down-regulation of all three NLGN expression by RNA interference in cultured rat hippocampal neurons lowered the frequency of miniature inhibitory postsynaptic currents (mIPSCs), but did not cause any change in miniature excitatory postsynaptic currents (mEPSCs) (Chih, Engelman, & Scheiffele, 2005). In mice overexpressing
or ablated NLGN1, the frequency of mEPSCs was increased and decreased respectively without a significant change in the amplitude of mEPSCs (Schnell, et al., 2012; Kwon, et al., 2012). Spontaneous neural activity in prefrontal cortex of mice overexpressing NLGN2 was
characterized by increased frequency of mIPSCs (Hines, Wu, Hines, & et al, 2008). In the case of Nlgn2 KO mice, both frequency and amplitude of mIPSCs were decreased (Liang, et al., 2015). NLGNs have been suggested to regulate excitatory/inhibitory (E/I) balance in neurons (Prange, et al, 2004; Levinson, et al., 2005).
1.3.1.3. Association with Psychiatric Disorders
Mutations in the Nlgn genes have been linked to cognitive disorders such as schizophrenia and autism spectrum disorders (ASDs) (Bang & Owczarek, 2013). In autism patients, 13
different mutations in Nlgn1 have been observed (7 point mutations, 2 distinct translocation events, and 4 different large-scale deletions), a single X-linked point mutation at R451C in Nlgn3, and 15 different mutations in Nlgn4 (2 frameshifts, 5 missense mutations, 3 internal deletions, and 5 different copy-number variations) (Feng, et al., 2006; Yan, et al., 2008; Jamain & et al, 2003; Talebizadeh, et al., 2006; Marshall & et al, 2008; Südhof, 2008). In schizophrenia patients, 2 missense mutations at R215H and R621H in Nlgn2 have been observed (Sun, et al., 2011).
One of the influential reviews on ASDs written by Dr. Rubenstein and Dr. Merzenich suggests that ASDs can be caused by an increased excitatory/inhibitory (E/I) balance which leads to hyper-excitability of cortical circuits in sensory, mnemonic, social and emotional systems (Rubenstein & Merzenich, 2003). Their postulate well matches with the frequent observation of reduced GABAergic signaling in the autistic brain (Cellot & Cherubini, 2014). Like ASDs, schizophrenia exhibits a change in E/I balance due to hypofunction of NMDA receptors on
inhibitory interneurons (Moghaddam & Javitt, 2012). The hypofunction of NMDA receptors results in the reduction of E/I balance on fast spiking interneurons which disinhibits
glutamatergic neurons such as pyramidal cells in the neocortex and hippocampus (Moghaddam & Javitt, 2012). The disinhibition elevates the E/I ratio of glutamatergic neurons in cortical microcircuits, thereby increasing their firing rate (Yang, et al., 2016). Alterations in synapses such as spine morphology, synapse number and E/I balance have been associated with many other psychiatric and medical disorders ranging from retardation and autism to Alzheimer’s disease and addiction (Van Spronsen & Hoogenraad, 2010; Eichler & Meier, 2008); therefore, change in NLGNs might play critical role in psychiatric disorders by regulating synaptogenesis, synaptic function, and E/I balance.
1.3.2. Effects on Sleep
While the effects of cell adhesion molecules (CAMs) on synapse and human diseases have been widely studied, the link between CAMs and sleep is poorly understood (O'Callaghan, Ballester Roig, & Mongrain, 2017). Dr. Mongrain has demonstrated the effect of CAMs such as NLGN1 and EphA4 on sleep. NLGN1 is predominantly expressed at excitatory synapses and determines the activity and synaptic localization of NMDA receptors (Barrow, et al., 2009). The activation of NMDA receptors regulates the cleavage of NLGN1 (Peixoto & et al, 2012). Nlgn1 KO mice showed a decreased duration of wakefulness and the increased duration of NREM sleep (El Helou & et al, 2013). The quality of vigilance states of the KO mice was also altered (El Helou & et al, 2013). During wakefulness, KO mice exhibited a reduced activity in theta/alpha activity and they failed to show preference for social novelty (El Helou & et al, 2013). During sleep, KO mice showed an increase in delta activity (El Helou & et al, 2013; O'Callaghan,
Ballester Roig, & Mongrain, 2017). Moreover, NLGN1 is involved in sleep recovery process as Nlgn1 KO mice exhibited increased slow wave activity (SWA) rebound after sleep deprivation (El Helou & et al, 2013; Massart & et al, 2014).
EphrinA is a ligand that is bound by glycosylphosphatidylinositol linkage (Dalva, McClelland, & Kayser, 2007). The interaction between ephrinA and EphA4 tyrosine kinase receptor has been suggested to regulate the neuronal and neuroglial communications by
manipulating the expression level of AMPA receptors (Murai & Pasquale, 2004; Fu, Hung, Fu, & et al, 2011). EphA4 KO mice not only exhibited alterations in synaptic plasticity (Carmona, et al., 2009), but also showed changes in sleep. EphA4 KO mice showed less REM sleep, but the duration of individual episodes of wake and NREM sleep was increased during the light period. Moreover, the 24-h rhythm of NREM sleep sigma activity was blunted (Freyburger & al, 2016).
Recently, Liu et al 2017 has shown a significant alteration of spectral power in
𝑁𝑙𝑔𝑛3$>?"@ knock-in (KI) mice, an animal model of ASD. While the KI mice exhibited the
normal sleep and wake architecture, the KI mice exhibited increased sigma and beta activity during wakefulness and decreased delta activity during NREM sleep (Liu, et al., 2017).
A number of studies have demonstrated an association of CAMs with psychiatric disorders and sleep disturbances; therefore, CAMs might play a critical role in the specific comorbidity between the two. The need for studying other CAMs is necessary to better understand their role in comorbid disorders as indicated in O’Callaghan et al., 2017.
2.1. Rationale and General Objective
People who suffer with sleep disorders have a higher risk of developing medical and psychiatric disorders, but the link that causes the comorbidities is not well understood (Dikeos & Georgantopoulos, 2011; Spiegelhalder, et al., 2013). Since medical and psychiatric disorders exhibit alteration in excitatory/inhibitory (E/I) balance, NLGNs can be suspected to play a key role in causing comorbidity (Prange, et al. 2004; Levinson, et al., 2005; Rubenstein & Merzenich, 2003; Moghaddam & Javitt, 2012; Van Spronsen & Hoogenraad, 2010; Eichler & Meier, 2008). NLGNs are postsynaptic cell adhesion molecules that regulate morphological and functional synaptic properties and their mutations have been linked to specific cognitive disorders such as autism and schizophrenia (Dalva, McClelland, & Kayser, 2007; Bang & Owczarek, 2013). Among several NLGN subtypes, NLGN2 is expressed predominantly at inhibitory synapses and the expression level of NLGN2 is inversely related to E/I balance (Bang & Owczarek, 2013).
Nlgn2 KO mice shows a decrease in both amplitude and frequency of mIPSCs (Liang, et al.,
2015). The impaired inhibitory synaptic function is correlated with their behavior phenotypes such as anxiety, hypoalgesia, and ataxia (Blundell, et al., 2009). A recent study showed that the
level of NLGN2 and a1-subunit of the 𝐺𝐴𝐵𝐴7 receptor was increased on orexin neurons after
6-h deprivation on mice (Matsuki, et al., 2015). T6-hese c6-hanges 6-have been implicated in increased sleep pressure (Matsuki, et al., 2015), but the specific effect of NLGN2 on sleep is not well understood. The general objective of this study is to evaluate the role of NLGN2 in sleep
2.2 Hypotheses
The brain circuitry that regulates sleep and wakefulness has been pictured in the flip-flop switch model of sleep regulation (Saper, Scammell, & Lu, 2005). GABAergic sleep inducing regions and monoaminergic wake inducing regions are mutually inhibited (Saper, Scammell, & Lu, 2005). Since Nlgn2 KO mice exhibit impaired inhibitory synaptic function (Liang, et al., 2015), it is hypothesized that wake inducing regions will override sleep inducing regions in these mutant mice and that the KO mice will thus show more wakefulness and less sleep.
NLGN2 and gephyrin complex activates collybistin which tethers gephyrin to the
postsynaptic membrane to recruits 𝐺𝐴𝐵𝐴7 receptors at the synapse (Poulopoulos, et al., 2009).
According to the development of sedative-hypnotic durgs for insomnia treatment, GABAergic transmission has been implicated in the physiology and pharmacology of sleep
(Winsky-Sommerer, 2009). Synaptic 𝐺𝐴𝐵𝐴7 receptor agonists have induced NREM sleep consolidation
and REM sleep suppression; moreover, they increase the spectral power of sigma activity and decrease the spectral power of delta activity (Lancel, 1999; Trachsel, et al., 1990; Brunner, et al.,
1991). Since the clustering of 𝐺𝐴𝐵𝐴7 receptors at synaptic sites was abolished in Nlgn2 KO
mice(Poulopoulos, et al., 2009), the KO mice will exhibit the weakened-phasic inhibition and
result in-increased spectral power of delta activity and decreased spectral power of sigma activity.
2.3 Specific contribution of the candidate
Throughout the study, I gained experience in three different fields: molecular study, animal study, and EEG phenotyping. In molecular study, I learned how to do genotyping and Western blotting. In animal study, I learned how to handle/sleep deprive mice and sacrifice mice.
with help from my colleagues. My main task in the project was phenotyping EEG signal by visually identifying vigilance states. Then, I marked abnormal EEG events throughout signals. After the quantification, I analyzed sleep-wake architecture and EEG activity. Based on the literature review, I have completed my thesis.
3.1. Animals
3.1.1. Nlgn2 KO Mice
Mixed genetic background (B6;129-Nlgn2tm1Bros/J) mice were purchased from Jackson
Laboratories and bred on site by placing male and female heterozygous mice in a breeding cage to generate three genotypes: homozygous Nlgn2 knockout (KO) mice, and heterozygous (HET) and wild-type (WT) littermates. Nlgn2 KO mice were previously generated by homologous recombination (Varoqueaux, et al., 2006). A targeting vector containing a neomycin resistance cassette was electroporated into 192Sv-derived embryonic stem cells and disrupted Nlgn2 exon sequences covering the translational start site and 380 base-pair of 5’ coding sequence. Then, the targeted embryonic stem cells were transfected into C57BL/6 blastocysts. All the following experiments was approved by the Ethical Committee for Animal Experimentation of the Hôpital du Sacré-Coeur de Montréal.
3.1.2. Genotyping
In brief, mouse genomic DNA was isolated from ear tissue following overnight digestion at 56°C and 800rpm in 180µL ATL buffer and 20µL proteinase K using a DNA extraction kit from Qiagen. By using NanoDrop2000, it was confirmed that the amount of DNA was at least 10ng/µL. Then, PCR was performed with a master mix that comprised 8.18µL distilled water
( 𝑑𝐻#𝑂), 4.3µL 5XPCR buffer (KAPA), 2.5µL MgCl2 (25mM KAPA), 0.5µL dNTP (10mM),
1.2µL O29A primer (20µM, common forward: GTC TCA GTA AGC TTA TTT GAG AAG CCA A), 1.2µL 030A primer (20µM, wildtype reverse: CTC TGG GCC TTC TCA GGA CTG TAC), 1.6µL O31A primer (20µM, mutant reverse: GAG CGC GCG CGG CGG AGT TGT
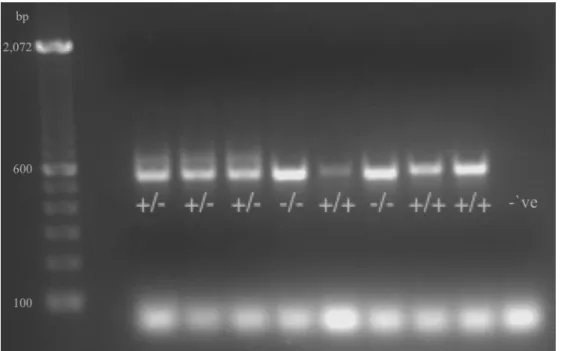
TGA C), 0.12µL Taq DNA polymerase hotstart (5U/µL KAPA), and 2µL DNA (³10ng of DNA). PCR conditions were as follows: the first cycle at 94°C for 3min, 30 cycles of 94°C, 66°C, and 72°C for 30sec each, and the last cycle at 72°C for 2 min. The PCR products were run in 2% agarose gels and DNA was visualized using a Syngen multi genius bio imaging system at 600ms EtBr/UV exposure (Figure 3.1). According to the information that is provided by Jackson
Laboratories, the expected band sizes for WT, HET, and KO alleles are 582 bp, 565 and 582 bp, and 565 bp respectively.
Figure 3.1 – A gel showing genotyping of Nlgn2 knockout (KO) mice, and heterozygous (HET)
and wild-type (WT) littermates. WT mice displayed bands at 582 bp that migrated less than KO mice which display bands at 565 bp. HET mice displayed two bands at 565 and 582 bp (but the WT bands in HET has been systematically weaker and higher migrating).
3.1.3. Protein Extraction and Western Blotting
In brief, mice whole brains, excluding cerebellum and olfactory bulb, were washed with cold PBS and homogenized in 2 mL RIPA lysis buffer (1 mL Hepes, 80 µL EDTA, 20 µL SDS
10%, 200 µL Igepal 10%, 100 µL sodium deoxycholate, 20 µL protease inhibitor, 20 µL
phosphatase inhibitor, 560 µL 𝑑𝐻#𝑂) using a rotor stator homogenizer. All the homogenization
steps were carried out on ice. The homogenate was centrifuged at 8000 x g for 40min at 4°C and then the supernatant was collected. The total protein concentration was determined by DC protein assay with an EnSpire system (Perkin Elmer) to load an equal amount of protein. Before loading, proteins were denatured in laemmli buffer and b-mercaptoethanol (5min at 95ºC). The denatured protein was loaded onto 10% polyacrylamide gel and proteins were separated
depending on molecular weight during electrophoresis at 150V for 85 min. Then separated proteins were transferred onto nitrocellulose membranes.
A snap I.D. 2.0 system (Millipore) has been employed for Western blotting. Blots were blocked with Odyssey blocking buffer to prevent non-specific binding of antibodies. Antibodies used were polyclonal rabbit anti-Neuroligin 2 (1:2000; SYSY; 129 203), mouse anti-actin (1:1000; FroggaBio; AM1829B), goat anti-rabbit (1:15000; Mandel Scientific; 926-32211) and goat anti-mouse (1:15000; Mandel Scientific; 926-68070). Membranes were revealed by
Odyssey imaging system (Li-Cor Biosciences). Western blots confirmed the absence of NLGN2 in KO mice and the reduced protein level of NLGN2 in heterozygous compared to WT (Figure 3.2).