Université de Montréal
Déterminer les mécanismes impliqués dans les effets du récepteur à
la rénine et prorénine dans l’obésité et dans le diabète
par
Zulaykho Shamansurova (Akhmedova)
Département de Physiologie Moléculaire et Intégrative Faculté de Médecine
Thèse présentée à la Faculté de Médecine en vue de l’obtention du grade de Doctorat (PhD)
en Physiologie Moléculaire, Cellulaire et Intégrative
Aôut 2016
Université de Montréal Faculté de Médecine
Cette thèse intitulée :
Déterminer les mécanismes impliqués dans les effets du récepteur à
la rénine et prorénine dans l’obésité et dans le diabète
Présentée par :
Zulaykho Shamansurova (Akhmedova)
Département de Physiologie Moléculaire et Intégrative Faculté de Médecine
a été évaluée par un jury composé des personnes suivantes :
Professeur Réjean Couture, Président-rapporteur Dre Julie L. Lavoie, Directrice de recherche
Dr Ashok Srivastava, Membre du jury Dre Louise Larose, Examinateur externe Dr. John Chan, Représentant de la doyenne
University of Montreal
Determining mechanisms implicated in the effects of the renin and
prorenin receptor in the development of obesity and diabetes
by
Zulaykho Shamansurova (Akhmedova)
Department of Molecular and Integrative Physiology Faculty of Medicine
Thesis presented at the Faculty of Medicine to obtain a Doctoral degree (PhD)
in Molecular, Cellular and Integrative Physiology
August 2016
University of Montreal
Determining mechanisms implicated in the effects of the renin and
prorenin receptor in the development of obesity and diabetes
by
Zulaykho Shamansurova (Akhmedova) Department of Molecular and Integrative Physiology
Faculty of Medicine
evaluated by a Jury including the following members: Professor Réjean Couture, Chairman-Reporter
Dre Julie L. Lavoie, Director of Research Dr Ashok Srivastava, Member of jury Dre Louise Larose, External examiner Dr. John Chan, Representative of the Dean
Résumé
L'obésité est une épidémie mondiale qui augmente le risque de développer un diabète de type 2 ainsi que ses complications. Chez les individus obèses, le tissu adipeux sécrète de grandes quantités d'hormones et de cytokines qui affectent négativement le métabolisme du glucose et des lipides, ce qui provoque l'inflammation et la résistance à l'insuline. L'obésité augmente également l'activité du système rénine-angiotensine (RAS) localement au niveau de différents tissus et de façon systémique dans la circulation. L’angiotensinogène est convertie en angiotensine I par la rénine, ainsi que par la prorénine uniquement quand la prorénine est liée au récepteur de la rénine et prorénine [(P)RR] 1 . Ceci est la voie angiotensine-dépendante
(Ang-D) du (P)RR. La liaison de la rénine et de la prorénine avec le (P)RR active également une voie angiotensine-indépendante (Ang-ND), ce qui produit une signalisation intracellulaire comportant la mitogen activated protein kinase (MAPK), la extracellular regulatory kinase 1/2 (ERK1/2), la promyelocytic leukemia zinc finger protein (PLZF) et le tumor necrosis factor alpha (TNF-a). Ceux-ci peuvent provoquer la croissance et la prolifération cellulaire, l'apoptose et la fibrose et pourraient donc être reliés aux dommages tissulaires et aux complications associées à l'obésité 1, 2. Plusieurs effets bénéfiques d’un blocage pharmacologique du (P)RR
ont été rapportés tels la prévention du développement d'une fibrose cardiaque et rénale ainsi que la prévention de la néphropathie et de la rétinopathie diabétique. Cependant, les effets du (P)RR dans le tissu adipeux ont été peu étudiés.
Par conséquent, notre objectif était d'étudier le rôle du (P)RR dans le développement de l'obésité et de la résistance à l'insuline par : 1) l'administration de HRP (un peptide bloquant l’effet du (P)RR) chez un modèle de souris obèse par l’administration d’une diète riche en gras (HFD), et 2) l’évaluation de souris ayant une délétion (KO) du gène (P)RR spécifiquement dans le tissu adipeux, qui a été généré dans notre laboratoire par la technologie Cre-LoxP.
L'expression du gène et de la protéine du (P)RR dans les tissus adipeuxétait augmentée chez les souris nourries avec une HFD indépendamment du traitement au HRP. Le traitement par le HRP a réduit le poids corporel et la masse adipeuse chez les souris nourries avec une HFD alors qu’une tendance pouvait être observée chez les souris sur diète normale (ND). De façon similaire, les souris (P)RR KO spécifiquement dans le tissu adipeux avaient une réduction du
poids corporel et de la masse adipeuse, même sur ND, ce qui suggère fortement l'implication du (P)RR dans le tissu adipeux dans le développement de l'obésité.
Le phénotype des souris KO incluait une augmentation de l'activité horizontale uniquement dans leur période active, ce qui pourrait contribuer à augmenter leur métabolisme énergétique et ainsi réduire leur poids corporel et leur masse adipeuse. De plus, les souris KO homozygotes mâles avaient un métabolisme de base plus élevé car nous avons observé une augmentation de la consommation d'oxygène et de la production de dioxyde de carbone pendant leur période active et de sommeil. Cette augmentation du métabolisme pourrait résulter, en partie, d'une augmentation de la thermogenèse comme en témoigne l’expression accrue du gène de brunissement, PRDM16, dans le tissu adipeux péri-rénale de souris mâles KO. Conformément à cela, des résultats récents provenant de notre laboratoire ont également démontré que le HRP pouvait induire du brunissement au niveau du tissu adipeux sous-cutanée
3.
Chez les souris traitées avec le HRP, bien que la glycémie eût été similaire aux souris recevant le placebo, l'insuline plasmatique et le rapport insuline/glucose était plus faible indépendamment de la diète. De façon similaire, les souris (P)RR KO avaient une insulinémie et un taux de peptide C plus faibles par rapport aux souris contrôles, sans aucune différence dans les courbes de la glycémie au cours d'un test de tolérance au glucose par voie orale. Les niveaux d'insuline dans l’état basal et stimulé étaient significativement plus faibles chez les souris KO, sans aucune modification du contenu pancréatique en insuline et du ratio insuline/peptide-C, ceci indique donc qu’il n’y a pas eu d’altération du niveau du métabolisme pancréatique de l'insuline. L’augmentation de l'adiponectine plasmatique chez les souris KO pourrait, entre autres, contribuer à une meilleure sensibilité à l'insuline observée. De plus, dans les groupes traités aux HRP, nous avons observé une amélioration du profil d'expression des gènes des transporteurs de glucose GLUT1 et GLUT4, du TNF-alpha, MCP-1, F4/80 et de la leptine dans le tissu adipeux ce qui pourrait contribuer à la meilleure sensibilité à l'insuline. Comme une meilleure sensibilité à l'insuline a été observée chez la souris suite au blocage pharmacologique et à la suppression génétique du (P)RR, ceci suggère que le (P)RR est impliqué dans la régulation de l’homéostasie du glucose.
De plus, un taux circulant réduit des triglycérides (TG) a été observé chez les souris traitées au HRP, alors que des niveaux inférieurs de TG ont été trouvés seulement dans les
muscles squelettiques chez les souris KO. Ces modifications du métabolisme des lipides et des taux circulants d'adiponectine résultent probablement d'un tissu adipeux plus sain tel que révélé par nos analyses histologiques démontrant une réduction de la taille des adipocytes chez les souris KO et traitées au HRP 3.
Nos résultats démontrent que le (P)RR, en particulier dans le tissu adipeux, est impliqué dans la régulation du poids corporel et de l'homéostasie du glucose probablement par la modulation de la morphologie et de la fonction des adipocytes. Le développement d'une nouvelle stratégie clinique axée sur le blocage du (P)RR pourrait aider à traiter l'obésité et ses pathologies associées telles la résistance à l'insuline et le diabète de type 2.
Mots-clés : Obésité, homéostasie des glucides, tissu adipeux, système rénine-angiotensine, récepteur à la rénine et prorénine, insuline, peptide C, adiponectin, brunissement du tissu adipeux blanc.
Abstract
Obesity is a worldwide epidemic and increases the risk of developing type 2 diabetes and its complications. In obesity, adipose tissue secretes large amounts of hormones and cytokines that negatively regulate glucose and lipid metabolism, causing inflammation and insulin resistance. Obesity also increases the activity of both local (tissue-specific) and circulating renin-angiotensin system (RAS). Angiotensinogen is converted to angiotensin I by renin, whereas prorenin may only do so upon binding to the (pro)renin receptor [(P)RR] 1. This
is thus the angiotensin-dependent (Ang-D) pathway of the (P)RR. The binding of renin and prorenin with the (P)RR also activates an angiotensin-independent pathway (Ang-ND), leading to intracellular signaling involving, for instance, the mitogen activated protein kinase (MAPK), the extracellular regulatory kinase ½ (Erk1/2), the promyelocytic leukemia zinc finger protein (PLZF) and tumor necrosis factor alpha (TNF-a) 1, 2. These can produce cell growth and
proliferation, apoptosis and fibrosis 1, 2, and as such may contribute to tissue damage and
complications associated with obesity. The beneficial effects of pharmacological blockade of the (P)RR include prevention of the development of cardiac and renal fibrosis, as well as of diabetes-associated nephropathy and retinopathy. However, effects of the (P)RR in adipose tissue have been poorly investigated. Hence, our objective was to study the role of the (P)RR in the development of obesity and insulin resistance by: 1) administering HRP (a (P)RR blocker peptide) to mice fed a high-fat diet (HFD), and 2) in knock-out (KO) mice with adipose tissue-specific (P)RR gene deletion, which were generated in our laboratory by cre-loxp technology.
(P)RR gene and protein expression in adipose tissue were increased in mice fed a HFD independently of HRP treatment. HRP treatment also reduced mice body weight and fat masses in HFD-fed mice while they only tended to be lower in mice on normal diet (ND). Similarly, the adipose tissue specific (P)RR KO mice had reduced body weight and fat masses, even on ND, and as such confirmed the involvement of adipose tissue (P)RR in the development of obesity.
The KO phenotype included increased horizontal activity, only in the dark cycle (active period), which would increase energy expenditure and could contribute to their lower body weight and fat mass. Male hemizygous KO mice had higher basal metabolic rate as they had
increased oxygen consumption and carbon dioxide production during both their active and inactive period. This increased basal metabolism may result in part from an increase in thermogenesis as increased “beiging” gene expression, PRDM16, was observed in peri-renal fat of male KO mice. In line with this, recent results from our laboratory have also shown that HRP may induce “beiging” in subcutaneous fat 3.
In mice treated with the HRP, although glycemia was similar to placebo treated mice, plasma insulin and the insulin to glucose ratio were lower compared to untreated groups on both HFD or ND. Similarly, (P)RR KO mice had lower plasma insulin and C-peptide levels compared to controls, without any differences in the glycemia curves during an oral glucose tolerance test. Given that the basal and stimulated insulin levels were significantly lower in KO mice, without any changes in total pancreatic insulin content and with similar insulin to C-peptide ratio, this suggests that pancreatic insulin metabolism was not modified. The increased circulating adiponectin levels observed in KO mice may have contributed to the better insulin sensitivity present in the mice. In the HRP treated mice, we observed an improved gene expression profile of glucose transporters GLUT1 and GLUT4, TNF-alpha, MCP-1, F4/80 and leptin in adipose tissue, which may also contribute to the increased insulin sensitivity. Given that better insulin sensitivity was observed in mice with both (P)RR pharmacological blockade and genetic suppression, this suggests that the (P)RR is involved in the regulation of glucose homeostasis.
In addition, lower circulating triglycerides (TG) levels were found in mice treated with HRP, whereas lower TG levels were observed only in skeletal muscles in (P)RR KO mice. Put altogether, the lower lipid content and higher plasma adiponectin levels likely result from a healthier fat tissue as revealed by histological analysis which showed a reduction in adipocytes size in KO mice and was recently revealed in HRP treated HFD fed mice 3.
Our results demonstrate that the (P)RR, particularly in adipose tissue, is implicated in the regulation of body weight and glucose homeostasis via modulation of adipocytes morphology and function. The development of a new clinical strategy focused on blockade of the (P)RR specifically in adipose tissue could help to treat obesity and its associated pathologies such as insulin resistance and type 2 diabetes.
Keywords : Obesity, glucose homeostasis, adipose tissue, renin-angiotensin system, renin and prorenin receptor, insulin, C-peptide, adiponectin, beiging.
Table des matières
Page №
Résumé ... v
Abstract ... viii
Table des matières... x
Liste des tableaux ... xv
Liste des figures ... xvii
Liste des abréviations ... xix
Acknowledgements ... xxii
Introduction ... 1
CHAPTER I. OBESITY ... 4
1.1. Definition and epidemiology of obesity ... 4
1.2. Risk factors for Obesity and its Pathogenesis ... 5
1.2.1. Risk factors for obesity ... 5
1.2.2. Pathogenesis of obesity ... 6
1.3 Adipogenesis ... 8
1.4 Adipose tissue structure and function ... 10
1.5 ADIPOCYTE CELL SIZE ... 13
1.6 ADIPOSE TISSUE GLUCOSE AND LIPID METABOLISM ... 14
1.7 Adipokines ... 17
1.7.1 Leptin ... 18
1.7.2 Resistin ... 20
1.7.3 Adiponectin ... 21
1.8 Obesity and insulin sensitivity ... 23
1.9 Obesity Management, prevention and treatment ... 24
CHAPTER II. TYPE 2 DIABETES MELLITUS ... 25
2.1 Definition and Epidemiology of type 2 Diabetes Mellitus (T2DM)... 25
2.3 Whole body glucose homeostasis ... 27
2.4 Insulin and iNSULIN RECEPTOR signaling pathway ... 31
2.5 Insulin resistance ... 33
2.6. Role of adipokines in the pathogenesis of T2DM ... 34
2.7. The role of plasma lipids in the pathogenesis of T2DM ... 34
2.8 Complications of T2DM ... 35
2.9 Treatment of T2DM ... 36
CHAPTER III. RENIN-ANGIOTENSIN SYSTEM ... 38
3.1 Definition, classic and modern theories ... 38
3.2 RAS Components... 40
3.2.1 Angiotensinogen ... 40
3.2.2 Renin, Prorenin and their receptor ... 40
3.2.3 Angiotensin peptides and their receptors ... 41
3.2.4 Angiotensin-converting Enzymes ... 43
3.3 Local RAS ... 43
3.4 The local adipose tissue renin-angiotensin system ... 45
3.5 Effects of RAS on adipokines ... 48
3.6 RAS inhibition ... 49
CHAPTER IV. (PRO)RENIN RECEPTOR ... 51
4.1 Structure and function of (P)RR ... 51
4.2 (P)RR substrate binding sites ... 51
4.3 (P)RR pathways ... 52
4.4 (P)RR association with V-ATPase... 55
4.5 (P)RR gene and protein regulation ... 56
4.6 (P)RR pharmacologic blockade ... 56
4.7 (P)RR in health and diseases... 57
4.7.1 Diabetes... 57
4.7.2 Diabetic nephropathy ... 58
4.7.4 Cardiovascular diseases ... 59
4.7.5 Central nervous system disorders ... 60
4.7.6 Gestational disorders ... 62
4.8 (P)RR in obesity ... 62
CHAPTER V. AIM AND HYPOTHESIS OF THE PROJECT ... 64
5.1 Objectives and Hypothesis ... 64
5.1.1 Background ... 64
5.1.2 Hypothesis... 65
5.1.3 Objectives ... 65
CHAPTER VI. ARTICLE 1: IMPACT OF THE PRORENIN/RENIN RECEPTOR ON THE DEVELOPMENT OF OBESITY AND ASSOCIATED CARDIOMETABOLIC RISK FACTORS... 67 Abstract ... 71 Introduction ... 72 Methods... 72 Results ... 74 Discussion ... 78 Acknowledgments... 81 References ... 82
ONLINE SUPPORTING INFORMATION ... 96
Expanded material and methods ... 97
Supplementary Figures ... 102
Supplementary Tables ... 107
References ... 116
CHAPTER VII. ARTICLE 2: ADIPOSE TISSUE (P)RR REGULATES INSULIN SENSITIVITY, FAT MASS AND BODY WEIGHT ... 119
Abstract ... 123
1. Introduction ... 125
2.1. Generation of adipose-tissue specific (P)RR KO mice... 126
2.2. Animals ... 127
2.3. Mouse genotyping ... 127
2.4. Adipose tissue specificity of the KO model ... 127
2.5. Reverse transcription and qPCR gene expression ... 128
2.6. Survival rate and fetal weight ... 128
2.7. Body composition ... 128
2.8. Mouse locomotor activity and indirect calorimetry ... 129
2.9. Oral glucose tolerance test (OGTT) ... 129
2.10. Mouse necropsy and organ collection... 129
2.11. Circulating parameters ... 130
2.12. Tissue TG and glycerol content ... 130
2.13. Total pancreatic insulin content ... 130
2.14. Histology and immunohistochemistry ... 131
2.15. Statistical analysis ... 132
3. Results ... 132
3.1. Validation of AP2-Cre/(P)RR flox KO specificity ... 132
3.2. Male KO mouse survival rate is lower compared to females during development ... 132
3.3. Adult KO mice weigh significantly less than WT mice ... 133
3.4. Adult KO male mice are smaller than WT mice ... 133
3.5. Leaner body composition of adult male KO mice ... 133
3.6. Adult KO mice have lighter fat pad masses than WT mice ... 134
3.7. Adipocytes are smaller in adult male KO mice compared to WT ... 134
3.8. KO mice display greater locomotor activity and metabolic rate ... 134
3.9. Beiging of adipose tissue may occur in KO mice ... 135
3.10. KO mice have improved insulin sensitivity compared to WT ... 135
3.11. KO mice have different circulating adipokine levels compared to WT ... 136
3.12. Adipose tissue specific (P)RR deletion does not affect circulating lipid levels 136 3.13. KO mice have decreased TG content only in skeletal muscles ... 136
4. Discussion ... 137 Acknowledgements. ... 143 References ... 144 Figures... 156 Supplementary Figures ... 163 Supplementary Tables ... 166
CHAPTER VIII. GENERAL DISCUSSION AND CONCLUSION ... 175
8.1 (P)RR is involved in the development of obesity in mice ... 175
8.2 Adipose tissue (P)RR participates in the regulation of lipid metabolism ... 179
8.3 Potential mechanisms implicated in the effects of the (P)RR in the development of obesity ... 180
8.4 Adipose tissue (P)RR is involved in the development of insulin resistance... 181
8.5 Potential mechanisms implicated in the effects of the (P)RR in the development of insulin resistance ... 182
8.6 Limitations of our study ... 184
8.7. CONCLUSION ... 185
8.8 Perspectives... 186
Appendix. List of current publications ... 188
Liste des tableaux
Page №
Table 1. Relationship between Adipocyte cell size and function ... 13
Table 2. Leptin, Resistin and Adiponectin levels in Obesity, T2DM and RAS inhibition ... 18
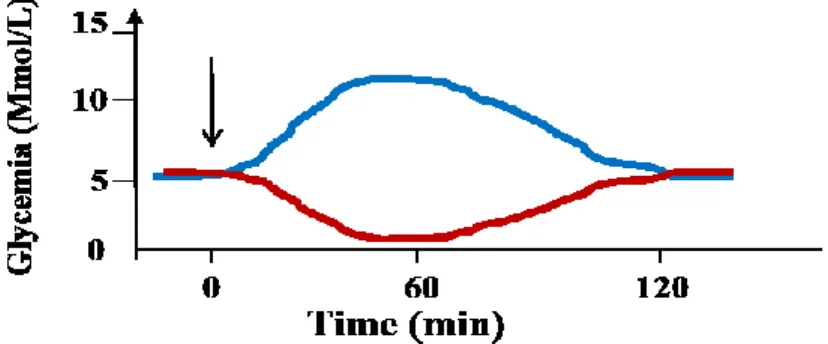
Table 3. Glucose tolerance status according to the glycemia level during an OGTT ... 28
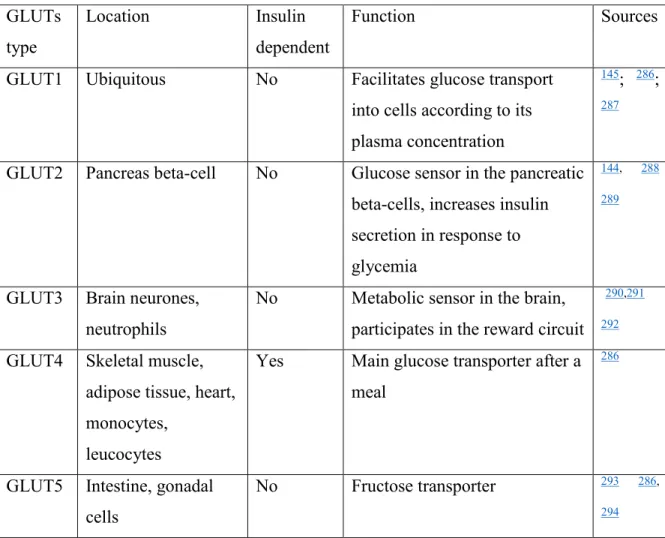
Table 4. Glucose transporters, their tissue location and function. ... 29
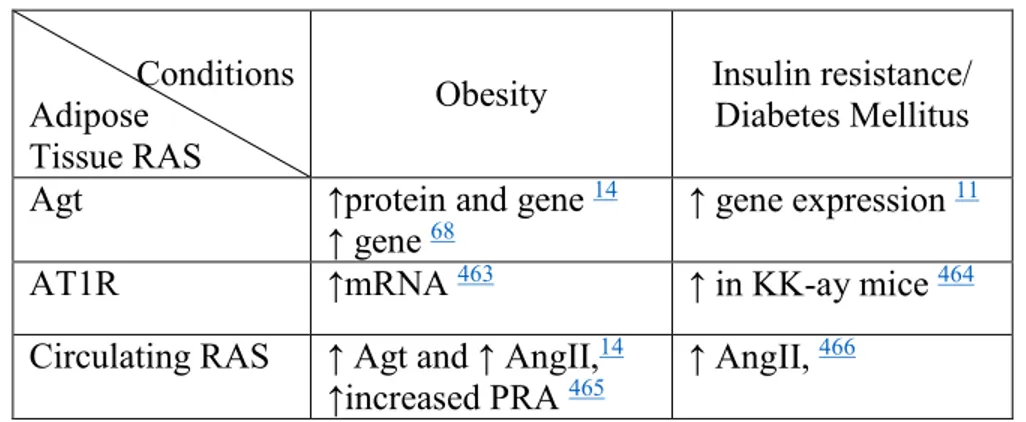
Table 5. Modulation of the RAS by obesity, insulin resistance/Diabetes Mellitus ... 46
Article 1. Table 1. Renin-angiotensin system components mRNA expression in human subcutaneous adipose tissue ... 88
Article 1. Table 2. Effect of the HRP on mouse hepatic and circulating metabolites ... 89
Article 1. Table S1. Primer sequences for mice (m) and human (h) mRNA expression ... 107
Article 1. Table S2. Real Time PCR conditions for mice (m) and human (h) mRNA expression ... 109
Article 1. Table S3. Renin level in adipose tissue compared to the kidney ... 110
Article 1. Table S4. Effect of HF/HC diet on female mice renin mRNA in adipose tissues .. 111
Article 1. Table S5. Female mice body and adipose tissue weight ... 112
Article 1. Table S6. Characteristics in human subjects for the CAO cohort study... 113
Article 1. Table S7. Weekly food consumption ... 114
Article 1. Table S8. Effect of the HRP on left ventricular volume ... 115
Table 2. Effect of adipose tissue (P)RR gene deletion on circulating parameters ... 155
Article 2. Supplementary Table 1. Primer sequences for PCR and qPCR ... 166
Article 2. Supplementary Table 2. Foetal weight in AP2Cre/(P)RRLoxP strain ... 168
Article 2. Supplementary Table 3. Average daily calorie intake ... 169
Article 2. Supplementary Table 4. Adipose tissue (P)RR gene deletion effect on adipocyte size in female mice. ... 170
Article 2. Supplementary Table 5. Effect of adipose tissue (P)RR gene deletion on tissue weight and tibia length ... 171
Article 2. Supplementary Table 6. Vertical distance is not modified by adipose tissue (P)RR gene deletion. ... 172
Article 2. Supplementary Table 7. Effect of adipose tissue (P)RR gene deletion on glucose homeostasis during an OGTT ... 173 Article 2. Supplementary Table 8. Effect of adipose tissue (P)RR gene deletion on tissue metabolites ... 174 Table 6. Comparison between the different RAS KO animals ... 177
Liste des figures
Page №
Figure 1. Development of obesity and related diseases ... 7
Figure 2. Scheme of Adipogenesis.. ... 9
Figure 3. Adipose tissue structure ... 10
Figure 4. Adipose tissue enlargement ... 10
Figure 5. Structure of white and brown adipocytes ... 11
Figure 6. Conventional fat pad collected during the necropsy in the mouse ... 12
Figure 7. Distribution of ingested glucose in the body ... 15
Figure 8. Adipose tissue lipid and glucose metabolism ... 16
Figure 9. Leptin signaling and effects... 19
Figure 10. Adiponectin effects ... 22
Figure 11. Glycemia measured during an OGTT or ITT ... 28
Figure 12. Insulin signaling pathways and crosstalk. ... 31
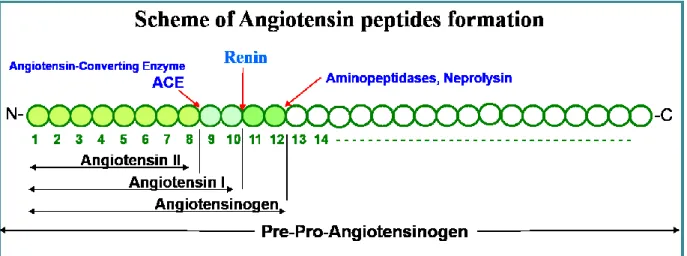
Figure 13. Scheme of angiotensin peptides formation... 38
Figure 14. Renin-Angiotensin system components and general effects ... 39
Figure 15. (P)RR Ang-D and Ang-ND pathways ... 52
Figure 16. Renin Angiotensin system blockers ... 54
Figure 1. Effect of the HRP on mouse (P)RR and renin mRNA and protein in adipose tissues ... 90
Figure 2. Effect of the HRP on mouse body weight, weight gain and adipose tissue weight .. 91
Figure 3. Effect of the HRP on mouse adipokine mRNA in adipose tissues and circulating levels ... 92
Figure 4. Effect of the HRP on mouse inflammation markers mRNA in adipose tissues ... 93
Figure 5. Effect of the HRP on mouse Mest/Peg1 mRNA in adipose tissues ... 94
Figure 6. Effect of the HRP on mouse heart function... 95
Figure S1. (P)RR protein in the heart, liver and kidney is not modified by diet and treatment ... 102
Figure S3. Renin protein in the kidney ... 104
Figure S4. Effect of HF/HC diet on female mice (P)RR protein in adipose tissue ... 105
Figure S5. Effect of the HRP on mouse GLUT1 and GLUT4 mRNA expression in adipose tissues. ... 106
Adipose tissue (P)RR regulates insulin sensitivity, fat mass and body weight ... 121
Figure 1. Adipose tissue (P)RR gene deletion decreases body weight and alters body composition in male mice ... 156
Figure 2. Adipose tissue (P)RR gene deletion decreases fat pad weight in male and female mice on ND and visceral adipocyte size in male mice ... 157
Figure 3. Adipose tissue (P)RR gene deletion increases energy expenditure in male mice ... 159
Figure 4. Adipose tissue (P)RR gene deletion increases a marker of beiging in PRF of male mice ... 160
Figure 5. Adipose tissue (P)RR gene deletion leads to increased insulin sensitivity in male mice ... 161
Figure 6. Summary of the metabolic alterations induced by adipose tissue (P)RR gene deletion ... 162
Supplementary Figure 1. Adipose tissue specific (P)RR gene deletion ... 163
Supplemental Figure 2. (P)RR gene deletion is specific to adipose tissue ... 164
Supplementary Figure 3. (P)RR immunohistochemistry in adipose tissue ... 165
Figure 17. Effects of adipose tissue (P)RR in the development of obesity and insulin resistance ... 185
Liste des abréviations
ACC Acetyl-CoA carboxylase
ACE Angiotensin converting Enzyme
ACEi Angiotensin converting enzyme inhibitor Adipo R1 Adiponectin receptor type 1
Adipo R2 Adiponectin receptor type 2
Agt Angiotensinogen
Akt/PKB Serine/threonine-specific protein kinase, or protein kinase B
AMP Adenosine monophosphate
AMPK AMP activated protein kinase
AngI Angiotensin I
AngII Angiotensin II
Ang-D Angiotensin-dependent Ang-ND Angiotensin-independent ARB Angiotensin II receptor blocker ATP Adenosine triphosphate
AT1R Angiotensin II type 1 receptor AT2R Angiotensin II type 2 receptor ATGL Adipose transglycerol lipase BAT Brown adipose tissue
BW Body weight
CAD Coronary Artery Disease
CamK Ca2+/Calmodulin-dependentprotein kinase C/EBP (CCAAT)-enhancer binding protein
CVD Cardiovascular disease
CREBP cAMP responsible element binding protein DGAT Diglyceride acyltransferase
DM Diabetes Mellitus
FA Fatty acids
FAS Fatty acid synthase
FFA Free Fatty Acids
FOXO1 Forkhead box protein O1 GFP Green fluorescent protein GLUT Glucose transporter
GPCR40 G-protein coupled receptor 40 or FFA receptor 1 G6PD Glucose-6 phosphate dehydrogenase
HFD High-fat diet
HIF Hypoxia induced factor HMW High molecular weight HRP Handle region protein HSL Hormone sensitive lipase
IL Interleukin
IP-ITT Intra-peritoneal insulin tolerance test IRS Insulin receptor substrate
KO Knockout
MAPK Mitogen activated protein kinase
MasR Mas receptor
MCP Monocyte chemoattractant protein
Mest/Peg Mesoderm specific transcript protein/Paternally expressed gene MSC Mesenchymal stem cells
Myf5 Myocyte induced factor 5
NAD Nicotinamide adenine dinucleotide
NADPH Nicotinamide adenine dinucleotide phosphate
ND Normal Diet
NF-kB Nuclear Factor kappa-light-chain enhancer of activated B cells NOS Nitric oxide synthase
NOX NADPH Oxidase
PAI-1 Plasminogen activator inhibitor type 1 PEPK Phosphoenolpyruvate kinase
PGC1-a Peroxisome-proliferator activated receptor gamma coactivator 1-alpha PGF Peri-gonadal fat
PI3K Phosphoinositol-3 kinase
PLZF Promyelocytic leukemia zinc finger
PKC Protein kinase C
POMC Pro-opiomelanocortin
PPAR Peroxisome proliferator activated receptor PRDM16 PR domain containing 16
PRA Plasma renin activity (P)RR (Pro)Renin Receptor RAS Renin-angiotensin system RBP Retinol binding protein ROS Reactive oxygen species
SCF Subcutaneous fat
SH2 Src homology 2 domain
SREBP Sterol Regulatory Element Binding Protein
TG Triglycerides
T2DM Type 2 Diabetes Mellitus
TGF-beta Transforming growth factor beta TNF-a Tumor necrosis factor alpha
TZD Thiazolidinediones
UCP Uncoupling protein
VAT Visceral adipose tissue WAT White adipose tissue WHO World health organisation Wnt Wingless-related integration site
Acknowledgements
First of all, I would like to express my deep gratitude to the owner of the idea of this remarkable study, a pleasant, intelligent, beautiful woman, my supervisor Dr. Julie Lavoie. She is a brave woman who accepted to offer me a position in her laboratory. I am a clinician with a baseline fundamental knowledge and with a language barrier. Dr. Lavoie possesses excellent skills as a researcher and teacher, taught me modern laboratory research methods, to working in the animal facility, helped me in all steps of the project, analysis, interpretation and finally I am here today. Her energy is unbelievable. Although she has a family and children, she always was able to arrange time for us, even on weekends and holidays. Every Christmas she invited us in her house, lead us to meetings and conferences and open us the beautiful Montreal, ancient Quebec City and Gatineau.
I should note the big support and help of my colleagues in the laboratory, Catherine Michel, Paul Tan, Dominique Susanne Genest, Basma Ahmed, Sonia Kajla, Aida Kasaei, Alexandre Garneau, Olga Asaftei and also summer students for their help and for working together as a team in laboratory and animal facility procedures. I also appreciated the help of Pierre Corriveau and Stephanie Gravel from kinesiology department as well as the histology service team at the IRIC. Also thanks to Genevieve Lauzon, Julie Bérubé, Caroline Blais and Laurent Knafo to help me in animal facility and lab security. Let me say thanks to my friends from other laboratories Shangang Zhao, Bouchra Taib, Fernanda, Svetlana Koltsova, Rana El Bikai, Victoria Yureva, Estel Simo, Julien Lamontagne, Susanne Cossette, Andrée Lévesque, Anne Michelle for help with advice in my experiments and writing. I am thanking all students and professors in Angus and in the 8th floor of CR-CHUM for making my days with pleasant salutations and nice conversations during these years. Special thanks for wonderful team of MDRC, for interesting and helpful Meetings and conferences. Also big thanks to all in MDRC platform for help with AlphaLisa analysis and troubleshooting.
I really appreciate Mme Payette and all people from my department Physiology, for their help and support, for their patience and understanding, wise advices.
Thanks to people from Foreign Students Department and FESP for their help and advices in preparation and registration my documents and visa.
I am glad to have been taking an opportunity of attendance of classes, after more years. I am very grateful to all professors in my classes, who thought and brought me a newest information in research.
Big thanks to the members of the attestation committee and exam committee for guide me with helpful questions in discussions, explanations and advice for the future.
This work could not be complete without hard work of Members of the Thesis Committee, a wonderful team of Jurors who will support Thesis with interesting questions and discussion, for valuable advice and recommendations. I really appreciate your time and hard work, for your useful comments and corrections.
I am grateful to my parents, my family, friends, teachers and mentors in my country, for their patience, assistance, support. Despite the distance, I was always with you.
I am very thankful for having a chance to live some years of my life in the best city, Montreal, and study at the famous University in North America and being surrounded with wonderful people who made my days brighter and unforgettable.
Introduction
Obesity and Type 2 Diabetes Mellitus (T2DM) are known to be worldwide pandemics. Statistics show that 33% of adults in the world have obesity or are overweight and 10% suffer from type 2 Diabetes Mellitus (T2DM) (http://www.who.int/mediacentre/factsheets/fs311/en/). However, during the past 30 years obesity levels have doubled and diabetes mellitus has tripled
4, 5. The significant growth of yearly incidents caused by these conditions show a close
relationship with life expectancy and cardiovascular diseases. For instance, recent studies have shown that there is an association between obesity and cancer, depression, mental illness and sleep apnea 6. Moreover, both obesity and T2DM contribute to increased costs for medical care
and social life 4, 7.
Obesity is characterised by an increase in body weight, but more specifically with an increase in fat mass. Adipose tissue is a multifunctional endocrine organ that participates in whole-body lipid and glucose metabolism as well as inflammation, through secretion of hormones and cytokines 8, 9 10. In many epidemiological, clinical and experimental studies,
obesity has been shown to increase the renin-angiotensin system (RAS) activity both systemically and locally in adipose tissue 9, 11-14. Angiotensin II is also well known as a main
player in the development of obesity and insulin resistance, however the molecular mechanisms of this association are not yet clear 9, 11-13,15
Our knowledge of the RAS has also been updated throughout the past decades 15, 16. It
has been shown that its components can act locally in an autocrine or paracrine manner and also at a distance through secretion into the circulation 9, 17. Moreover, fat tissue has been shown to
be a major source of circulating angiotensinogen (Agt) which would explain the increase in circulating RAS activity observed with obesity as it would contribute to increase the production of angiotensin II 9, 11, 18, 19. In addition, angiotensin II has been shown to be essential for the
differentiation and function of adipocytes resulting in an increased production leading to fat mass growth 18, 20, 21. It has also been shown to produce insulin resistance: through the disabling
of GLUT4 translocation in skeletal muscle cells; also by the activation of the extracellular regulatory kinase ½ (Erk1/2) and the phosphorylation of IRS1,2 which prevents further phosphorylation in response to insulin; as well as by inhibition of Akt function by nitration
22-24. Hence, given that hyperglycemia itself can also stimulate the expression of RAS genes in
adipose tissue and liver, a vicious circle is started 25, 26.
Clinical studies using RAS inhibitors such as angiotensin-converting enzyme inhibitors (ACEi) or angiotensin receptor blockers (ARBs) have also confirmed the role of the RAS in the development of the obesity and diabetes 27, as improved insulin sensitivity was reported, which
can prevent diabetes and associated complications 28, 29. It seems that the local RAS in adipose
tissue can play three roles as a candidate in the development of obesity and insulin resistance: First, through the impact of adipocytes differentiation 9, 18, 30, second, through the modulation of
adipokines secretion (increasing inflammatory cytokines such as TNF-alpha, IL6 and leptin, while decreasing adiponectin secretion), and third, through the secretion of angiotensinogen (Agt) into the circulation 9, 11, 31.
The classic angiotensin II formation cascade is initiated by converting angiotensinogen to angiotensin I by renin 15. Then, angiotensin I is converted to angiotensin II by the angiotensin
converting enzyme (ACE). The formed angiotensin II mainly acts through its type 1 receptor (AT1R) and produces vasoconstriction, cell proliferation and differentiation.
Recent studies have shown that renin, as well as prorenin, can bind to a specific receptor - the (Pro)Renin Receptor [(P)RR] which increases renin’s catalytic activity by 4 folds and renders prorenin non-proteolytically active i.e. without cleaving the pro-segment 1, 32, 33. The binding of
renin/prorenin to the (P)RR has been shown to produce both angiotensin-II dependent and independent effects. Angiotensin-dependent effects (Ang-D), relate to the well-known angiotensin II formation cascade of the RAS which is stimulated. As mentioned above, this can impact adipose tissue, insulin resistance, oxidative stress and cell growth and proliferation 34, 35.
Angiotensin-independent effects (Ang-ND) occur through the activation of different signaling pathways, such as the mitogen activated protein kinase (MAPK), the extracellular regulatory kinase 1/2 (Erk1/2), the transforming growth Factor beta (TGF-β) and the promyelocytic leukemia zinc finger (PLZF) pathways which are linked to renin/prorenin binding to the (P)RR
32, 36-39. There are also Ang-ND effects of the (P)RR which are not stimulated by renin/prorenin
binding which have been shown to involve a (P)RR interaction with the V-ATPase 40.
Unexpectedly, Ang-ND effects also impact cell growth, proliferation, apoptosis, and fibrosis 32,
36-38. Hence, it is possible that when RAS inhibitors are used in clinical practice the remaining
particularly given the fact that angiotensin-converting enzymes inhibitors (ACEi) and angiotensin receptor blockers (ARBs) produce an increase in circulating renin 41.
Experimental studies have shown that administration of a (P)RR blocker peptide, or the handle-region peptide (HRP), a part of the pro-segment of the prorenin, can prevent diabetic retinopathy and nephropathy 42, 43, cardiosclerosis 37 and hypertension 36, 37. In that context, the effects of the
(P)RR in adipose tissue and its implication in the development of obesity are of interest but have been poorly studied.
To justify the goal and hypothesis of our studies, this introduction will present the data from the literature regarding obesity, type 2 diabetes mellitus (T2DM) and the renin-angiotensin system (RAS) in separate chapters. In the last chapter the role of the (P)RR and its relationship with different diseases will be discussed.
CHAPTER I. OBESITY
1.1.DEFINITION AND EPIDEMIOLOGY OF OBESITY
Obesity is a medical condition that is a complex disease defined as excessive body weight, specifically in fat mass, which may have negative effects on health and leads to the development of cardiovascular and metabolic complications (Mayo clinic, http://www.mayoclinic.org/diseasesconditions/obesity/basics/definition/con-20014834). Obesity in adults can be determined by using the body mass index (BMI = weight in kg/height in meters squared), where a BMI of 18-25 is defined as normal, 25-30 as overweight and >30 as obese 44, 45. The WHO 2014 statistics found that in developed countries, about 39% of adults
aged 18 and over (38% men and 40% women) were overweight, and 13% of adults (11% men and 13% women) were obese 4 (http://www.who.int/mediacentre/factsheets/fs311/en/). In
Canada, 25% of adults and 10% of children are overweight or obese (http://www.obesitynetwork.ca/obesity-in-canada ).
Obesity increases the risk of developing other disorders such as hypertension, dyslipidemia, insulin resistance, type 2 diabetes mellitus (T2DM): this combination is named “metabolic syndrome” 22, 46, 47. Obesity also increases the risk of developing cancer 48, depression, mental
illnesses 49, 50, sleep apnea 6, 51-53, coronary heart diseases, atherosclerosis, polycystic ovarian
syndrome and other disorders. Obesity increases mortality 4-fold and morbidity 10-fold 6.
Based on the health economic impact, WHO declared obesity as a worldwide epidemic in 2002
4. Obesity has a large economic impact worldwide due to high cost of treatment and also higher
rate of disability and mortality 6, 54. In Canada, the cost for prevention and treatment of obesity
in 2010 was estimated to be $6 billion or 4% of the total Canadian Medicare budget (http://www.obesitynetwork.ca/obesity-in-canada).
1.2. RISK FACTORS FOR OBESITY AND ITS PATHOGENESIS
1.2.1. RISK FACTORS FOR OBESITY
There are a number of factors which have been shown to increase the risk of obesity6, 47.
Nutrition. An excess calorie intake is a main risk factor for obesity. An imbalance between food intake and energy expenditure is important in the development of obesity 55, 56 . Ease of
access to “fast-food” with an imbalanced amount of energy or ingredients, such as high-fat/high-carbohydrate, high salt, and additives (sodium benzoate, sweeteners, colorants, emulsions) used in food industry has been shown to increase the risk of obesity by 2-fold, especially among children and young people 57, 58.
Physical activity. Muscle contraction requires energy expenditure through the oxidation of fat and glucose and also increases heat production by the mitochondrial respiratory chain 59.
Physical inactivity increases the risk of developing obesity by ~30%, while physical activity protects against obesity 59.
Genetics. The family history of an individual also contributes to the risk of developing obesity
60, 61. Maternal or paternal obesity increases the risk of developing obesity by causing
cytoplasmic dysfunction in oocytes, chromatin damage, and by altering the embryo’s gene transcription and translation which can have a powerful impact in more than one generation 60.
During the past decades, scientists have found ~58 loci involved in the development of obesity, where some of them were linked to single nucleotide polymorphisms (SNP) but most with polygenic nucleotide polymorphism (PNP) 62-64
Aging increases the risk of being overweight and obese due to the hormonal and metabolic changes 44, 48, 65-68.
Central nervous system alterations may increase the risk of developing obesity as a result of emotional stress 69, 70. Individuals affected by mental diseases and sleep disorders often develop
obesity 49, 50, 53. Hormones, which are released during emotional stress trigger central
mechanisms of food intake and can control behavior, cause alterations in the neural adaptation of the brain reward circuitry, and by involving the arco-temporal nuclei in the brain 69, 71.
Stomach-brain axis disturbances induced by stress may alter neuronal activity in the hypothalamus, which regulates satiety, mood and eating behavior 72, 73. Patients treated for
anxiety and depression often report weight gain (~20 kg), probably due to side effects on dopamine and serotonin in several brain centers49, 53, 69, 74, 75.
There are other factors, such as environmental and social factors which also can present a risk for obesity, such as a poor income, access to healthy food, hygiene, etc. 76. In some cases,
traditional and family habits may impact food choice and physical activity 4, 53.
1.2.2. Pathogenesis of obesity
The development of Obesity and related diseases. Expansion of adipose tissue is considered to be the first step in the development of obesity, which occurs by structural remodeling and functional abnormalities of adipose tissue 77-79. The first triggering factor can be an excess of
nutrients or energy surplus 80. Enlargement of fat can occur through an increase in adipocyte
number (proliferation/hyperplasia) or their volume (hypertrophy) measured directly by microscopy or through genetic markers of cell size, such as mesoderm-specific transcript (Mest), Paternally expressed gene 1 (Peg) 81-84. The main risk factors in the development of
obesity and related diseases are schematically shown in Figure 1. These factors can be subdivided as follows and will be described below: 1) life style, such as, nutrition and physical activity; 2) genetics, for instance, related to gene abnormalities, genetic diseases and aging; 3) other diseases such as endocrine or central nervous system disorders and 4) particular conditions, such as trauma and physical disability. Interestingly, the known mechanisms of the pathogenesis, such as adipocyte cell growth, differentiation, ischemia, inflammation,
dysfunction and remodelling have been linked with dysregulation of the renin-angiotensin system (Figure 1).
Leptin resistance. The adipocyte derived hormone leptin binds to its specific receptor and functions as a “body size sensor” in the brain, which regulates appetite and food intake 73, 85.
Unfortunately, in obesity, leptin resistance develops as a result of high circulating leptin levels which are produced by the increasing fat mass 68, 86-88. Therefore, appetite and food intake are
increased non-proportionally to body size, and nutrient overconsumption continues. Leptinemia is considered an important step in the development of obesity and is often accompanied by decreased circulating adiponectin level and decreased sensitivity to insulin which increases the risk of developing T2DM 69, 70, 89, 90.
Hypoxia in adipose tissue, via stimulation of the hypoxia induced factor -1 (HIF-1), can induce the expression of genes such as TNF-alpha, interleukins 1 and 6 (IL-1, IL-6), nuclear factor kappa-light-chain enhancer of activated B cells (NF-kB), monocyte attractant protein 1 (MCP-1) and peroxisomes proliferator-activated receptors (PPARs) 9, 78, 91-95. These hypoxia induced
pro-inflammatory factors in turn can change adipose tissue cell integrity through stimulation of the beta integrin, Erk1/2 and MAPK signaling pathways and promote development of obesity and insulin resistance 81.
Inflammation in adipose tissue is considered the next step in the development of obesity 96, 97,
although the exact mechanism is not clear yet. Some authors have shown that low-grade inflammation in adipose tissue results from overfeeding and stimulated by nutrients, especially by lipids, through special cell surface receptors, such as G-protein coupled receptor 40 (GPCR40), that can trigger the gene transcription for growth factors, hormones and cytokines in adipose tissue 27, 68, 80, 96, 98-102. Increasing production of inflammatory cytokines, especially
tumor necrosis factor alpha (TNF-alpha), promotes insulin resistance by affecting insulin signaling pathways via inhibition of insulin receptor substrate 1 (IRS1) and decreasing adiponectin gene expression 55, 103, 104.
Increased local adipose tissue RAS activity is also considered as a main factor for the development of obesity and insulin resistance. Indeed, by promoting adipocyte proliferation and contributing to circulating RAS levels, the local adipose tissue RAS is a main contributor to the development of obesity 9, 11, 20, 30, 105. Increased local adipose tissue production of Ang II
stimulates vasoconstriction, hypoxia, adipogenesis, lipogenesis as well as lipolysis 9, 86, 97, 106. It
also modulates adipose tissue gene expression profile which have both local and systemic impacts on body weight and energy homeostasis 9, 86, 97, 106. Increased Ang II formation also
promotes reactive oxygen species (ROS) formation, and affects insulin signaling by decreasing of Akt/PKB phosphorylation and GLUT4 activity, which leads to insulin resistance 7, 23, 24, 46, 56,
96, 103, 107-109.
1.3 ADIPOGENESIS
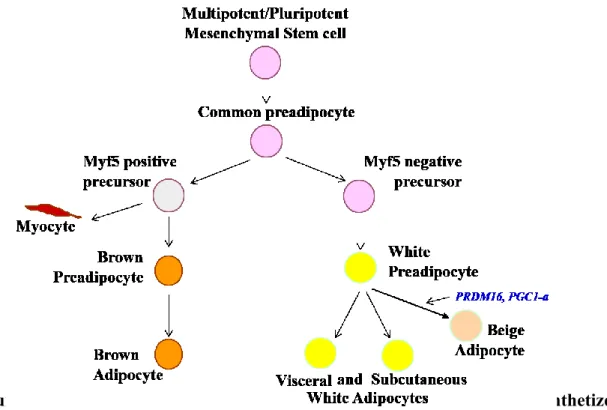
Adipocytes in embryo develops (Figure 2) from pluripotent mesenchymal stem cells (MSC) into common preadipocytes, which is turn are converted into cells with and without myogenic factor 5 (Myf5). Myf5 negative precursor cells are converted to white preadipocytes and then to white adipocytes, both visceral and subcutaneous, whereas Myf5 positive precursor cells gives rise to brown preadipocytes and then to brown adipocytes and myocytes 77, 106, 110-112.
In adults, adipocytes develop from multipotent MSC and also from several precursor cells from the stromal-vascular fraction, from adipocyte progenitor stem cells, and also from bone marrow stromal cells 79, 113, 114, and continue as MSC shown in Figure 2.
The known transcriptional signals for adipocyte differentiation include the transforming growth factor beta (TGF-beta), the insulin-like growth factor 1 (IGF-1), the fibroblasts growth factor 1 (FGF-1), the bone morphogenetic protein (BMP) and activin 77. Transcription factors
such as a CCAAT (cytosine-cytosine-adenosine-adenosine-thymidine) enhancer binding protein (C/EBP) and peroxisome proliferation activating receptor gamma (PPARɣ) are the master regulator gene transcription factors, while the wingless-relates integration site (Wnt) signaling plays an important role in adipocyte differentiation 115.
The study of the gene transcription factors network regulation of adipogenesis showed that differentiation of progenitor cells occurred under the two waves of gene transcription factors
Figure 2. Scheme of Adipogenesis. The different steps of adipogenesis are synthetized in this figure. Cell colour identifies major changes. The text in light blue identifies factors involved in the alternative pathway of the white preadipocyte differentiation.
activation, where the second waves of transcriptional factors can determine the cell type. By studying the role of gene transcriptional network many processes and diseases have been explained. For example, “beiging” of white adipose tissue 92 or the negative relationship
between obesity and osteoporosis due the same precursor cells for adipocytes and osteoblasts
113.
1.4 ADIPOSE TISSUE STRUCTURE AND FUNCTION
Adipose tissue cell types. Adipocytes are the main cells present in adipose tissue and are classified generally as white, brown, and more recently an intermediate phenotype defined as beige adipocytes, which depends on the number of mitochondrion and the gene expression pattern present in those cells 103, 116. Together with mature adipocytes there are (Figure 3)
preadipocytes, T-cells, macrophage, stromal elements and blood vessels within the adipose tissue which constitute the stromal-vascular fraction 117.
Adipose tissue enlargement by cells hyperplasia and/or hypertrophy. Fat enlargement may occur (Figure 4) through proliferation of adipocytes by PPARγ stimulated differentiation of
Figure 3. Adipose tissue structure
multipotent progenitor and precursor cells which increases cell number (hyperplasia) or by increasing the cell volume through increasing adipocyte TG storage in lipid droplet (hypertrophy) 82. Angiotensin II, through inhibition of PPAR-gamma phosphorylation, arrests
adipocyte proliferation and leads to an increase in cell volume 118.
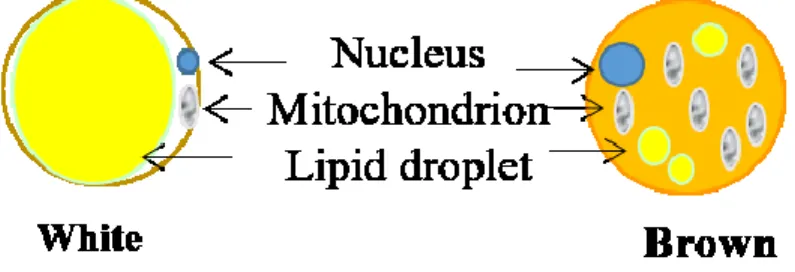
Mature white adipocytes contain (Figure 5) a single large lipid droplet, which occupies ~ 90% of the volume, while the remaining 10% contains the nucleus and organelles. In addition to storing lipids, adipocytes have been shown to produce a number of hormones and cytokines 78,
92, 103, 119.
Brown adipocytes are the main cells responsible for the body’s “heat” production and as such this tissue defends the body from obesity by increasing energy expenditure 92, 116. Brown
adipocytes have the same precursors as myocytes (Figure 2) and differ from white adipocytes (Figure 5) in size, shape, lipid droplets size and number, as well as by the mitochondrial content. Brown adipocytes contain larger numbers of small lipid droplets dispersed in the cytoplasm together with other organelles. They also contain a larger number of mitochondria The activation of fat oxidation in white adipose tissue (WAT) through increasing cyclic AMP or uncoupling protein 1 (UCP-1) gene/protein expression has been shown in mice to prevent obesity 92. Indeed,
altered cellular differentiation to produce a brown-like adipocyte rather than a white adipocyte, a phenomenon called beiging, has been demonstrated by several authors 92.
Beiging is a process where white adipocytes acquire a brown adipocyte specific gene expression pattern, such as PPAR gamma coactivator 1-alpha (PGC-1a) and UCP-1 gene transcription
factors, during differentiation (Figure 2) through the stimulation of the zinc finger transcription factor PRDM16. These white adipocytes become “beige” adipocytes 92.112, 116, 120.
Other cell types present in adipose tissue include macrophages, monocytes, T-cells, endothelial and vascular smooth muscle cells, nervous filaments, and other connective tissue elements, which collectively are named the stromal-vascular fraction 9, 78, 121.
Adipose tissue location. By convention (Figure 6), fat tissue is named according to the location of each fat pad in the body, such as subcutaneous (SCF), peri-gonadal (PGF), peri-renal (PRF) and mesenteric white adipose tissue. The distribution of different fat depot in general in mammals is the same and may differ by localisation and amount. Despite the many similarities between adipocytes from different locations, there are still distinct differences between the adipocytes found in the different fat pads, that may relate to their origin from the different part of the mesenchymal layer during embryonic development 79, 113, 121.
The other differences between the fat depots can be shown in the contents of precursor and stromal-vascular cells. The number of adipocyte precursor cells are highest in visceral adipose tissue (VAT), which may potentially explain why the VAT has been implicated in the development of obesity and insulin resistance 78, 121, 122.
Moreover, there are differences between the fat pads in adipocyte function and metabolic activity 78. In mice, the VAT was shown to be more sensitive to beta adrenergic stimulation, and
as a result, it has increased lipolysis compared to the subcutaneous fat (SCF), and contributes to the development of the metabolic syndrome 123, 124.
Occasionally, ectopic fat is found within the liver, muscles, pancreas, bone marrow, as well as in the peri-vascular and peri-cardiac area 82, 125, 126. Some authors have suggested that
ectopic fat should be considered pathological due to insulin resistance, increased lipolysis, higher levels of reactive oxygen species (ROS) formation and increased RAS activity with higher local and circulating AngII level and also its contribution to the development of local tissue remodelling and fibrosis 127-129.
1.5 ADIPOCYTE CELL SIZE
Fat tissue is unique because of its ability to easily change cell size by increasing or shrinking about 10-fold 81. Adipocyte size changes has been shown to modify their properties and function 81, as shown in Table 1
Table 1. Relationship between Adipocyte cell size and function
Inflammatory cytokines release Normal Increased
Leptin secretion Normal/High Decreased
Adiponectin production and secretion Normal Increased
RAS gene expression, production Normal Increased
Glucose uptake Normal Increased
Fatty acids uptake Normal Increased
Lipolysis, Lipogenesis Normal Increased
TG storage Normal Increased
Insulin sensitivity Normal Decreased
The response to insulin differs in adipocytes according to their size: small adipocytes are more insulin sensitive and although the lipid droplets are smaller their fatty acid uptake is higher than large adipocytes 91, whereas large adipocytes due to insulin resistance have slow glucose uptake
and increased lipolysis and compensatory fat uptake. Some authors proposed that increased volume and excess fat storage in adipocytes viewed as an adaptive mechanism to prevent the toxic effects of hyperlipidemia 93, 121. It has been reported that high levels of expression of an
imprinted gene, the mesoderm-specific transcript/paternal expressed gene 1 (Mest/Peg1), in mice and humans is associated with an increased adipocyte size 84. Surprisingly, the authors
showed that the administration of thiazolidinediones (TZD) also caused fat enlargement, but through stimulation of hyperplasia. The mechanism implicated in this effect is thought to be the activation of the PPAR-ɣ pathway. Interestingly, following this treatment, Mest/Peg1 gene expression was found to be decreased, indicating that this gene is a good marker of adipocyte size independently of adipose tissue mass.
Peroxisome proliferation-activated receptors (PPARs) are nuclear receptors that function as transcription factors. Three forms of PPARs have been observed, alpha (a), beta (β/δ) and gamma (γ), the latter being highly expressed in adipose tissue 130. PPARγ is implicated in
adipocytes differentiation and development, and as such, it can prevent an increase in adipocyte cell size i.e. hypertrophy 110. PPARγ and its agonists were shown to have beneficial effects in
adipose tissue on adipokine and inflammatory cytokine secretion which produces a reduction in inflammation and a better sensitivity to insulin 131.
1.6 ADIPOSE TISSUE GLUCOSE AND LIPID METABOLISM
As was mentioned before, adipose tissue is a buffer for excess body glucose. Fat storing cells are found in protozoa and worms such as C. Elegans indicating their important role in evolution for whole body metabolism 79. Ingested glucose enters the blood and increases plasma glucose.
It is then distributed to tissues as shown on Figure 7 where about 29% of glucose is distributed to the liver and gastrointestinal system, 26% to skeletal muscles, 23% to the brain, 7% to the kidneys and about 3% to adipose tissue 132. Adipose tissue acts as a buffer, mainly during the
postprandial period (after a meal) to absorb the excess amount of fat and carbohydrates from the blood and protect cells from the harmful effects of simultaneous high levels of glucose and lipids, known as glucolipotoxicity 22, 89, 133-141. A good example of a defect in adipose tissue
function is lipodystrophy, which features insulin resistance and ectopic fat accumulation, despite
the extremely low fat mass and lower body weight 94, 142.
Glucose transporters. Glucose enters adipocytes (Figure 8) via the facilitated transporter GLUT1 in basal (fasting) state and via GLUT4 after a meal 81, 143-145. Most of the glucose that
enters the adipocytes is stored as triglycerides (TG) in lipid droplets. In obesity, translocation of GLUT4 to the adipocyte cell surface is impaired and glucose uptake is inhibited 143, 146, 147. This
delays glucose elimination from the blood after a meal and affects whole-body glucose Figure 7. Distribution of ingested glucose in the body. % of glucose absorbed by each tissue following glucose ingestion is indicated. The type of glucose transporter present in each tissue is indicated. In response to the increased plasma glucose, the pancreas secretes insulin (red) to facilitate absorption of glucose by certain tissues.
homeostasis. Measures used for the treatment of obesity and type 2 diabetes mellitus (exercise, metformin, TZD) act via increasing the activity of GLUT4 148-150.
Fatty acid transporters. Fatty acids can enter into adipocytes (Figure 8) by binding with the tissue-specific “fatty acid transport protein” – FATP (in adipose tissue, type 1 – FATP1) and may also enter adipocytes via the scavenger receptor (fatty acid translocase FAT/CD36), located on the cell surface 147, 151, 152.
Fatty acid binding proteins (FABP) is another class of specific fatty acid transporters 152.
The FABP4/AP2 is a specific adipose tissue protein 152 which binds lipophilic substances, such
as hormones and vitamins, which are transported from the outer side into the cell compartment
153. FABP4 regulates lipid metabolism by modulating lipase activity and regulating adipocyte
Figure 8. Adipose tissue lipid and glucose metabolism. This figures shows lipid (purple) and glucose (green) metabolism. In blue is shown the effect of angiotensin II on these 2 pathways. ACC, Acetyl-CoA co-carboxylase; TG, triglycerides; FFA, free fatty acids; ATGL, adipose triglyceride lipase; HSL, hormone sensitive lipase; FAS, fatty acid synthase; DGAT, di- and MGAT, mono-glycerol acyltransferase; AMPK, AMP kinase
differentiation as it attenuates the Janus kinase 2 (JAK2) and phosphatase and tensin homolog (PTEN) signaling stimulated by leptin 152-154. In one study authors found that RAS inhibition by
the ARB candesartan produced a ~ 20% decrease in the serum level of FABP4 and as such, ARBs were proposed as a method for suppression of cardiovascular events in hypertensive subjects 155. These authors also found a relationship between increased FABP4 level and
obesity, hypertension and cardiovascular events.
Adipocyte lipid uptake and synthesis is controlled by insulin, pyruvate dehydrogenase and acetyl Coenzyme-A (acetyl-CoA) in the case of lipid synthesis, and is also regulated by the sterol regulatory element binding protein 1 (SREBP1), a transcription factor for lipolytic enzyme gene expression156, 157.
Lipid synthesis and lipolysis in adipocytes. As shown in Figure 8, when glucose, enters the adipocyte, it may be converted to acetyl-CoA and then be either oxidised or be involved in fat synthesis. The enzyme acetyl-CoA cocarboxylase (ACC) stimulates the synthesis of malonyl-CoA from acetyl-malonyl-CoA for further fatty acid synthesis and adipocyte hypertrophy 82, 89, 158. On
the other hand, lipoprotein lipases remove fatty acids from chylomicrons, low density lipoprotein (LDL) and very low density lipoprotein (VLDL) in plasma and mobilize them into lipid droplets for TG synthesis and storing 150, 159, 160. Adipocytes lipid droplet TG synthesis is
sequentially carried out by mono- and di-glycerol-acyl-transferases (MGAT, DGAT). Fatty acid (FA) release is stimulated by lipases, such as the acyl-triglyceride lipase (ATGL) and the hormone sensitive lipase (HSL), which are responsible for about 95% of total TG hydrolysis in adipocytes (Figure 8) 161. More specifically, FA and glycerol can be released from adipocytes
by FAT or FABP, shown above, during fasting or exercising following the activation of the HSL by beta-adrenoreceptors 159, 162. Lipogenic and lipolytic enzymes are key regulators in VAT as
they are involved in increasing adipocyte cell size/volume (hypertrophy) by enlargement of the lipid droplet(s) 122, 138.
Adipose tissue as an endocrine organ, as it secretes hormones (adipokines) and inflammatory cytokines 9, 103, 163. There are more than 20 hormones and about 20 cytokines that have been
shown to be produced by adipocytes 163. Expression and secretion of most adipokines are altered
by obesity 46, 164, 165. Leptin, adiponectin and resistin are the most studied adipokines. Their level
in the circulation are regulated by different parameters such as insulin sensitivity, inflammatory status, obesity and Type 2 Diabetes Mellitus (T2DM) 46, 103, 166-168.
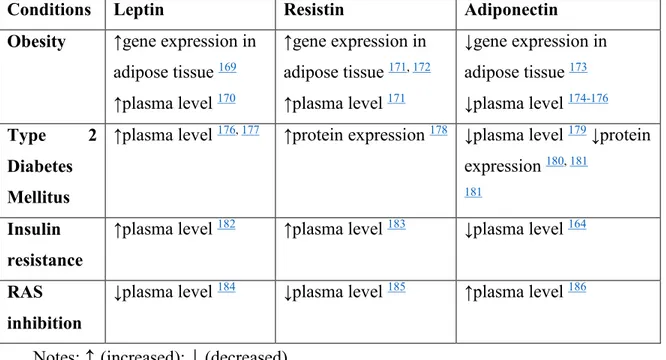
Table 2. Leptin, Resistin and Adiponectin levels in Obesity, T2DM and RAS inhibition
Notes:
↑
(increased);↓
(decreased)Adiponectin effects promote better insulin sensitivity, whereas leptin and resistin lead to insulin resistance. Data from the literature about changes in leptin, resistin and adiponectin levels in obesity, insulin resistance and T2DM are presented in Table 2.
1.7.1 Leptin
Leptin is the first discovered adipose tissue derived hormone. It is secreted by mature adipocytes, mainly in white adipose tissue 86, 87, 103. It was also found to be secreted by other
Conditions Leptin Resistin Adiponectin
Obesity ↑gene expression in adipose tissue 169 ↑plasma level 170 ↑gene expression in adipose tissue 171, 172 ↑plasma level 171 ↓gene expression in adipose tissue 173 ↓plasma level 174-176 Type 2 Diabetes Mellitus
↑plasma level 176, 177 ↑protein expression 178 ↓plasma level 179 ↓protein
expression 180, 181 181
Insulin resistance
↑plasma level 182 ↑plasma level 183 ↓plasma level 164
RAS inhibition
tissues, including bone marrow, mammary glands, pituitary gland, ovaries, skeletal muscle and gastric chief cells 79, 81, 103, 163. Leptin synthesis is stimulated by dexamethasone, insulin,
emotional stress, and decreased by exercise, fasting and sleep 187, 188.
Effects of leptin. Leptin targets the hypothalamus (Figure 9), where it binds to its specific receptor 87, 189. Leptin acts as a brain sensor to protect the body from both excess and very small
fat content 142. Leptin decreases appetite by regulating the secretion of neuropeptide Y (NP-Y),
melanocortin and Agouti-related peptide (AgRP) in the arcuate nucleus 190, 191. It also negatively
impacts locomotor activity during food restriction and fasting whereas it increases locomotor activity in a fed state 71, 182, 192, 193.
Leptin and obesity. Leptin gene expression and its plasma level are increased with obesity in humans and rodents fed a HFD 55, 80, 163. Obesity is often accompanied by hyperleptinemia which
eventually leads to leptin resistance 87. About 3% of all cases of obesity are due to genetic
mutation of the gene for leptin (ob/ob) or its receptor (db/db) 87, 194, 195. The role of leptin and its
receptor in the development of obesity have been studied using ob/ob and db/db mouse models, Figure 9. Leptin signaling and effects. Leptin signaling (black text) and effects (blue boxes) are shown on this figure. Elements which contribute to the stimulation (orange box) or inhibition (pink box) of leptin production are also presented.
respectively 194. Ob/ob mice are obese and insulin resistant. In this model, leptin replacement
(infusion) decreases appetite, body weight and fat masses as well as improves insulin sensitivity
196. The db/db mice have a more severe obese phenotype with the presence of fasting
hyperglycemia, hyperlipidemia and hyperinsulinemia as well as diabetes 197. Moreover, leptin
has been shown to impair lipid and carbohydrate metabolism, leading to insulin resistance 87, 195,
198 although its effects on glucose homeostasis are complex and not yet fully understood.
1.7.2 Resistin
Resistin is another adipose tissue hormone for which plasma levels are increased with insulin resistance and inflammation 103, 167, 176. In humans, it is also secreted by monocytes and the
placenta, while in mice, resistin is exclusively secreted by adipocytes and the placenta 167, 172.
Resistin is synthesized in response to inflammation, hypoxia, and bacterial endotoxins, whereas thiazolidinediones (TZD) decreases its production. Interestingly, plasma leptin and resistin levels are decreased by RAS inhibition 185, 199. For instance, administration of ACE inhibitors,
such as perindopril and enalapril, in people with coronary artery disease improves insulin sensitivity 185.
Molecular mechanisms of action are not yet clear. In humans, resistin is proposed to bind with a specific cell surface receptor, the adenylate cyclase binding protein type 1 (CAP-1), which has not been confirmed in mouse studies 200. Resistin binding to CAP-1 in monocytes leads to
increasing cAMP level in the cytoplasm and activates PKA and NFk-β, which trigger inflammatory protein gene transcription 201. By stimulating pro-inflammatory factor gene
transcription and expression, resistin contributes to the development of insulin resistance.
Effects of resistin. A positive correlation has been found between circulating resistin level and conditions such as insulin resistance and coronary heart disease. This has been proposed to be through the action of resistin on NFkB, Toll-like receptor 4 (TLR4), eNOS, and p38MAPK pathways 167, 172. Conversely, resistin was not changed in adipose tissue and plasma from