Continental Shelf Research 216 (2021) 104360
Available online 1 February 2021
0278-4343/© 2021 Elsevier Ltd. All rights reserved.
Drivers of the variability of dimethylsulfonioproprionate (DMSP) and
dimethylsulfoxide (DMSO) in the Southern North Sea
C. Royer
a,b,*, A.V. Borges
b, J. Lapeyra Martin
a, N. Gypens
aaLaboratoire d’Ecologie des Syst`emes Aquatiques, Universit´e Libre de Bruxelles, CP221, Boulevard du Triomphe, Brussels, 1050, Belgium bUnit´e d’Oc´eanographie Chimique, Institut de Physique (B5A), Universit´e de Li`ege, Li`ege, 4000, Belgium
A R T I C L E I N F O Keywords:
Dimethylsulfoniopropionate Dimethylsulfoxide Phytoplankton diversity Southern North Sea
A B S T R A C T
The influence of abiotic and biotic factors on the concentration of dimethylsulfoniopropionate (DMSP) and dimethylsulfoxide (DMSO) was investigated and compared during two annual cycles in 2016 and 2018 in the Belgian coastal zone (BCZ) in the southern North Sea at five fixed stations. These stations covered a near-offshore gradient from stations close to the mouth of the Scheldt estuary to most offshore stations. Significant differences of Chlorophyll-a (Chl-a) concentrations were observed between the two years with higher values in early spring 2018 (due to better light and nutrient conditions coupled to colder temperatures) and in summer 2018 (due to warmer conditions) compared to 2016. Nevertheless, the seasonal and spatial DMSP and DMSO (DMS(P,O)) patterns, as well as the yearly average were nearly identical in 2016 and 2018. This can be explained by the fact that the phytoplankton groups responsible for the large differences in Chl-a in 2018 and 2016 were low DMSP- producers characterized by several diatom and dinoflagellate species, occurring in early spring and summer. Further, the Prymnesiophyceae Phaeocystis globosa, occurring in late spring and responsible of most of DMS(P,O) measured in the area, reached similar biomass both years. The DMSP:Chl-a ratio obtained from the field mea-surements were similar to those previously published for the main observed phytoplankton groups, but more differences were observed for the DMSO:Chl-a ratio. DMS(P,O) estimations based on Chl-a linear regressions for the whole dataset need to account on two relationships discriminating the low and high-DMSP producing species.
1. Introduction
Dimethylsulfoniopropionate (DMSP; (CH3)2S+CH2CH2COO-) and
dimethylsulfoxide (DMSO; (CH3)2SO) are organic sulfur compounds
produced by numerous species of marine micro-algae. DMSP is the main precursor of the climate active gas dimethylsulfide (DMS) that once in the atmosphere might affect the Earth’s radiative budget (Charlson et al., 1987; Quinn and Bates, 2011). Prymnesiophyceae and Dinophy-ceae are high-DMSP producers, and the low-DMSP producers include some members of Chrysophyceae and diatoms (Keller et al., 1989;
McParland and Levine, 2019). The intracellular physiological functions of DMS(P,O) are still poorly understood. DMSP might play roles such as antioxidant (Sunda et al., 2002), cryoprotector, osmolyte (Kirst et al., 1991; Bucciarelli and Sunda, 2003), methyl donor (Kirst, 1996), zooplankton deterrent (Wolfe et al., 1997; Strom et al., 2003), or signaling compound (Stefels, 2000; Seymour et al., 2010). DMSO could be involved in a complex cascade reaction in the antioxidant system alongside with DMS and acrylate (Sunda et al., 2002). The DMS(P,O)
production by marine micro-algae varies considerably depending on the growth stage, salinity, temperature, nutrient availability, and light in-tensity. Seawater phytoplankton diversity is the factor that affects the most DMSP production (Townsend and Keller, 1996; Stefels et al., 2007). Phytoplankton composition and its seasonal succession might depend on the seasonal change in day length (Litchman and Klausmeier, 2001), although water temperature has been found to be the most sig-nificant factor affecting the phytoplankton community structure in some parts of the globe (Suikkanen et al., 2007). Changes in temperature will affect the growth-irradiance relationship (Edwards et al., 2016) and the competitive dominance of algal communities (Striebel et al., 2016) which is a key factor for the species’ composition (Schabhüttl et al., 2013). In deeper pelagic systems, the influence of increasing tempera-ture on thermal stratification induces an increase in light availability that is usually the phytoplankton bloom trigger (Wiltshire et al., 2008;
Sommer et al., 2012). In well-mixed coastal waters, stratification rarely plays a role, and the amount of light will be the limiting factor rather than the nutrients concentration (Wiltshire et al., 2008). The spring * Corresponding author. Laboratoire d’Ecologie des Syst`emes Aquatiques, Universit´e Libre de Bruxelles, CP221, Boulevard du Triomphe, Brussels, 1050, Belgium.
E-mail address: croyer@ulb.ac.be (C. Royer).
Contents lists available at ScienceDirect
Continental Shelf Research
journal homepage: http://www.elsevier.com/locate/csrhttps://doi.org/10.1016/j.csr.2021.104360
phytoplankton seasonal succession will also depend on the Sea Surface Temperature (SST) during winter influencing the overwintering zooplankton and its grazing pressure (Sommer and Lewandowska, 2011).
SST has increased in the North Sea since the 1980s affecting the physiology, abundance, and phenology of marine phytoplankton (Richardson and Schoeman, 2004; Hunter-Cevera et al., 2016; Barton et al., 2018). In addition, high anthropogenic loads of inorganic nutri-ents (nitrogen and phosphorus) led to important phytoplankton blooms and biomass in most coastal zones between March and October (Desmit et al., 2019). In the Southern North Sea, the Belgian Coastal Zone (BCZ) is a eutrophic and well-mixed area under the influence of the Scheldt and the Rhine rivers. It is characterized by a very high phytoplankton biomass and three phytoplankton blooms: (1) the first occurs in late February–March with diatoms, (2) directly followed by a huge biomass peak of Phaeocystis globosa in April–May, and (3) another diatom bloom at the end of summer-beginning of autumn (Rousseau et al., 2002). This phytoplankton taxonomic succession was very constant from 1988 to 2000 despite the variability in salinity, temperature, and light (Rousseau et al., 2002). The onset of the diatom spring bloom in the BCZ is dependent on a specific light threshold. Furthermore, the adaptation to low irradiance and temperature prevailing in late winter-early spring coupled with high nutrient concentrations explains the first diatom bloom, followed by Phaeocystis globosa when the ambient dissolved sil-icate is depleted (Rousseau et al., 2002). Phaeocystis globosa blooms are responsible for 95% of the phytoplankton late spring community biomass (Rousseau et al., 1990, 2000). Yet, since 1990, de-eutrophication measures have led to the decrease of nutrient con-centrations in coastal waters of the Southern North Sea (van Beusekom et al., 2009; Prins et al., 2012). Both the warming and the de-eutrophication trends may have an impact on the long-term annual mean of Chl-a (Desmit et al., 2019) and the phytoplankton community (Nohe et al., 2020). This should also affect the DMS(P,O) concentrations,
since they strongly depend on phytoplankton composition and biomass, as shown by a modelling study in the area (Gypens et al., 2014). A better understanding of the intracellular DMS(P,O) concentration in response to external drivers or phytoplankton diversity could improve their pre-diction, and ultimately the related DMS emissions with its potential climate effect (Charlson et al., 1987).
This study presents an interannual comparison of DMS(P,O) con-centrations measured in the BCZ in 2016 and 2018 on a regular grid of 5 fixed stations. The year-to-year variation was analyzed in light of nutrient concentrations, SST, and light availability; the key factors influencing the phytoplankton production and community structure in general and in the study area (Nohe et al., 2020). The phytoplankton composition was studied for both years to investigate the possible var-iations on species dominance and biomass, and corresponding impact on the DMS(P,O) content.
2. Material and methods 2.1. Field sampling
Sampling was carried out on the RV Simon Stevin in 2016 and 2018 at 5 fixed stations chosen to cover a near-offshore gradient from station 700 (close to the Scheldt estuary) to the most marine station (ZG02) covering a major part of the BCZ (Fig. 1). The data from 2016 were published in Speeckaert et al. (2018). The samples were collected each month through the year and twice a month between March and May during the spring phytoplanktonic bloom. Seawater samples were collected at 3 m depth using 4L Niskin bottles on a rosette sampler attached to a Conductivity-Temperature-Depth (CTD) probe (Seabird SBE25), for further analysis of Chl-a, DMS(P,O) concentrations and DNA extraction. The abiotic measurements at 3 m depth of SST, sea-surface salinity (SSS), suspended particulate matter (SPM), and nutrients con-centrations were carried out by the Vlaams Instituut voor de Zee (VLIZ)
in the frame of the LifeWatch sampling campaigns (http://rshiny.lifewa tch.be/Station%20data/) (Flanders Marine Institute, 2019) with the methodology found in Mortelmans et al. (2019). The daily global solar radiation data was collected at the Oostende station of the Royal Meteorological Institute of Belgium and allowed us to calculate the surface incident PAR.
2.2. Chlorophyll-a
A determined volume of the seawater collected was filtered on Whatman glass microfiber filters GF/F 25 mm. The filters were imme-diately frozen and stored at -20 ◦C until analysis (within 1 month after
sampling). Chl-a (μg L-1) was then extracted at 4 ◦C in 90% acetone (v:v)
and measured fluorometrically using a Kontron Instruments SFM 25 (Strickland and Parsons, 1972).
2.3. Phytoplankton diversity
In 2016 and 2018, samples from station 330 were fixed with lugol- gluteraldehyde (1% v:v) and stored at 4 ◦C for species identification
and cell density measurements by using inverted microscope. The sta-tion 330 is representative of the area (Rousseau et al., 2002). In 2018, DNA was sampled from March to December for the five stations. The DNA was collected by filtering seawater on 0.2 μm 47 mm polycarbonate
Durapore filters (Tynes, 2013). The filter was preserved at -80 ◦C. DNA
was extracted using DNeasy Plant Qiagen following manufacturer’s protocol and libraries were prepared. 18S rDNA amplicon sequencing was performed using Illumina MiSeq sequencer which produced 2x300 bp paired-end sequences. Decomplexed sequences were analyzed using R software package phyloseq (McMurdie and Holmes, 2013) and the taxonomic annotation database used was Silva 1.32. The phytoplankton diversity was investigated based on several assumptions: (1) non-autotrophic kingdoms were removed; (2) as well as the unclassified genera by Silva; (3) Operational Taxonomic Units (OTUs) with same taxonomic annotations were merged; (4) singletons and genera not seen more than 3 times in at least 10% of the samples were eliminated; (5) the 50 most abundant genera were chosen to analyze the phytoplankton diversity over time.
The DMS(P,O):Chl-a ratio were recalculated from published data
(Tables 1 and 2; Keller et al., 1989b; Townsend and Keller, 1996; Sim´o et al., 1998; Hatton and Wilson, 2007; Bucciarelli et al., 2013; Cooney, 2016; Cooney et al., 2019; Speeckaert et al., 2018; 2019; McParland and Levine, 2019; Royer et al. in review). The carbon per cell was calculated from cell volumes found in the literature or with the median cell vol-umes from Olenina (2006), and according to the formula given by
Menden-Deuer and Lessard (2000). The biomass was converted to Chl-a per cell assuming the C:Chl-a ratio of 60 g g-1 (Geider, 1987). 2.4. DMS(P, O) analysis
The 60 mL borosilicate glass vials were acid-washed (HCl 10%) and rinsed with high purity water obtained from a milli-Q system. The vials were covered with aluminum foil and baked at 350 ◦C for at least 1h in a
muffle furnace before the sampling (Kiene and Gerard, 1994). The 25 mm Whatman glass microfiber filters GF/F were baked at 450 ◦C for 4h
(Kiene and Slezak, 2006). Intracellular DMS(P,O) (DMS(P,O)p) were
obtained by the difference between 10 mL of unfiltered seawater sam-ples (total DMS(P,O) (DMS(P,O)t)) and dissolved DMS(P,O) (DMS(P,
O)d). DMS(P,O)d was obtained by gentle filtration of 15 mL and only the
first 10 mL filtrate was collected to avoid cell destruction at the end of the filtration that could release DMSP (Kiene and Slezak, 2006). All the samples were microwaved individually at 900 W till boiling (~15sec) (Kinsey and Kieber, 2016) and then acidified with 5 μL mL-1 of 50%
H2SO4 (Del Valle et al., 2011). The acid stopped the biological activity
and preserved the DMSP (Curran et al., 1998). The acidification may produce rapid conversion of DMSP to DMS and presumably acrylate, inducing substantial losses of DMSP (Del Valle et al., 2011). But Kinsey and Kieber (2016) have recently observed that microwaving samples to boiling point are an alternative method for sample preservation prior to the addition of acid. The samples were crimped after cooling with gas-tight PFTE coated silicone septa and stored 24 h at dark before the refrigerator to allow the DMS to degas or oxidize (Kiene and Slezak, 2006).
The samples were sparged to remove the potential DMS left for 20 min. 5 mL of 12 M NaOH were added to the 10 mL samples to obtain a pH > 12 and quantitatively cleave DMSP into DMS for 24h (Dacey and Blough, 1987; Stefels, 2009). An Agilent 7890B gas chromatography with a purge and cryogenic trap system (Agilent column 30 m long, 0.32 Table 1
Ratio of particulate dimethylsulfonioproprionate (DMSPp) to Chlorophyll-a (Chl-a) concentration (DMSPp:Chl-a) (mmol:g), cell biovolume (μm3), cell carbon (C) content (pgC cell-1) compiled from published literature for species found in the Belgian coastal zone (Fig. 1).
Class Genus Species Biovolume
(μm3) C (pgC cell -
1) Chl-a (pgChl-a cell -
1) DMSPp (fmol cell -
1) DMSPg) p:Chl-a (mmol: Data from
Diatom Rhizosolenia R. setigra 69080.0 7561.5 126.0 112.5 0.9 1
Diatom Guinardia G. delicatula 58139.0 2105.6 35.1 1.9 2
Diatom Thalassiosira T. rotula 15072.0 704.5 11.7 1.9 5.4 ± 7.3 1, 2
Diatom Thalassiosira Thalassiosira sp. 13713.0 652.5 10.9 40.8 3.2 ± 0.8 1, 2
Diatom Thalassiosira T. pseudonana 80.1 10.1 4.8 3
Diatom Rhizosolenia Rhizosolenia sp. 69080.0 2421.6 40.4 112.5 2.8 1
Diatom Pseudo-
Nitzschia Pseudo-Nitzschia sp. 120.0 14.0 0.2 0.2 0.9 1
Average ± s.d. : 3.2 ± 3.1
Dinoflagellates Heterocapsa H. rotundata 234.0 66.3 1.1 20.8 18.7 ± 0.9 4, 5
Dinoflagellates Gyrodinium G. aureolum 5007.6 814.3 13.6 5.3 0.4 1
Dinoflagellates Katodinium Katodinium sp. 1439.0 293.3 4.9 201.2 41.2 6
Dinoflagellates Karlodinium K. veneficum 739.0 106.7 1.8 7.0 3.9 1
Dinoflagellates Gymnodinium G. simplex 265.0 73.4 1.2 238.5 195.1 1
Dinoflagellates Tripos T. fusus 19500.0 2479.4 41.3 2.8 0.1 7
Average ± s.d. : 37.1 ± 65.3
Prymnesiophyceae Phaeocystis P. globosa 75.0 12.4 0.2 16.3 82.3 ± 11.5 3, 2 ,8
Prymnesiophyceae Phaeocystis Phaeocystis sp. 46.6 8.0 59.0 1
Average ± s.d. : 76.5 ± 15.0
1 McParland and Levine (2019); 2 Speeckaert et al. (2018); 3 Royer et al. (in review); 4 Cooney et al. (2019); 5 Cooney (2016); 6 Townsend and Keller (1996); 7 Keller et al. (1989)b; 8 Speeckaert et al. (2019).
mm internal diameter, 0.25 μm film thickness) was applied to analyze
the DMS released. The GC was equipped with sulfur selective Flame Photometric Detector (FPD) and the carrier gas was He (2 ml min-1). The
FPD was kept at 350 ◦C with a H
2 flow of 72 ml min-1, a synthetic air
flow of 72 ml min-1 and a makeup (N2) flow of 20 ml min-1. The capillary
column was kept at 60 ◦C. DMS was quantitatively purged from the vial
by the He flow carried through a long stainless-steel needle inserted through the septum into the liquid phase and during 20 min. The DMS flew through two Dewar maintained cold around -30 ◦C with liquid
nitrogen to trap residual water vapor (Andreae and Barnard, 1984). The DMS is then trapped in a PFTE loop immersed in liquid nitrogen (-196 ◦C). At the end of the purge, the loop was transferred in boiling
water and the DMS is injected in the GC.
For the DMSO analysis, 5 mL HCl 37% (HCl 37% Normapur, VWR) and 1 mL TiCl3 (30%, Merck) (Kiene and Gerard, 1994; Deschaseaux
et al., 2014) were added into the precedent vial yet analyzed. Even if we consider the reaction efficiency < 100%, it will not interfere with the analysis since the system is calibrated against DMSO standards, assuming the same reduction efficiency for both standards and samples (Champenois and Borges, 2019). After 48 h at room temperature, 3 mL of 12 M NaOH were added to avoid injecting acid fumes into the GC (Kiene and Gerard, 1994). The DMS produced from the reduction of DMSO was analyzed as described previously. The DMS(P,O) quantified in arrow in the same sample was validated by Champenois and Borges (2019). The same procedure was applied for the calibration. The DMSP used was obtained from Research Plus and the DMSO from 99.9% pure stock solution (Merck). Working solutions were prepared with the suc-cessive dilution in MilliQ water but DMSP and DMSO were diluted in the same vial. Calibration curves were made weekly to ensure the GC sta-bility for the detector by fitting a quadratic curve for the FPD. The average precision was 5 and 8% for DMSP and DMSO calibration, respectively. Any leaks during the analysis were detected by using a Thermo Scientific GLD Pro Gas Leak Detector every day.
2.5. Statistical analysis
The statistical comparison of the variables between the two years was performed using the parametric paired-samples Student t-test. The assumption of normality was checked using the Shapiro-Wilk test and the Q-Q plot. In case of deviation of the normality (p < 0.05), the Wil-coxon t-test was applied. To investigate the correlation between the variables, the Pearson’s r coefficient and its p value was used. In case of deviation of normality by the Shapiro-Wilk test (p < 0.05) and the Q-Q plot, the non-parametric Spearman’s ρ coefficient was applied.
The Kaiser-Meyer-Olkin index (> 0.50) and Bartlett sphericity test (p < 0.05) were used to ensure the application of Principal Component Analysis (PCA) for which we assumed the application of an Oblimin
rotation. The principal components (PCs) have to explain at least 50% of the total percentage of variance between all the variables. The loading component (LC) explaining the correlation between the PC and the variable was considered significant when ≥ ±0.60. These statistics were realized using the IBM SPSS Statistics software (version 23.0.0.0) and the assumptions were based on Goss-Sampson (2018).
3. Results and discussion
The years 2016 and 2018 were characterized by the typical phyto-plankton succession for the area (Rousseau et al., 2002) with an early spring diatom bloom followed by a huge Phaeocystis globosa (here after Phaeocystis) bloom. Yet, in early spring, Chl-a concentrations for the coastal stations were higher in 2018 than 2016. A summer diatom bloom was also observed during both years, with higher Chl-a concentrations in 2018 compared to 2016.
3.1. Spring phytoplankton bloom
As previously described in the BCZ (Rousseau et al., 2002), the Phaeocystis bloom occurred at the end of April both in 2016 and 2018. The values were not significantly different between the two years with an average Chl-a concentration of 13.6 ± 6.0 μg L-1 and 15.7 ± 7.8 μg L-1
in 2016 and 2018 respectively (p = 0.653) (Fig. 2).
However, both years differed significantly with respect to the early spring bloom of diatoms occurring during the month of March in 2016, Table 2
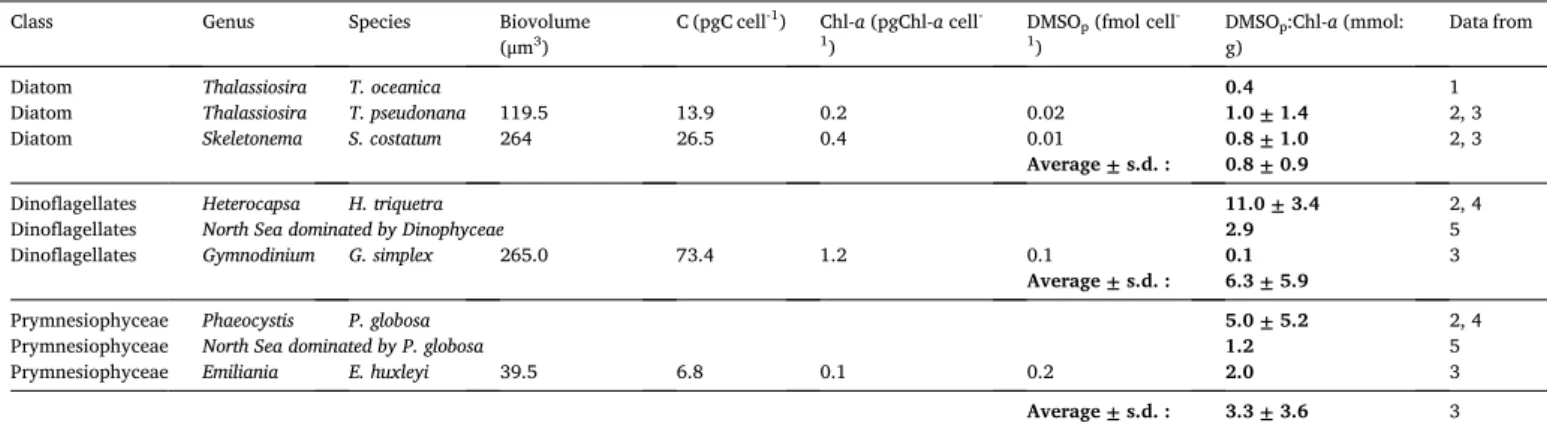
Ratio of particulate dimethylsulfoxide (DMSOp) to Chlorophyll-a (Chl-a) concentration (DMSOp:Chl-a) (mmol:g), cell biovolume (μm3), cell carbon (C) content (pgC cell-1) compiled from published literature for species found in the Belgian coastal zone (Fig. 1).
Class Genus Species Biovolume
(μm3) C (pgC cell
-1) Chl-a (pgChl-a cell-
1) DMSOp (fmol cell
-
1) DMSOg) p:Chl-a (mmol: Data from
Diatom Thalassiosira T. oceanica 0.4 1
Diatom Thalassiosira T. pseudonana 119.5 13.9 0.2 0.02 1.0 ± 1.4 2, 3
Diatom Skeletonema S. costatum 264 26.5 0.4 0.01 0.8 ± 1.0 2, 3
Average ± s.d. : 0.8 ± 0.9
Dinoflagellates Heterocapsa H. triquetra 11.0 ± 3.4 2, 4
Dinoflagellates North Sea dominated by Dinophyceae 2.9 5
Dinoflagellates Gymnodinium G. simplex 265.0 73.4 1.2 0.1 0.1 3
Average ± s.d. : 6.3 ± 5.9
Prymnesiophyceae Phaeocystis P. globosa 5.0 ± 5.2 2, 4
Prymnesiophyceae North Sea dominated by P. globosa 1.2 5
Prymnesiophyceae Emiliania E. huxleyi 39.5 6.8 0.1 0.2 2.0 3
Average ± s.d. : 3.3 ± 3.6 3 1 Bucciarelli et al. (2013); 2. Royer et al. (in review); 3 Hatton and Wilson (2007); 4 Speeckaert et al. (2019); 5 Sim´o et al. (1998).
Fig. 2. Seasonal evolution of average (± standard deviation) Chlorophyll-a (Chl-a) concentration (μg L-1) for the five stations sampled in the Belgian coastal zone in 2016 and 2018. Location of the sampling stations are shown in Fig. 1.
and from the first days of March until early April in 2018 (5.6 ± 2.6 and 12.8 ± 8.0 μg L-1 respectively; p < 0.05) (Fig. 2). The higher Chl-a values
were due to the Chl-a concentrations from the coastal stations (700, 130, and 230) (Fig. 3a and b) with an average Chl-a at these three stations and for the diatom bloom period of 6.9 ± 1.9 and 16.7 ± 7.5 μg L-1 for 2016
and 2018 respectively (p = 0.073).
We tested if differences in light intensity, SST and nutrient concen-trations might be responsible of the earlier and higher diatom spring bloom in 2018 compared to 2016. The light availability is the primary control on spring phytoplankton onset in the North Sea (Wiltshire et al., 2008) and depends on the combination of incoming solar radiation and the SPM content that attenuates light penetration. During the early diatom bloom, SPM for the coastal stations was significantly higher in 2018 (173.3 ± 32.1 mg L-1) than 2016 (48.7 ± 53.2 mg L-1) (p < 0.01) (Fig. 3i and j). However, the incident light was more favorable in 2018 and allowed an earlier onset of the diatom bloom (Rousseau, 2000) (Pearson’s correlation between Chl-a and incident light, p < 0.05). The incoming PAR was indeed 1.5 times higher in February 2018 than 2016 (204.2 ± 85.9 and 137.6 ± 81.6 μE m-2s-1 respectively; p < 0.001)
(Fig. 3o).
SST for the coastal stations was less favorable for the diatom growth (Montagnes and Franklin, 2001) in February 2018 (5.3 ± 0.5 ◦C) than in
2016 (6.5 ± 0.2 ◦C) (p < 0.05) and during the bloom in 2018 (4.2 ±
2.2 ◦C) than 2016 (7.6 ± 1.0 ◦C) (p = 0.063) (Fig. 3m, n). The SST in
winter 2018 was the lowest during the last 13 years (Borges et al., 2019). Nevertheless, lower temperature during winter-spring bloom period might induce higher phytoplankton biomass resulting from a lower grazing rate of the zooplankton (Sommers and Lewandowska, 2011).
In addition, we observed a higher nutrient supply coming from the
Scheldt estuary during the early blooming period with SSS lower in 2018 than in 2016 (30.9 ± 1.3 and 32.9 ± 1.8 respectively; p = 0.086) (Fig. 3c and d). The DIN concentration was higher in 2018 than in 2016 with respectively 45.8 ± 9.6 and 19.6 ± 17.9 μmol L-1 (p = 0.084) (Fig. 3k
and l) and PO4 concentration was significantly differentiated with 0.6 ±
0.2 and 0.2 ± 0.2 μmol L-1 (p < 0.05) (Fig. 3g and h). The DSi
concen-tration was not significantly different even if we also observed higher values with 16.3 ± 4.7 in 2018 and 4.3 ± 5.1 μmol L-1 in 2016 (p =
0.250) (Fig. 3e and f).
In conclusion, the timing of the early spring diatom bloom in 2018 compared to 2016 seems to be the result of better light conditions in late winter. Furthermore, the higher biomass observed during the blooming period might be the consequence of higher nutrient concentrations and possibly lower zooplankton grazing resulting from lower SST.
The relative cellular density (%) was analyzed in 2016 and 2018 for the station 330, representative for the BCZ area (Rousseau et al., 2002). For March 2016, diatoms represented ~40% and P. globosa ~60% (Fig. 4). In April 2016, the relative abundance of the Prymnesiophyceae increased up to 96% while the diatoms decreased to 4% (Fig. 4). At the beginning of May 2016, P. globosa still represented 99% while only 1% of diatoms characterized the phytoplankton community (Fig. 4). In May 2018, the phytoplankton community was represented by 94% of P. globosa and 3% of diatoms (Fig. 4). The dinoflagellates were for both years almost absent for this period (< 0.2%). With genomic data, we can additionally explore the phytoplankton composition during the early spring bloom for the station 330. The diatom community was mainly composed by the genus Thalassiosira, including T. rotula, T. tenera and T. lundiana, as well as Guinardia delicatula, Rhizosolenia shubsholei and Minutocellus polymorphus. Some diatom genera from 2016 were not
Fig. 3. Seasonal and spatial evolution of (a) Chlorophyll-a (Chl-a) concentration (μg L-1) in 2016, (b) in 2018; (c) Sea Surface Salinity (SSS) in 2016, (d) in 2018; (e) Dissolved Silica (DSi) concentration (μmol L-1) in 2016, (f) in 2018; (g) phosphate (PO
4) concentrations (μmol L-1) in 2016, (h) in 2018; (i) Suspended Particulate Matter (SPM) (mg L-1) in 2016, (j) in 2018; (k) Dissolved Inorganic Nitrogen (DIN) concentration (μmol L-1) in 2016, (l) in 2018; (m) Sea Surface Temperature (SST) (◦C) in 2016, (n) in 2018; and (o) seasonal evolution of daily averaged Photosynthetic Active Radiation (PAR) (μE m-2s-1) for the five stations sampled in the Belgian coastal zone in 2016 and 2018 (Fig. 1).
observed in 2018 such as Asterionella, Coscinodiscus, Thalassionema, Biddulphia and Nitzschia. The dinoflagellates observed were the species Heterocapsa rotundata and Karlodinium veneficum. Other species such as Gyrodinium aureolum, G. spirale, Sinophysis sp., Tripos fusus, Katodinium glaucum, or Warnowia sp. among others were also detected.
3.2. Summer phytoplankton bloom
The Chl-a concentrations in August (Fig. 2) were also different be-tween 2016 and 2018 (p = 0.090). The concentration was 4.1 times higher in 2018 (13.4 ± 9.9 μg L-1) than in 2016 (3.4 ± 2.0 μg L-1). The
PAR was 1.2 times higher in June 2018 than in 2016 (p < 0.05) (Fig. 3o). This explains the significant higher average SST for all the stations observed in July 2018 compared to 2016 (21.3 ± 0.7 ◦C and 19.8 ±
1.0 ◦C respectively; p < 0.01), in response to a large-scale heatwave in
Europe (Magnusson et al., 2018; Borges et al., 2019). As a matter of fact, the temperature was significantly higher at the coastal stations in 2018 than in 2016 from late April to July (p < 0.05) (Fig. 3m, n). Temperature is one of the most important drivers of the phytoplankton community composition (Schabhüttl et al., 2013; Striebel et al., 2016; Hunter--Cevera et al., 2016), and the higher biomass results from higher cell division rates in warmer conditions (Richardson and Schoeman 2004;
Hunter-Cevera et al., 2016).
In July 2016, the community was dominated by diatoms (99%) with a small increase of dinoflagellates (1%) (Fig. 4). In 2018, the diatoms represented 72% with 23% of Prymnesiophyceae and 5% of di-noflagellates (Fig. 4). During August 2016, diatoms still dominated the community (92%) with a slight increase of dinoflagellate (8%) (Fig. 4). Diatoms represented up to 91% in August 2018 while Prymnesiophy-ceae and dinoflagellates were represented by 6 and 4%, respectively (Fig. 4b). October was the last month sampled in 2016 for the phyto-plankton diversity characterized with 98% and 2% of diatoms and di-noflagellates, respectively (Fig. 4a). From September to December 2018, the community was composed by 87 ± 8, 8 ± 7 and 5 ± 2% of diatoms, Prymnesiophyceae and dinoflagellates, respectively. Diatom community in August 2018 was mainly composed by Thalassiosira sp. (T. rotula, T.
tenera and T. lundiana), M. polymorphus, G. delicatula and Chaetoceros socialis. The dinoflagellate community was still characterized by H. rotundata while some unclassified Syndiniales, Gyrodinium sp., G. aureolum, G. spirale, T. fusus, Lepidodinium sp., Warnowia sp., K. glaucum and Sinophysis sp were observed. From September to December 2018, Thalassiosira sp., M. polymorphus, G. delicatula still represented the diatom community while the presence of the dinoflagellates H. rotundata, K. veneficum, Gyrodinium sp or Syndiniales sp. was detected. 3.3. Spatial and seasonal variations of DMS(P,O) concentrations
While the annual average Chl-a was significatively higher in 2018 (8.5 ± 7.2 μg L-1) than in 2016 (5.1 ± 5.5 μg L-1) (p < 0.001), the annual
average DMSPp concentration between the two years was similar (162
±246 nmol L-1 in 2018 and 207 ± 374 nmol L-1 in 2016; p = 0.438). Even if there was slight difference in DMSPp in early may (448 ± 183 in
2018 and 1142 ± 487 nmol L-1 in 2016), no significant difference was
observed (p = 0.086) (Fig. 5a) and the Chl-a concentration was similar (p = 0.752) (Fig. 2). Despite a higher biomass in August 2018 than 2016, there was no difference in DMSPp concentrations during both years, with
a low value of 49 ± 20 and 54 ± 14 nmol L-1 in 2016 and 2018,
respectively (p = 0.732). Even if the Chl-a concentrations were different between the two years during both the early spring and summer blooms, the similarities in DMSPp concentrations could be explained by the
phytoplankton composition. The early spring bloom was mainly char-acterized by low-DMSP producers such as the diatom Thalassiosira sp. and the dinoflagellates H. rotundata and K. veneficum (Table 1). The same conclusion was observed during summer with the diatoms Tha-lassiosira sp. and M. polymorphus, or the dinoflagellates H. rotundata, Gyrodinium sp. and Syndiniales sp. (Table 1).
The seasonal pattern of DMSOt concentration was similar between
both years (Fig. 5b) but the yearly mean was significantly different (88 ±107 and 48 ± 68 nmol L-1 in 2016 and 2018 respectively; p < 0.01). The average value of DMSOt during the Phaeocystis bloom was 246 ±
205 and 163 ± 193 nmol L-1 for 2016 and 2018, respectively (p = 0.597)
(Fig. 5b). Significant difference was only observed at the beginning of Fig. 4. Seasonal evolution of the relative cellular density (%) for the station 330 in the Belgian coastal zone (Fig. 1) analyzed for the phytoplankton diversity from March to October in 2016 and from March to December in 2018 with distinction between the Prymnesiophyceae, diatoms and dinoflagellates.
May, as it was for the DMSPp, with concentration 1.9 times higher in
2016 than in 2018 (p < 0.05). In 2018, DMSOp represents 66% of the
DMSOt pool and showed a similar seasonal evolution (Fig. 6a). DMSOd
was generally lower than DMSOp and presented a different seasonal
pattern since the peak of DMSOd occurred just before the DMSOp peak in
late April (Fig. 6a and b).
The spatial variations (coastal-offshore) observed for Chl-a (Fig. 3a) also occurred for DMSPp in 2016 but the DMSOt concentrations did not
clearly differ among the stations, except for station 700 (Fig. 5c and d). The high concentration observed at station 700 was related to the high SPM concentration and linked to the resuspension of sediment (Speeckaert et al., 2018). In 2018, the DMSPp concentration was
asso-ciated with the Phaeocystis bloom with a nearshore-offshore gradient and concentrations from 536 to 1353 nmol L-1 (Fig. 5e). This gradient
did not occur in late May nor during the summer. DMSOt and DMSOp in
2018 showed a seasonal pattern with the same gradient during the Phaeocystis bloom with values varying from 62 to 500 nmol L-1 (Fig. 5f)
and from 33 to 498 nmol L-1 (Fig. 6c), respectively. The distinction
be-tween coastal and offshore stations for the DMSOd variations was no
longer clearly identified (Fig. 6d). Following the Chl-a peak during August 2018 for station 700 (Fig. 3b), the DMSOt and the DMSOp
con-centration reached a value of 69 and 59 nmol L-1 respectively, which
were the highest concentrations observed for this period (Figs. 5f and 6c).
3.4. DMS(P,O) relations and DMSOp: DMSPp ratio
We further explored the similarities between all the variables in 2016 and 2018 by PCA. The Fig. 7a shows the grouping of variables within an orthogonal 2D-space along the two most relevant PCs explaining 57.8% of the total variance (n = 86). DMSPp, DMSOt and Chl-a explained more
than 69.2% of variation along the PC2. With only the 2016 data (Fig. 7b; n = 41), two PCs characterized 61.7% of the variance where the vari-ables were clustering together as previously (>67.3%). With only the 2018 data (Fig. 7c; n = 45), 61.6% of the variance were explained by two PCs where DMSPp and DMSOp correlated (>84.7%). The combining
2016–2018 PC analysis brings statistical support for the link between the Chl-a and the DMS(P,O) that are varying together. The previous observation was not noticed for the data in 2018 since the DMS(P,O)p
were not clustered with Chl-a. The Spearman correlation analysis fol-lowed the same information with significant non-parametric correlation between DMSPp and Chl-a (ρ =0.62; p < 0.01) with data from 2016 and 2018. More precisely, DMSPp and Chl-a were highly correlated in 2016
(ρ =0.71; p < 0.001) but to a lesser extent in 2018 (ρ =0.42; p < 0.001) Fig. 5. Seasonal evolution in 2016 and 2018 of average (± standard deviation) (a) particulate dimethylsulfonioproprionate (DMSPp) (nmol L-1); (b) total dime-thylsulfoxide (DMSOt) (nmol L-1); and seasonal and spatial evolution of (c) DMSPp (nmol L-1) and (d) DMSOt (nmol L-1) in 2016; (e) DMSPp (nmol L-1) and (f) DMSOt (nmol L-1) in 2018 for the five stations sampled in the Belgian coastal zone (Fig. 1).
that was reflected in the PCA.
The Fig. 8a represents the linear regression between DMSPp and Chl-
a for the two years. The slope of the regression of DMSPp and Chl-a was
higher in 2016 than that in 2018 (Fig. 8a). This is due to the fact that in 2018 many data points for high Chl-a values corresponded to low DMSP- producing diatoms and dinoflagellates (Table 1), while in 2016 the data points for low DMSP-producing species usually exhibited low Chl-a. This led to the steeper regression of DMSPp and Chl-a in 2016 compared to
2018, as well as lower correlation coefficient in 2018 (R2 =0.38) due to
more scatter in data points. Yet, when comparing the DMSPp and Chl-a
correlations separating the Phaeocystis bloom dominated data point from the rest of the year (Fig. 8b), the slopes of the regressions are similar during both years: 42.0 and 53.9 for Phaeocystis in 2018 and 2016, respectively, and 6.8 and 9.1 for the rest of the year in 2018 and 2016, respectively. The first values were in the same range as the DMSPp:Chl-a
ratio given by Stefels et al. (2007) (52 ± 37 mmol:g) or recalculated from published literature with 76.5 ± 15.0 mmol:g for the
Prymnesiophyceae P. globosa (Table 1). The ratio obtained for the rest of the year corresponds to the ratio given by Stefels et al. (2007) (4 ± 6 mmol:g) or recalculated in Table 1 (3.2 ± 3.1 mmol:g) for the diatoms. The presence of dinoflagellates was not reflected in the slope of the linear regressions since they were mainly composed by H. rotundata characterized by a low DMSPp:Chl-a ratio of 18.7 ± 0.9 mmol:g
(Table 1).
The DMSOp concentration was significantly correlated with DMSPp
concentration (ρ =0.79; p < 0.001), as also observed in a global dataset by Sim´o and Vila-Costa (2006). The slope of the regression of DMSOp
and DMSPp (Fig. 9a) (R2 =0.74) was lower in the BCZ (0.1) than in the global dataset reported by Sim´o and Vila-Costa (2006) (0.2). This dif-ference cannot be analyzed because Sim´o and Vila-Costa (2006) did not report the phytoplankton composition. The DMSOp:DMSPp ratio in the
BCZ driven by the data points related to Phaeocystis bloom (0.16 ± 0.13) was very close to the value of 0.15 ± 0.09 reported in the literature for pure Phaeocystis cultures (Hatton and Wilson, 2007; Royer et al., in Fig. 6. Seasonal evolution of average (± standard deviation) (a) particulate dimethylsulfoxide (DMSOp) (nmol L-1), (b) dissolved dimethylsulfoxide (DMSO
d) (nmol L-1); and seasonal and spatial evolution of (c) DMSOp (nmol L-1), (d) DMSOd (nmol L-1) in 2018 for the five stations sampled in the Belgian coastal zone (Fig. 1).
Fig. 7. Principal Component Analysis (PCA) with all the variables after Oblimin rotation for (a) the data from 2016 and 2018, (b) with data from 2016 and (c) with data from 2018 including Chlorophyll-a (Chl-a), total dimethylsulfoxide (DMSOt), particulate dimethylsulfoxide (DMSOp), particulate dimethylsulfonioproprionate (DMSPp), Sea Surface Salinity (SSS), Sea Surface Temperature (SST), Photosynthetic Active Radiation (PAR), Dissolved Inorganic Nitrogen (DIN), Dissolved Silica (DSi), phosphate (PO4) in the Belgian coastal zone (Fig. 1).
review). DMSOp was also highly correlated to Chl-a (ρ =0.79; p < 0.001) and the slope of the regression was higher for Phaeocystis (3.3 mmol:g) (R2 =0.51) than for the rest of the year (1.8 mmol:g) (R2 =
0.71) (Fig. 9b). The first value was in the same range than those reported in literature for the DMSOp:Chl-a ratio with 3.3 ± 3.6 mmol:g for the
Prymnesiophyceae (Table 2). The second value was higher than the ratio found for the diatoms (0.8 ± 0.9 mmol:g; Table 2). The higher value could be explained by the presence of dinoflagellates for which we found DMSOp:Chl-a ratio of 6.3 ± 5.9 mmol:g (Table 2).
3.5. Phytoplankton diversity and DMS(P,O) estimation
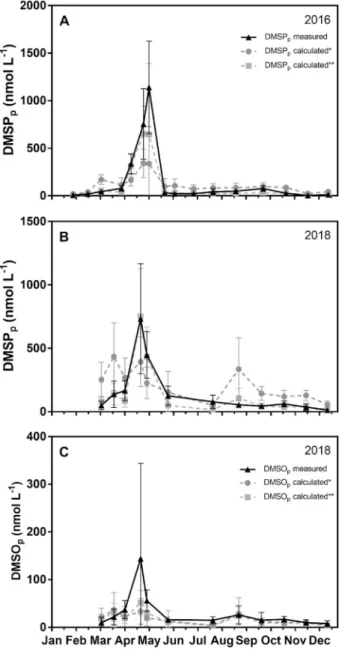
DMSPp was estimated from the linear regression with Chl-a (DMSPp
(nmol L-1) = 23.1 * Chl-a (μg L-1), R2 =0.46) computed for the whole
dataset (2016 and 2018) and compared with the measured DMSPp. For
both years, the magnitude of the calculated Phaeocystis DMSPp peak was
underestimated compared to measurements (Fig. 10a and b). Calculated DMSPp was also higher than spring and summer observed
concentra-tions in particular in 2018 due to higher Chl-a values (Fig. 10b). As shown by Speeckaert et al. (2018), using a unique DMSP:Chl-a ratio is inappropriate to estimate DMSP concentration associated to either high- or low-DMSP producers. We thus used two different DMSPp versus Chl-a
relationships to discriminate the two main blooming phytoplankton groups: for Phaeocystis (DMSPp (nmol L-1) = 48.0 * Chl-a (μg L-1)) and for
diatoms (DMSPp (nmol L-1) = 8.0 * Chl-a (μg L-1)). The use of these
specific DMSPp:Chl-a relationships led to a better fit of modelled DMSPp
compared to field measurements for both years (Fig. 10a and b). The same procedure was applied for the DMSOp estimation. We
compared DMSOp computed for the whole dataset in 2018 from the
linear regression with Chl-a (DMSOp (nmol L-1) = 2.1 * Chl-a (μg L-1), R2
=0.54). The regression model tends to fit with the observed DMSOp except during the Phaeocystis blooming period where it was under-estimated but still within the standard deviation (Fig. 10c). When using the relationships deduced from the Fig. 9b, with one corresponding for the Phaeocystis (DMSOp (nmol L-1) = 3.3 * Chl-a (μg L-1)) and one for the
diatoms (DMSOp (nmol L-1) = 1.8 * Chl-a (μg L-1)), we mainly observed
the same evolution (Fig. 10c).
In conclusion, simple relationships between DMS(P,O)p and Chl-a
are not sufficiently robust to describe the seasonal variability of DMS(P, O)p. We thus recommend considering two separate DMS(P,O)-Chl-a
re-lationships for low and high-DMSP producing groups to estimate DMS(P, O)p based on Chl-a in global models.
4. Conclusions
Phytoplankton biomass in the BCZ was higher during the diatom blooming period in spring 2018 than 2016, and to a lesser extent, in August 2018 than 2016. The difference among years in spring was explained by lower SST during winter, higher nutrients supply coming from the Scheldt estuary and better light conditions in 2018 compared to 2016. The difference among years in August seemed related to higher SST in 2018 compared to 2016. Despite these major differences in phytoplankton biomass, the seasonal and spatial DMS(P,O)p patterns
were similar in 2016 and 2018. This was explained by the peak of biomass occurring both years in spring due to Phaeocystis. Phaeocystis is a high-DMS(P,O) producer and dominates the annual DMSPp production
in the BCZ. On the contrary, low-DMSP producing diatom and dinofla-gellate species dominated the spring and summer bloom for which we observed strong differences in Chl-a between both years. This illustrates why Chl-a concentration alone could not be used to describe the DMS(P, O)p variations. The phytoplankton diversity had to be taken into
consideration to analyze and better predict the DMS(P,O)p variations.
The impact of current or future phytoplankton biomass changes on DMS Fig. 8. (a) Particulate dimethylsulfonioproprionate (DMSPp) (nmol L-1) versus
Chlorophyll-a (Chl-a) concentration (μg L-1) in 2016 and 2018 and (b) DMSP p (nmol L-1) versus Chl-a concentration (μg L-1) with discrimination between Phaeocystis and others with data for 2016 and 2018 in the Belgian coastal zone (Fig. 1).
Fig. 9. (a) Particulate dimethylsulfoxide (DMSOp) (nmol L-1) versus particulate dimethylsulfonioproprionate (DMSPp) concentration (nmol L-1) in 2018 and (b) DMSOp (nmol L-1) versus Chlorophyll-a (Chl-a) concentration (μg L-1) with discrimination between Phaeocystis and others with data from 2018 in the Belgian coastal zone (Fig. 1). The linear regressions exclude the outlier data points in brackets.
(P,O)p marine concentrations will thus mainly depend on the species
composition rather than the total phytoplankton biomass.
Coastal marine areas are expected to show changes in phytoplankton biomass in response to several human pressures such as nutrient inputs and changes in temperature that can also affect DMS(P,O)p
concentra-tion (and possibly DMS emissions). We pointed out the significance of considering two separate DMS(P,O)p-Chl-a relationships for low and
high-DMSP producing species to properly estimate the DMS(P,O)p
con-centrations. Better constrain the DMS(P,O)p in the water column linked
to the phytoplankton diversity and abiotic parameters will ultimately
lead to improvements in the modelling of the ocean-atmosphere DMS flux and its potential climate impact.
Declaration of competing interest
The authors declare that they have no known competing financial interests or personal relationships that could have appeared to influence the work reported in this paper.
Acknowledgements
We are grateful to the crew of the RV Simon Stevin for assistance during the cruises, to Andr´e Cattrijsse and Jonas Mortelmans (VLIZ) for organizing the schedule of cruises. Nutrient data were acquired as part of the VLIZ contribution to the LifeWatch ESFRI. This project has received funding from the European Union’s Horizon 2020 research and innovation program under the Marie Skłodowska-Curie grant agreement No 766327. The GC was acquired with funds from the Fonds National de la Recherche Scientifique (FNRS) (2.4.637.10). NG and CR received financial support from the Fonds David et Alice Van Buuren. CR has a PhD grant from the FRIA (Fund for Research Training in Industry and Agriculture, FNRS). AVB is a research director at the FNRS.
References
Andreae, M.O., Barnard, W.R., 1984. The marine chemistry of dimethylsulfide. Mar. Chem. 14, 267–279. https://doi.org/10.1016/0304-4203(84)90047-1. Barton, S., et al., 2018. Universal Metabolic Constraints on the Thermal Tolerance of
Marine Phytoplankton. https://doi.org/10.1101/358002. http://biorxiv.org/lookup /doi/10.1101/358002.
Borges, A.V., Royer, C., Martin, J.L., Champenois, W., Gypens, N., 2019. Response of marine methane dissolved concentrations and emissions in the Southern North Sea to the European 2018 heatwave. Continent. Shelf Res. 190, 104004.
Bucciarelli, E., Sunda, W.G., 2003. Influence of CO2, nitrate, phosphate, and silicate limitation on intracellular dimethylsulfoniopropionate in batch cultures of the coastal diatom Thalassiosira pseudonana. Limnol. Oceanogr. 48, 2256–2265.
Bucciarelli, E., et al., 2013. Increased intracellular concentrations of DMSP and DMSO in iron-limited oceanic phytoplankton Thalassiosira oceanica and Trichodesmium erythraeum. Limnol. Oceanogr. 58, 1667–1679.
Champenois, W., Borges, A.V., 2019. Determination of dimethylsulfoniopropionate and dimethylsulfoxide in Posidonia oceanica leaf tissue. MethodsX 6, 56–62.
Charlson, R.J., Lovelock, J.E., Andreae, M.O., Warren, S.G., 1987. Oceanic phytoplankton, atmospheric sulphur, cloud albedo and climate. Nature 326, 655–661.
Cooney, E.C., 2016. The effect of high-intensity visible light on the bloom niches of the phototrophic dinoflagellates Alexandrium fundyense and Heterocapsa rotundata. WWU Grad. Sch. Collect. 529.
Cooney, E.C., Fredrickson, K.A., Bright, K.J., Strom, S.L., 2019. Contrasting effects of high-intensity photosynthetically active radiation on two bloom-forming dinoflagellates. J. Phycol. 55, 1082–1095.
Curran, M.A.J., Jones, G.B., 1998. Spatial distribution of dimethylsulfide and dimethylsulfoniopropionate in the Australasian sector of the Southern Ocean. J. Geophys. Res. 103, 16677–16689.
Dacey, J.W.H., Blough, N.V., 1987. Hydroxide decomposition of
dimethylsulfoniopropionate to form dimethylsulfide. Geophys. Res. Lett. 14, 1246–1249.
Del Valle, D.A., et al., 2011. Effect of acidification on preservation of DMSP in seawater and phytoplankton cultures: evidence for rapid loss and cleavage of DMSP in samples containing Phaeocystis sp. Mar. Chem. 124, 57–67.
Deschaseaux, E.S.M., et al., 2014. Dimethylsulphoxide (DMSO) in biological samples: a comparison of the TiCl3 and NaBH4 reduction methods using headspace analysis.
Mar. Chem. 164, 9–15.
Desmit, X., et al., 2019. Changes in chlorophyll concentration and phenology in the North Sea in relation to de-eutrophication and sea surface warming. Limnol. Oceanogr. lno 11351. https://doi.org/10.1002/lno.11351.
Edwards, K.F., Thomas, M.K., Klausmeier, C.A., Litchman, E., 2016. Phytoplankton growth and the interaction of light and temperature: a synthesis at the species and community level: light-Temperature Interactions. Limnol. Oceanogr. 61, 1232–1244. Flanders Marine Institute (VLIZ), 2019. Belgium: LifeWatch Observatory Data: Nutrient,
Pigment, Suspended Matter and Secchi Measurements in the Belgian Part of the North Sea. https://doi.org/10.14284/328.
Geider, R.J., 1987. Light and temperature dependence of the carbon to chlorophyll a ratio in microalgae and cyanobacteria: implications for physiology and growth of phytoplankton. New Phytol. 106, 1–34.
Goss-Sampson, M.A., 2018. Statistical Analysis in JAsP: A Guide for Students.
Gypens, N., Borges, A.V., Speeckaert, G., Lancelot, C., 2014. The dimethylsulfide cycle in the eutrophied southern North sea: a model study integrating phytoplankton and bacterial processes. PloS One 9, e85862.
Fig. 10. Seasonal evolution in the Belgian coastal zone of average (± standard deviation) particulate dimethylsulfonioproprionate (DMSPp) measured (nmol L- 1) (in black) and DMSPp calculated* based on Chlorophyll-a (Chl-a) concen-tration using a relationship for all phytoplankton species [DMSPp (nmol L-1) = 25.1 * Chl-a (μg L-1)] or DMSP
p calculated** using a relationship for the di-atoms [DMSPp (nmol L-1) = 8.0 * Chl-a (μg L-1)] and another one for Phaeocystis globosa [DMSPp (nmol L-1) = 48.0 * Chl-a (μg L-1)] for (a) 2016 and (b) 2018. (c) Seasonal evolution of particulate dimethylsulfoxide (DMSOp) measured (nmol L-1) (in black) and DMSOp calculated* based on Chl-a using a relationship for all phytoplankton species [DMSOp (nmol L-1) = 2.1 * Chl-a (μg L-1)] or DMSOp calculated** using a relationship for the diatoms [DMSOp (nmol L-1) = 1.8 * Chl-a (μg L-1)] and another one for Phaeocystis globosa [DMSOp (nmol L-1) =3.3 * Chl-a (μg L-1)] for 2018.
Hatton, A.D., Wilson, S.T., 2007. Particulate dimethylsulphoxide and
dimethylsulphoniopropionate in phytoplankton cultures and Scottish coastal waters. Aquat. Sci. 69, 330–340.
Hunter-Cevera, K.R., et al., 2016. Physiological and ecological drivers of early spring blooms of a coastal phytoplankter. Science 354, 326–329.
Keller, M.D., Bellows, W.K., Guillard, R.R.L., 1989. Dimethyl sulfide production in marine phytoplankton. In: Saltzman, E.S., Cooper, W.J. (Eds.), Biogenic Sulfur in the Environment. American Chemical Society, Washington DC, pp. 167–182.
Kiene, R.P., Gerard, G., 1994. Determination of trace levels of dimethylsulphoxide (DMSO) in seawater and rainwater. Mar. Chem. 47, 1–12.
Kiene, R.P., Slezak, D., 2006. Low dissolved DMSP concentrations in seawater revealed by small volume gravity filtration and dialysis sampling. Limnol Oceanogr. Methods 4, 80–95.
Kinsey, J.D., Kieber, D.J., 2016. Microwave preservation method for DMSP, DMSO, and acrylate in unfiltered seawater and phytoplankton culture samples. Limnol Oceanogr. Methods 14, 196–209.
Kirst, G.O., et al., 1991. Dimethylsulfoniopropionate (DMSP) in icealgae and its possible biological role. Mar. Chem. 35, 381–388.
Kirst, G.O., 1996. Osmotic adjustments in phytoplankton and macroalgae: the use of dimethylsulfoniopropionate (DMSP). In: Kiene, R.P., Visscher, P., Keller, M., Kirst, G. O. (Eds.), Biological and Environmental Chemistry of DMSP and Related Sulfonium
Compounds. Plenum, New York, pp. 121–129.
Litchman, E., Klausmeier, C.A., 2001. Competition of Phytoplankton under fluctuating light. Am. Nat. 157 (2), 170–187.
Magnusson, L., Ferranti, L., Vamborg, F., 2018. Forecasting the 2018 European heatwave. ECMWF newsletter, 157, p. 4. https://www.ecmwf.int/en/newsletter/1 57/news/forecasting-2018-european-heatwave. (Accessed 7 March 2019).
McMurdie, P.J., Holmes, S., 2013. Phyloseq: an R package for reproducible interactive analysis and graphics of microbiome census data. PloS One 8, e61217.
McParland, E.L., Levine, N.M., 2019. The role of differential DMSP production and community composition in predicting variability of global surface DMSP concentrations. Limnol. Oceanogr. 64, 757–773.
Menden-Deuer, S., Lessard, E.J., 2000. Carbon to volume relationships for
dinoflagellates, diatoms, and other protist plankton. Limnol. Oceanogr. 45, 569–579.
Montagnes, D.J.S., Franklin, M., 2001. Effect of temperature on diatom volume, growth rate, and carbon and nitrogen content: reconsidering some paradigms. Limnol. Oceanogr. 46, 2008–2018.
Mortelmans, J., et al., 2019. Nutrient, pigment, suspended matter and turbidity measurements in the Belgian part of the North Sea. Sci. Data 6, 22.
Nohe, A., et al., 2020. Marked changes in diatom and dinoflagellate biomass, composition and seasonality in the Belgian Part of the North Sea between the 1970s and 2000s. Sci. Total Environ. 716, 136316.
Olenina, I., et al., 2006. Biovolumes and size-classes of phytoplankton in the Baltic Sea. HELCOM Balt. Sea Environ. Proc. 106.
Prins, T.C., Desmit, X., Baretta-Bekker, J.G., 2012. Phytoplankton composition in Dutch coastal waters responds to changes in riverine nutrient loads. J. Sea Res. 73, 49–62.
https://doi.org/10.1016/j.seares.2012.06.009.
Quinn, P.K., Bates, T.S., 2011. The case against climate regulation via oceanic phytoplankton sulphur emissions. Nature 480, 51–56.
Richardson, A.J., Schoeman, D.S., 2004. Climate impact on plankton ecosystems in the Northeast Atlantic. Science 305, 1609–1612. https://doi.org/10.1126/
science.1100958.
Rousseau, V., 2000. Dynamics of Phaeocystis and Diatom Blooms in the Eutrophicated Coastal Waters of the Southern Bight of the North Sea. Ph.D. thesis. Universit´e Libre de Bruxelles, 205pp.
Rousseau, V., Leynaert, A., Daoud, N., Lancelot, C., 2002. Diatom succession, silicification and silicic acid availability in Belgian coastal waters (Southern North Sea). Mar. Ecol. Prog. Ser. 236, 61–73.
Rousseau, V., Mathot, S., Lancelot, C., 1990. Calculating carbon biomass of Phaeocystis sp. from microscopic observations. Mar. Biol. 107, 305–314.
Schabhüttl, S., et al., 2013. Temperature and species richness effects in phytoplankton communities. Oecologia 171, 527–536.
Seymour, J.R., Simo, R., Ahmed, T., Stocker, R., 2010. Chemoattraction to dimethylsulfoniopropionate throughout the marine microbial food web. Science 329, 342–345.
Sim´o, R., Vila-Costa, M., 2006. Ubiquity of algal dimethylsulfoxide in the surface ocean: geographic and temporal distribution patterns. Mar. Chem. 100, 136–146.
Sim´o, R., Hatton, A., Malin, G., Liss, P., 1998. Particulate dimethyl sulphoxide in seawater: production by microplankton. Mar. Ecol. Prog. Ser. 167, 291–296.
Sommer, U., Lewandowska, A., 2011. Climate change and the phytoplankton spring bloom: warming and overwintering zooplankton have similar effects on phytoplankton. Global Change Biol. 17, 154–162.
Sommer, U., et al., 2012. Beyond the plankton ecology group (PEG) model: mechanisms driving plankton succession. Annu. Rev. Ecol. Evol. Syst. 43, 429–448.
Speeckaert, G., Borges, A.V., Gypens, N., 2019. Salinity and growth effects on dimethylsulfoniopropionate (DMSP) and dimethylsulfoxide (DMSO) cell quotas of Skeletonema costatum, Phaeocystis globosa and Heterocapsa triquetra. Estuar. Coast Shelf Sci. 226, 106275.
Speeckaert, G., Borges, A.V., Champenois, W., Royer, C., Gypens, N., 2018. Annual cycle of dimethylsulfoniopropionate (DMSP) and dimethylsulfoxide (DMSO) related to phytoplankton succession in the Southern North Sea. Sci. Total Environ. 622–623, 362–372.
Stefels, J., 2009. Determination of DMS, DMSP, and DMSO in Seawater. Practical Guidelines for the Analysis of Seawater, p. 223.
Stefels, J., 2000. Physiological aspects of the production and conversion of DMSP in marine algae and higher plants. J. Sea Res. 43, 183–197.
Stefels, J., Steinke, M., Turner, S., Malin, G., Belviso, S., 2007. Environmental constraints on the production and removal of the climatically active gas dimethylsulphide (DMS) and implications for ecosystem modelling. Biogeochemistry 83, 245–275.
Strickland, J.D.H., Parsons, T.R., 1972. A practical handbook of seawater analysis. Pract. Handb. Seawater Anal. 167, 185.
Striebel, M., Schabhüttl, S., Hodapp, D., Hingsamer, P., Hillebrand, H., 2016. Phytoplankton responses to temperature increases are constrained by abiotic conditions and community composition. Oecologia 182, 815–827.
Strom, S., et al., 2003. Chemical defense in the microplankton I: feeding and growth rates of heterotrophic protists on the DMS-producing phytoplankter Emiliania huxleyi. Limnol. Oceanogr. 48, 217–229.
Suikkanen, S., Laamanen, M., Huttunen, M., 2007. Long-term changes in summer phytoplankton communities of the open northern Baltic Sea. Estuar. Coast Shelf Sci. 71, 580–592.
Sunda, W., Kieber, D.J., Kiene, R.P., Huntsman, S., 2002. An antioxidant function for DMSP and DMS in marine algae. Nature 418, 317–320.
Townsend, D., Keller, M., 1996. Dimethylsulfide (DMS) and dimethylsulfoniopropionate (DMSP) in relation to phytoplankton in the Gulf of Maine. Mar. Ecol. Prog. Ser. 137, 229–241.
Tynes, C., 2013. Molecular Investigation of Candidate Genes for the Biosynthetic Pathway for Dimethylsulfoniopropionate (DMSP) in the Diatom Thalassiosira Pseudonana. Department of Biology at the Norwegian University of Science and Technology (NTNU).
van Beusekom, J.E.E., Loebl, M., Martens, P., 2009. Distant riverine nutrient supply and local temperature drive the long-term phytoplankton development in a temperate coastal basin. J. Sea Res. 61, 26–33. https://doi.org/10.1016/J.
SEARES.2008.06.005.
Wiltshire, K.H., et al., 2008. Resilience of North Sea phytoplankton spring bloom dynamics: an analysis of long-term data at Helgoland Roads. Limnol. Oceanogr. 53, 1294–1302.
Wolfe, G.V., Steinke, M., Kirst, G.O., 1997. Grazing-activated chemical defence in a unicellular marine alga. Nature 387, 894–897.