R E S E A R C H A R T I C L E
Open Access
Fine-scale assessment of genetic diversity
of trembling aspen in northwestern North
America
Mathieu Latutrie
1,2*, Yves Bergeron
1,2and Francine Tremblay
1,2Abstract
Background: In North America, the last ice age is the most recent event with severe consequences on boreal species’ ranges. Phylogeographic patterns of range expansion in trembling aspen (Populus tremuloides) suggested that Beringia is likely to be a refugium and the“ice-free corridor” in Alberta may represent a region where small populations persisted during the last glacial maximum (LGM). The purpose of this study was to ascertain whether the origins of trembling aspen in western North America are reflected in the patterns of neutral genetic diversity and population structure. A total of 28 sites were sampled covering the northwestern part of aspen’s distribution, from Saskatchewan to Alaska. Twelve microsatellite markers were used to describe patterns of genetic diversity. The genetic structure of trembling aspen populations was assessed by using multivariate analyses, Mantel correlograms, neighbor-joining trees and Bayesian analysis.
Results: Microsatellite markers revealed little to no neutral genetic structure of P. tremuloides populations in northwestern North America. Low differentiation among populations and small isolation by distance (IBD) were observed. The most probable number of clusters detected by STRUCTURE was K = 3 (ΔK = 5.9). The individuals in the populations of the 3 clusters share a common gene pool and showed a high level of admixture. No evidence was found that either Beringia or the“ice-free corridor” were refugia. Highest allelic richness (AR) and lowest heterozygosity (Ho) were observed in
Alberta foothills of the Rocky Mountains.
Conclusions: Contrary to our hypothesis, our results showed that microsatellite markers revealed little to no genetic structure in P. tremuloides populations. Consequently, no divergent populations were observed near supposed refugia. The lack of detectable refugia in Beringia and in the“ice-free corridor” was due to high levels of gene flow between trembling apsen populations. More favorable environmental conditions for sexual reproduction and successful trembling aspen seedling establishment may have contributed to increase allelic richness through recombination in populations from the Albertan foothills of the Rocky Mountains.
Keywords: Aspen, Beringia, Genetic, Ice-free corridor, Last glacial maximum, Microsatellites, Northwestern North America, Phylogeography
* Correspondence:mathieu.latutrie@uqat.ca
1
Institut de Recherche sur les Forêts, Université du Québec en
Abitibi-Témiscamingue, 445 boul. de l’Université, Rouyn-Noranda, QC J9X5E4, Canada
2Centre d’Étude de la Forêt, Université du Québec à Montréal, PO Box
8888Centre-Ville, Montréal, QC H3C3P8, Canada
© The Author(s). 2016 Open Access This article is distributed under the terms of the Creative Commons Attribution 4.0 International License (http://creativecommons.org/licenses/by/4.0/), which permits unrestricted use, distribution, and reproduction in any medium, provided you give appropriate credit to the original author(s) and the source, provide a link to the Creative Commons license, and indicate if changes were made. The Creative Commons Public Domain Dedication waiver (http://creativecommons.org/publicdomain/zero/1.0/) applies to the data made available in this article, unless otherwise stated.
Background
Earth has experienced several episodes of severe climatic variation that have led to a succession of ice ages during the Quaternary (2.58 Mya until present) [1]. During this period, many species have experienced a succession of range expansions and contractions that have affected their genetic structure and diversity [1–3]. In their re-view, Excoffier et al. [2] reported that the effects of these range expansions on genetic diversity could differ mark-edly from pure demographic expansions. Range expan-sions are characterized by a decrease in genetic diversity along the expansion axis, owing to recurrent bottlenecks and founder events [4].
In North America, the last ice age is unquestionably the most recent event to have had severe consequences for boreal species genetic diversity [5]. According to esti-mates by Dyke et al. [6], the Last Glacial Maximum (LGM) occurred 18–21 ky BP. It is therefore considered to be that point when the last massive expansion of plants from different glacial refugia was initiated. Williams [7] and Roberts and Hamann [8] have reconstructed the evolution of land covered by several tree species in North America since the LGM, thereby allowing the identification of potential refugia for those species. Also, molecular studies have shown evidence of genetic structure for several North American plant species [9– 14].
Beatty and Provan [10] proposed a set of 10 potential glacial refugia for terrestrial plant and animals in North America. This set was subsequently reduced by Callahan [15] to 6 potential refugia for trembling aspen (Populus tremuloides Michaux), including: Beringia, the Grand Banks, the northeastern United States, the “Driftless Area” of the mid-western United States, the “ice-free corridor” along the and eastern slopes of the Alberta Rocky Mountains, e.g., [16–18] and the Clearwater Refugium of northern Idaho, e.g., [19].
Beringia has been suspected of being a refugium for mammals [20], herbaceous plants [10, 21], and trees [11, 22–24] during the last ice age maximum. Simulated suit-able habitat during the LGM for some boreal and sub-boreal species such as white spruce (Picea glauca [Moench] Voss), black spruce (Picea mariana [Mill.] BSP), lodgepole pine (Pinus contorta ssp. latifolia [Engelm.] Critchfield), and P. tremuloides were usually lo-cated along the northern Pacific coast and in Beringia, as well as their presence south of the ice sheet [8]. Paleoecological and palynological studies have revealed the presence of Populus in Alaska shortly after the begin-ning of the ice cap melting, suggesting that the genus has persisted in this area [8, 24–26]. For balsam poplar (Popu-lus balsamifera L.), recent molecular evidence does not support Alaska as glacial refugium but does confirm the existence of two distinct groups in northwestern North
America, i.e., a northern group in Alaska and Yukon, and a central group in central distribution area [12]. Keller et al. [12] concluded that the central group descended from the main demographic refugium of P. balsamifera under Pleistocene range restrictions, with an expansion toward its margins during range expansion following LGM. For P. tremuloides, two models that were based on paleoecological data suggest the existence of refugial habitats in Beringia and was likely a true refugium for this species. Moreover, Callahan et al. [27] have shown the existence of two distinct groups for trembling aspen, namely, one in southwestern USA, and the other in Canada and Alaska. Within the second group, the higher allelic richness that was detected in aspen populations located in Alaska and in Alberta suggests that Beringia was likely to be a true refugium and that the presence of an “ice-free corridor” in Alberta could have permitted to P. tremuloides to persist in this area during the LGM [15].
The existence of an “ice-free corridor” between the Laurentian and Cordilleran ice sheets is debated [16]. Since the ice sheets did not advance at the same time in this region, a temporally and geographically shifting ice-free zone could have existed [20, 28]. The Laurentian and Cordilleran ice sheets only coalesced for a brief span of time [16], while numerous isolated foothills of the Rocky Mountains also could have remained ice-free during the LGM [20, 28], potentially leaving suitable habitats for P. tremuloides. Yet, suitable habitat conditions for P. tremu-loidesduring the LGM were not found in this area accord-ing to the simulations of by Roberts and Hamann [8]. In contrast, Callahan et al. [27] reported a higher level of genetic diversity for P. tremuloides in this region. This area appears to be important either as a potentially cryptic refugium or more likely as an admixture zone.
The purpose of this study was to ascertain whether the origin of trembling aspen in western North America is reflected in the patterns of neutral genetic diversity and population structure. In the present study, the glacial origin and post-glacial migration route in the northwest-ern part of the range was uncovered by studying the area analyzed by Callahan et al. [27] at a finer scale. Our aim was to test whether Beringia and the “ice-free corridor” that was situated between the Laurentian and Cordilleran ice sheets might have been the two glacial refugia for trembling aspen in northwestern North America during the Wisconsin Ice Age. The hypothesis were as follows: 1) aspen populations that were located near refugia (Beringia and the "ice-free corridor") should be highly divergent; 2) within-population diversity should decrease with distance from refugia, due to multiple founder events; 3) the “ice-free corridor” was an admixture zone, where divergent lin-eages (from the south and from the Alaska) had converged.
Methods
Study area and sampling
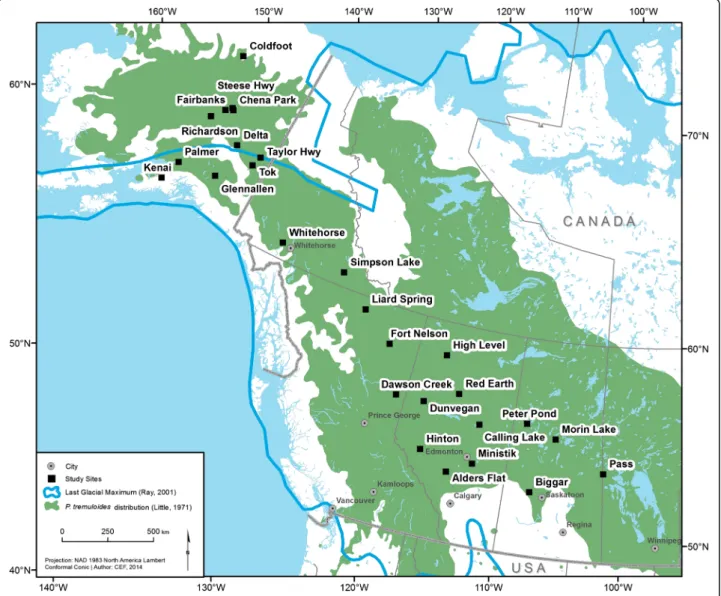
Samples were collected from 28 geo-referenced sampling sites covering the northwestern part of trembling aspen’s distribution from Manitoba to Alaska (51°18′40″ N to 67°25′30″ N; 101°40′37″ W to 150°08′38″ W; Fig. 1), which resulted in a total of 879 trembling aspen trees being sampled. A minimum of 15 trees was sampled from each of 28 sampling sites. We used leaf samples that were collected by a collaborating team from the University of Saskatchewan (Chena Park, Delta, Fairbanks, Richardson, Simpson Lake, Steese Hwy, Taylor Hwy, Tok and Whitehorse; 15 to 45 samples per location) and Utah State University/University of Alaska Fairbanks (Coldfoot, Glennallen, Hinton, Kenai, Liard Spring and Palmer; 30 samples per location). The rest of the samples were collected from root cambia (Alders Flat, Biggar, Calling Lake, Dawson Creek, Dunvegan, Fort Nelson, Glaslyn,
High Level, Ministik, Morin Lake, Pass, Peter Pond and Red Earth; 40 samples per location). Within sampling sites, samples were collected to reduce the chance of resampling the same clone. The maximum distances between sampled trees could vary from hundreds of meters to few kilometers. Leaves and root cambia were collected, dried in silica gel, and maintained at room temperature prior to DNA extraction.
DNA extraction, amplification and sequencing
DNA was extracted using Extract-N-AmpTM Plant kit (Sigma-Aldrich, St Louis, MO, USA) using the manufac-turer’s protocol. To evaluate genetic diversity and structure, microsatellite markers were selected because they are rap-idly evolving, powerful and economical tools for describing patterns of gene flow and diversity. Samples were amplified at 12 microsatellite loci: PTR1, PTR2, PTR3, PTR4, PTR6, PTR14, PMGC2571, WPMS14, WPMS15, WPMS16,
WPMS17, and WPMS20 (Additional file 1: Table S1) [27, 29–32]. Each PCR was performed on a 10 μL total volume: 2μL of a ten-fold diluted DNA extract (1:10 in ultra pure water); 5μL QIAGEN® Multiplex PCR Kit (Qiagen, Venlo, Limburg, The Netherlands); and 1μL H2O and 2 μL pri-mer mix solution at 2 μM, for a final concentration of 0.4 μM. PCR was carried out separately for each primer. Reactions were performed in a Mastercycler® pro Thermal Cyclers (Eppendorf, Hamburg, Germany) with the follow-ing protocol: an initial denaturation step at 95 °C for 15 min, followed by 36 cycles of 94 °C for 30 s; a primer-specific annealing temperature for 90 s; 72 °C for 60 s; and a final extension at 60 °C for 30 min. Annealing tempera-tures were 60 °C for PTR1, PTR2, PTR3, PTR4, WPMS14, WPMS17 and WPMS20 and 63 °C for PTR6, PMGC2571 and WPMS15. For PTR14 and VVPSM16, a touchdown PCR was applied with an annealing temperature ranging from 65 °C to 60 °C during the first ten cycles. PCR prod-ucts were analyzed on an Automated Capillary DNA Se-quencer (ABI 3730, Applied Biosystems, Foster City, CA, USA) using 2μL of multiplexed PCR products, which were added to 8.4 μL of Hi-Di™ Formamide and 0.11 μL of the GeneScan-500 LIZ size standard (Applied Biosystems). Allele sizes were scored using GENEMAPPER version 5.0 (Applied Biosystems).
Data manipulation
The original set of 879 samples was then reduced: i) by removing loci with high presence of individuals with three alleles (i.e., > 20 %; that was the case for PTR1 and PTR3); ii) by removing any sample with three alleles at one loci (putative triploid; [33]); and iii) by removing du-plicated genotypes (ramets) that were identical at all loci, to keep only one representative of each genotype. We used the software GENODIVE [34] to assign clone iden-tities based on the stepwise mutation model (SMM). In a stepwise mutation model, alleles that differ only by a few repeats in length are thought to be of more recent common ancestry than alleles that differ by many re-peats in length [34]. We considered that two individuals belonged to the same clone, if the total genetic distances (mutation frequency between two alleles) for all loci were lower than three mutations, to avoid identifying unique genotypes (genets) that had resulted from scoring errors and soma-clonal mutations (small gen-etic distances; [35]). Following this operation, the sub-set contained successively 879, 658 and 526 samples. From the 526 unique genotypes that were isolated from 10 microsatellite markers (without PTR1 and PTR3), populations with less than 7 unique trees were removed (the Glaslyn population) to maintain sufficiently high statistical power for the following analyses. The final dataset consisted of unique diploid genotypes for 10 loci, 523 genets for 27 populations.
Variation of genetic diversity
All descriptive genetic analyses were carried out with GenAlex v. 6.2 [36]. Allele frequency, allele number, pri-vate alleles (defined here as alleles found in a single population) and genetic estimates within populations, in-cluding the average number of alleles per locus (Na),
average number of effective alleles per locus (Ne),
ob-served heterozygosity (Ho), and expected heterozygosity
(He), were calculated using GenAlex v. 6.2 [36]. To
de-scribe genetic diversity within sampling areas across the range, allelic richness (AR) across all ten loci were calcu-lated using FSTAT v. 2.9.3 [37] with rarefaction, a method that was employed to account for differences in sample size. Correlations between AR and Hewere
com-puted, while Hardy-Weinberg (HW) equilibrium was assessed by calculating the inbreeding coefficients (Fis)
and their corresponding P-values for all sampling sites. We also ran a global test of HW equilibrium for all the samples pooled together. Bonferroni correction was applied when testing the significance of heterozygosity deficit and heterozygosity excess. All of the HW equilib-rium tests were performed in FSTAT [37]. Finally, values of AR and Ho were interpolated using the inverse
dis-tance weighting (IDW) method to create maps of each variable, using ArcMap (Esri, California, USA).
Genetic structure analyses
Mantel tests and correlograms, together with multivari-ate analysis of spatial patterns of genetic divergence (PCoA and RDA) were performed with the package ade4 [38] in the R statistical environment version 2.15.0 [39]. A global simple Mantel test was performed with the function mantel.rtest [38] to test for significant cor-relations between genetic (estimated by Fst; Additional
file 2: Table S2) and geographical distances (in kilome-ters) between sites, as well as isolation-by-distance pat-terns. Assumptions of linearity and homoscedasticity were checked before interpreting the results of the Mantel test [40]. The definition of distance classes, both in terms of the total number of classes and their upper and lower limits, is somewhat arbitrary and depends upon the spatial distribution of the populations [40]. A “rule-of-thumb” suggests four to five classes for 20 populations. The Mantel correlogram was constructed by plotting Mantel correlations between the genetic distances for 5 classes of geographical distances with the function mantel.correlog in the vegan package [41]. Particular care was taken to maintain a constant number of pairs of populations in each class creating unequal distance intervals. To complement the correlogram, we plotted the relationship between genetic and geographical distances, followed by plotting the genetic distance between two sites, which as estimated as Fst /(1-Fst), as a function of geographical distance. We finally performed an analysis of
molecular variance (AMOVA) in GenoDive [34]. Pairwise Fst were calculated for each population, together with its corresponding P-value, after which Bonferroni corrections were applied (initial P = 0.05; number of pairwise tests = 351; adjusted critical P = 0.05/351 = 0.00014).
The results of the Mantel test and correlogram were confirmed by multivariate analysis, which was carried out using the functions dudi.pco and pcaiv to calculate the respective PCoA and RDA ordinations [38]. PCoA was first applied to the Fst matrix (Additional file 2: Table S2), with the retention of the first five axes for further analyses. To analyze patterns in the genetic data, we performed RDA, using scores for the first five axes of the PCoA as the response variables, and longitudinal and latitudinal data as explanatory variables [42]. The output from the RDA, which was obtained with the function summary, provided the percentage of the un-constrained variation (PCoA axes representing the gen-etic differentiation) that was explained by the predictor (geographic location). The function randtest was used to evaluate the RDA significance by randomly permuting (Monte-Carlo test) the rows of the explanatory table [38].
To reveal genetic structure, and test whether the samples could be clustered according to their respective distribution zones, we used STRUCTURE v. 2.3.2 soft-ware [43]. The analyses were based on an admixture ancestral model. Correlated allele frequencies and a priori sampling locations were used as prior information (LOCPRIOR setting). LOCPRIOR was used to detect any further structures that could not be identified by standard settings [44]. Ten independent runs were per-formed for each value of K (1–27) with a burn-in of 100 000, followed by 200 000 MCMC iterations. The most likely value of K was determined using theΔK criterion [45]. STRUCTURE HARVESTER version 0.6.93 was used to extract the results and created a graphical plot of theΔK criterion [46]. The results were visualized for the best K, with DISTRUCT version 1.1 [47].
Finally, we computed a neighbour-joining tree (NJT) [48] to see how populations are genetically linked to one another, and whether clusters could be isolated similarly to the structuring that was found earlier. The NJT was constructed with POPTREE2 software [49] based on Nei’s standard genetic distance, Ds [50]. The neighbour-joining tree was bootstrapped 1000 times.
Population genetic bottleneck
M-ratios were estimated to detect historical bottlenecks at each site with the program MPval [51]. To interpret results of the M-ratios, we calculated the critical M-ratio (Mc) value for each population with the program M-crit, which was developed by JC Garza and EG Williamson [51]. To calculate Mc and M-ratios we used a
pre-bottleneck value (θ = 4 Neμ = 10; Ne, the effective
popu-lation size; the mutation rate, μ) and the parameters were set as recommended by JC Garza and EG William-son [51]. The settings were: a constant mutation rate (μ), which encompassed a range between 10−2and 10−6 mu-tants/generation/locus; probability of changes greater than one step, pg= 0.12; and the size of non-one-step
changes,Δg=2.8. Each set of simulations consisted of 10
000 iterations with the same values of θ for all sites under a two-phase mutation model (TPM). We consid-ered that a M-ratio below the critical value Mc was indi-cative of a population decline. To test for heterozygosity excess, Bottleneck version 1.2.02 [52] was used with a stepwise mutation model (SMM), an infinite allele model (IAM), and a two-phase model (TPM) with 12 % multi-step mutations and variance = 0.36 [53]. Mode shifts and heterozygosity excess are transient [54]. To determine which sampling locations had a significant heterozygote excess across loci, a standardized differences test was used. We also used the graphical method to assess bottleneck-induced distortions of allele frequency distri-butions that cause alleles at low frequency (<0.025) to become less abundant than alleles in one or more inter-mediate allele frequency classes (e.g. 0.025–0.050) [54]. In this method, the probability (power) of detecting a recent historical bottleneck of fewer than 20 breeding individuals is estimated to be 80 % with eight to ten microsatellite loci [54].
Results
Variation of genetic diversity
Over the entire population, the number of alleles that were observed per locus ranged from 10 (PTR2 and WPMS16) to 30 (PMGC2571; Additional file 1: Table S1). Our results showed that all 12 loci were highly poly-morphic and that PTR1 and PTR3 had a high rate of trial-lelic individuals (Additional file 3: Figure S1). These markers were therefore removed from further analysis. At the population level, AR averaged 4.63 and ranged from 3.94 (Peter Pond) to 5.22 (Kenai). Na ranged from 4.5
(Peter Pond and High Level) to 9.5 (Steese Hwy), with an average of 6.4 (Table 1). The mean Newas 3.5, with lowest
value being 2.9 (Richardson, High Level and Dawson Creek) and the highest being 4.3 (Kenai). Across all loci, only 34 individuals had one or more private alleles. Indi-viduals with private alleles were spread across all sampled sites (data not shown). Hohad a mean value of 0.629 and
was lowest in the Delta population (0.53) and highest in the Alders Flat population (0.76). The mean Hewas 0.625,
ranging from 0.57 (Pass and Dawson Creek) to 0.66 (Chena Park, Palmer and Red Earth; Table 1). The vari-ation in AR and Ho is represented on maps (Fig. 2) to
evaluate the spatial genetic variation visually. Higher genetic diversity was observed in Alberta and Alaska for
AR, but only in Alberta for Ho. We found a positive
cor-relation between AR and He (Pearson product-moment
correlation: r = 0.61; P < 0.001).
Patterns of genetic structure
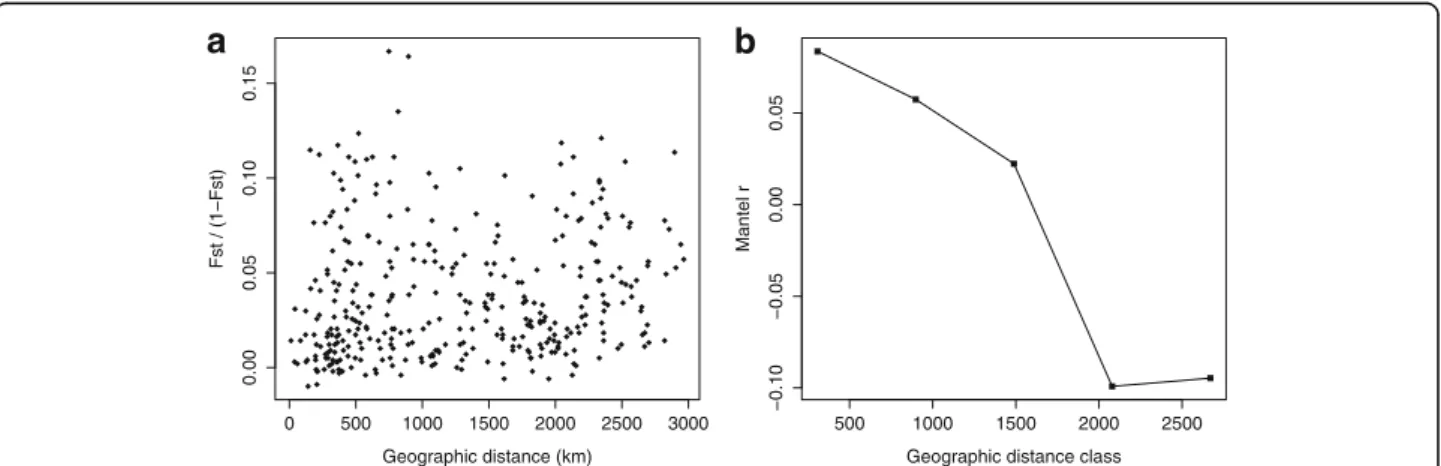
The genetic and the geographical distance matrices were not strongly correlated (Mantel test rm= 0.134; P =
0.024; Fig. 3). The results obtained with the Mantel test and the correlogram were confirmed by RDA (R2= 0.092; data not shown). The AMOVA (Table 2) indicated that 3.1 % of the genetic variation (Fst= 0.031) was
parti-tioned among populations and 96.9 % within populations (P < 0.001). No pairwise differences between populations, as estimated by Fst, appeared to be significant after apply-ing a Bonferroni correction (adjusted critical P = 0.00014; Additional file 2: Table S2).
Bayesian analysis did not demonstrate the presence of strong population genetic structuring. The most prob-able number of clusters that were detected by STRUC-TURE was K = 3 (ΔK = 5.9) and are displayed in blue, green and red (Fig. 4).
The results of the NJT (Fig. 4), which were based on Nei’s standard genetic distance, were consistent with the results of the Mantel test and RDA, showing low differen-tiation between sites. Populations that were genetically close to one another are not necessary spatially aggregated. Two clusters can be identified at increased confidence levels (bootstrap values > 50).
Population genetic bottlenecks
The M-ratio bottleneck test proved to be sensitive to the choice ofθ. Significant M-ratio values were obtained for
Table 1 Descriptive genetic composition of 27 Populus tremuloides populations in northwestern North America
Population Latitude Longitude N G ARa Na Ne Ho He Fis
Pass 53.603 −101.677 20 9 4.48 4.9 ± 0.69 3.1 ± 0.68 0.58 ± 0.09 0.57 ± 0.07 0.01 ± 0.08 Morin Lake 55.143 −106.072 34 19 4.46 5.8 ± 0.71 3.4 ± 0.56 0.64 ± 0.07 0.65 ± 0.05 0.01 ± 0.1 Biggar 52.315 −107.768 36 18 4.97 7.2 ± 0.94 3.5 ± 0.6 0.62 ± 0.05 0.64 ± 0.05 0.02 ± 0.06 Peter Pond 55.744 −108.776 14 11 3.94 4.5 ± 0.69 3.0 ± 0.52 0.72 ± 0.07 0.61 ± 0.04 −0.2 ± 0.11 Calling Lake 55.292 −112.970 36 26 5.08 8.5 ± 1.28 4.1 ± 1.09 0.58 ± 0.07 0.63 ± 0.07 0.05 ± 0.04 Red Earth 56.607 −115.308 33 29 4.82 7.9 ± 0.98 3.5 ± 0.61 0.64 ± 0.06 0.66 ± 0.05 0.01 ± 0.06 High Level 58.338 −117.237 18 10 4.06 4.5 ± 0.48 2.9 ± 0.36 0.65 ± 0.06 0.6 ± 0.05 −0.1 ± 0.09 Ministik 53.276 −112.932 31 14 4.11 5 ± 0.89 3.2 ± 0.54 0.68 ± 0.09 0.59 ± 0.07 −0.18 ± 0.13 Alders Flat 52.602 −114.964 26 16 3.98 5.2 ± 0.76 2.9 ± 0.36 0.76 ± 0.07 0.61 ± 0.04 −0.26 ± 0.13 Hinton 53.429 −117.531 22 22 4.92 7.6 ± 1.15 3.9 ± 0.92 0.62 ± 0.07 0.64 ± 0.05 0.05 ± 0.05 Dunvegan 55.828 −118.263 33 27 4.56 7.3 ± 0.96 3.5 ± 0.92 0.6 ± 0.06 0.61 ± 0.05 0 ± 0.04 Dawson Creek 55.778 −120.816 8 7 4.7 4.7 ± 0.7 2.9 ± 0.59 0.56 ± 0.07 0.57 ± 0.05 0.03 ± 0.05 Fort Nelson 58.111 −122.746 37 20 4.29 6 ± 1.13 3.4 ± 0.93 0.66 ± 0.06 0.6 ± 0.05 −0.11 ± 0.07 Liard Spring 59.355 −125.957 24 24 4.76 7.3 ± 0.98 3.9 ± 0.83 0.63 ± 0.07 0.65 ± 0.06 0.04 ± 0.03 Simpson Lake 60.676 −129.222 12 11 4.81 5.6 ± 0.64 3.3 ± 0.6 0.64 ± 0.06 0.63 ± 0.05 −0.01 ± 0.06 Whitehorse 60.784 −136.025 17 13 4.46 5.7 ± 0.99 3.3 ± 0.74 0.58 ± 0.07 0.59 ± 0.06 −0.01 ± 0.09 Taylor Hwy 63.887 −142.243 15 15 4.79 6.3 ± 1.04 3.7 ± 0.76 0.63 ± 0.05 0.63 ± 0.06 −0.03 ± 0.07 Tok 63.370 −142.566 26 26 4.51 6.9 ± 0.91 3.6 ± 0.81 0.6 ± 0.05 0.63 ± 0.05 0.05 ± 0.05 Delta 63.809 −145.094 12 12 4.83 5.8 ± 0.95 3.7 ± 0.99 0.53 ± 0.06 0.63 ± 0.05 0.17 ± 0.06 Glennallen 62.005 −145.341 29 29 4.87 7.5 ± 1.16 3.8 ± 0.83 0.61 ± 0.06 0.65 ± 0.06 0.06 ± 0.03 Chena Park 65.105 −147.531 15 15 4.82 5.9 ± 0.69 3.7 ± 0.75 0.71 ± 0.07 0.66 ± 0.05 −0.07 ± 0.09 Steese Hwy 65.161 −147.743 58 56 4.89 9.5 ± 1.27 4.1 ± 1.04 0.65 ± 0.05 0.65 ± 0.05 0 ± 0.04 Fairbanks 64.902 −148.277 9 9 4.67 5.1 ± 0.43 3.3 ± 0.56 0.63 ± 0.05 0.63 ± 0.05 −0.02 ± 0.07 Richardson 64.267 −149.200 10 10 4.47 5.4 ± 0.52 2.9 ± 0.31 0.63 ± 0.05 0.6 ± 0.05 −0.05 ± 0.04 Palmer 61.581 −149.249 27 27 4.81 7.5 ± 1.28 3.9 ± 0.9 0.6 ± 0.06 0.66 ± 0.05 0.08 ± 0.05 Kenai 60.480 −149.724 17 17 5.22 7.3 ± 1.05 4.3 ± 0.96 0.65 ± 0.07 0.65 ± 0.07 −0.01 ± 0.06 Coldfoot 67.425 −150.144 31 31 4.85 8 ± 1.22 3.8 ± 0.91 0.6 ± 0.05 0.65 ± 0.05 0.07 ± 0.04
N number of sampled trees genotyped, G number of unique genotypes used in the analyses, AR allelic richness, Naaverage number of alleles per locus, Ne
average number of effective alleles per locus, Hoobserved heterozygosity, Heexpected heterozygosity, Fisinterbreeding coefficient
a
all sites using values ofθ = 1 (data not shown). Statistical significance to detected historical bottlenecks was main-tained in 16 populations with higher values of θ (10), where M-ratio < Mc (Alders Flat, Biggar, Calling Lake, Chena Park, Coldfoot, Fort Nelson, Glennallen, High Level, Liard Spring, Ministik, Morin Lake, Palmer, Red Earth, Simpson Lake, Tok and Whitehorse) [51]. Across all populations and loci, M-ratio varied from 0.583 (High Level) to 0.791 (Steese Hwy; Table 3). Recent bottlenecks with heterozygote excess were detected in six popula-tions (Biggar, Coldfoot, Dawson Creek, Dunvegan, Richardson and Tok; P < 0.05), using TPM (Table 3). The graphical method detected recent population bottle-necks in 6 populations (Biggar, Fairbanks, Pass, Morin Lake, Simpson Lake and Tailor Hwy; Additional file 3: Figure S1). Results from the heterozygote excess test and
the graphical method were consistent only for 1 popula-tion (Biggar).
Discussion
The purpose of this study was to ascertain whether the origin of trembling aspen in northwestern North America is reflected in the patterns of genetic diversity and population structure. Contrary to our hypothesis, microsatellite markers revealed little to no genetic structure in P. tremuloides populations and indicated little isolation by distance (IBD). Consequently, no divergent populations were observed near supposed refugia suggesting no evidence that Beringia or the “ice-free corridor” were refugia for trembling aspen. Finally, favorable conditions for sexual reproduction and successful trembling aspen seedling establishment could Fig. 2 Interpolation of (a) allelic richness (AR) and (b) observed heterozygosity (Ho) across the range of Populus tremuloides based on average AR and Hovalues at each sampling site. Across the range, AR and Horespectively varied from 3.94 (Peter Pond) to 5.22 (Kenai) and from 0.542 (Delta) to 0.762 (Alders Flat). Red represents areas of higher values and yellow represents areas of lower values
0 500 1000 1500 2000 2500 3000 0.00 0.05 0.10 0.15 Geographic distance (km) Fst / (1−Fst)
a
500 1000 1500 2000 2500 −0.10 −0.05 0.00 0.05Geographic distance class
Mantel r
b
Fig. 3 Isolation by distance patterns: a Each point represents the genetic distance Fst between two sites as a function of geographical distance (km); b Mantel correlogram for 5 geographic distance classes based on Fstgenetic distances
have contributed to the highest AR and lowest Hothat were
observed in Alberta foothills of the Rocky Mountains.
Genetic diversity and structure
Our results support the findings of Callahan et al. [27], who found no genetic structuring among populations in the northern part of aspen’s range. Trees are known to have low differentiation at neutral molecular markers,
indicating high levels of gene flow among populations [55, 56]. We observed low levels of differentiation and variation in genetic distance between populations (Figs. 3 and 4). Specific aspen traits, such as outbreeding, wind pollination, aeolian seed dispersal, high seed production and/or longevity, can account for this observation. In addition, there was no pronounced pattern of IDB, even at great distances (Fig. 3). We were not able to detect local genetic structure patterns. This indicates that aspen populations in the northern portion of the species range experience high levels of gene flow, making it difficult to identify refugia.
The Rocky Mountains foothills of Alberta, which could have remained ice-free during the last glacial maximum (LGM; [20]), exhibited higher genetic diversity (AR), which is consistent with the observations of Callahan et al. [27]. Moreover, no divergent lineages or specific pri-vate alleles were found in this area or north of this
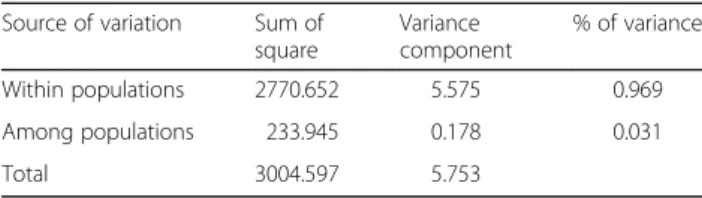
Table 2 Results of analysis of molecular variance (AMOVA) for Populus tremuloides in northwestern North America (n = 523 genets), based on microsatellite allele frequencies
Source of variation Sum of square Variance component % of variance Within populations 2770.652 5.575 0.969 Among populations 233.945 0.178 0.031 Total 3004.597 5.753
Fig. 4 Neighbour-joining tree obtained using Nei’s distance matrix for 27 populations of Populus tremuloides with data obtained from 10 polymorphic microsatellite loci. The numbers represent the bootstrap values as percentages. On the right side are the STRUCTURE results graphically displayed to show, for each sample, the probability of belonging to each of the 3 groups detected
region in Beringia. The lack of detectable refugia in Beringia and in the “ice-free corridor” was due to high levels of gene flow between trembling apsen populations. We agree that the Alberta foothills were not an area of admixture because we don’t have highly differentiated populations. More favorable environmental conditions for sexual reproduction and successful trembling aspen seed-ling establishment in this area [57, 58] may have contrib-uted to increase allelic richness through recombination in
populations from the Albertan foothills of the Rocky Mountains. The existence of a refugium in Beringia during the LGM has been reported for P. glauca [9, 23] and was consistent with the model simulation of suitable refugial habitats for this species (performed with the Community Climate Model and the Geophysical Fluid Dynamics La-boratory Model) [8], which suggested the presence of P. glauca in Beringia during the LMG. Moreover, those simulations also suggested the presence of suit-able habitats for P. contorta and P. tremuloides in Beringia [8]. For the closely related species P. balsa-mifera, recent molecular evidence did not support Beringia as a glacial refugium, but confirmed the ex-istence of two distinct clusters in our sample area of northwestern North America [12].
Population genetic bottlenecks
The M-ratio bottleneck test proved to be sensitive to the choice ofθ, with significant M-ratio values being obtained for all sites using values ofθ = 1. The M-ratio detected per-sistent bottleneck signatures in 16 populations withθ = 10. Low M-ratios that were detected indicate that these 16 populations might have suffered from demographic declines, although they were not severely reduced in their genetic potential. We did not detect strong evidence for excess heterozygosity. Consistent results were obtained only for 1 population. Indeed, wild populations are rarely com-pletely closed and even small numbers of migrants can mask the genetic signature of bottlenecks [59, 60]. Under TPM, the populations that were subject to a recent reduc-tion in size (Biggar, Coldfoot, Dawson Creek, Dunvegan, Richardson and Tok) were not spatially clustered and were present all over the sampled territory without showing any sign of spatial structure. Large effective population size implies that polymorphisms can persist during extended periods of time [56], even during reduction of the species distributional range. At low effective population sizes, asexual reproduction might better preserve heterozygosity than outcrossing at least in the short-term [56], hereby masking recent reductions in population size.
Conclusion
Most of the studies that have detected phylogeographic patterns in boreal tree species in western North America (reviewed by [13]) have used uniparental inherited cpDNA [23], mtDNA markers [61], or more recently genomic data (e.g., SNPs) [12]. For P. glauca, LL Anderson, FS Hu and KN Paige [9] suggested that the greater relative rate of mutation of nuclear microsatellites may allow finer scale resolution of the historic dynamics of popula-tions (including the number, location, and population sizes of refugia), compared to chloroplast DNA that have extremely slow mutation rates (estimated to be 5.3 × 10⁻⁹ mutations per gene per generation). Their
Table 3 Results of bottleneck analyses performed with the software Bottleneck version 1.2.02 (Cornuet and Luikart, [52]) and the program MPval [51] to calculate the M-ratio and M-critical withθ = 10 for each of the 27 populations
Population He P-TPM P-SMM P-IAM M-Ratioa Mcb
Pass 0,607 0,393 0.372 0.436 0,641 0,624 Morin Lake 0,663 0,374 0.058 0.339 0,615 0,696 Biggar 0,658 0,014 0.002 0.176 0,687 0,694 Peter Pond 0,636 0,366 0.613 0.297 0,665 0,647 Calling Lake 0,638 0,058 0.014 0.170 0,684 0,723 Red Earth 0,667 0,063 0.002 0.378 0,698 0,73 High Level 0,632 0,596 0.386 0.304 0,583 0,634 Ministik 0,617 0,563 0.443 0.272 0,642 0,671 Alders Flat 0,63 0,183 0.066 0.308 0,646 0,682 Hinton 0,659 0,175 0.060 0.182 0,748 0,71 Dunvegan 0,618 0,013 0.002 0.380 0,754 0,722 Dawson Creek 0,611 0,008 0.008 0.018 0,637 0,597 Fort Nelson 0,613 0,386 0.376 0.573 0,687 0,701 Liard Spring 0,662 0,373 0.002 0.629 0,705 0,714 Simpson Lake 0,658 0,057 0.012 0.383 0,6 0,647 Whitehorse 0,613 0,055 0.058 0.608 0,614 0,664 Taylor Hwy 0,655 0,057 0.013 0.398 0,704 0,676 Tok 0,644 0,014 0.002 0.355 0,653 0,723 Delta 0,657 0,063 0.051 0.397 0,716 0,655 Glennallen 0,658 0,056 0.000 0.376 0,723 0,73 Chena Park 0,682 0,631 0.395 0.595 0,656 0,676 Steese Hwy 0,656 0,059 0.015 0.372 0,791 0,767 Fairbanks 0,67 0,167 0.058 0.611 0,663 0,624 Richardson 0,633 0,017 0.002 0.065 0,682 0,634 Palmer 0,668 0,06 0.014 0.365 0,674 0,722 Kenai 0,674 0,368 0.173 0.382 0,699 0,688 Coldfoot 0,659 0,002 0.000 0.375 0,727 0,734
Values in bold show a significant bottleneck detected
For the heterozygosity excess test, we tested a stepwise mutation model, an infinite alleles model and a two-phase mutation model with 12 % multistep mutations and a variance = 0.36. M-ratio average was calculated across loci. Mc is the critical M-value calculated through the M-crit program developed
by Garza and Williamson [51]. M-ratio test is significant if M-Ratio < Mc
a
M-Ratio = number of alleles/range in allele size and range (size of largest allele - size of smallest allele + 1)
b
Mc is defined such that only 5 % of the simulation values fall below this threshold
results with nuclear microsatellite markers support the idea that north-central Alaska served as a glacial refugium during the last glacial maximum for white spruce. Three genetic groups were detected: the first consisted of one population from north-central Alaska (the northern-most population sampled in Alaska, Dalton Highway); the second with one population from southern Manitoba; and the last group included the remaining 20 populations (ranging from Wisconsin and continuing a northwestwardly fashion into southern and central Alaska) forming the last group. These results re-vealed that there is not much structure and differentiation to be found for this boreal species, a result similar to what we found in trembling aspen. For P. tremuloides, Callahan et al. [27] found 2 distinct groups, with significant cor-relation of genetic and geographical distances and low AR, solely in the southwestern USA, but nothing in Beringia. Our study did not find any structuring in northwestern North America. The historic dynamics of the populations vary from one species to another. In conclusion, future studies should combine different approaches and molecular analyses to elucidate the glacial origin and post-glacial migration route in the northwestern part of the species’ range.
Additional files
Additional file 1: Table S1. Primer sequences, size range (in base pairs; bp) and number of alleles observed for 12 microsatellite loci of Populus tremuloides. (DOC 44 kb)
Additional file 2: Table S2. Table of pairwise Fstand corresponding differentiation for the 27 populations sampled obtained with Genodive (Meirmans and Van Tienderen, [34]). The lower diagonal represents the Fst values and the upper diagonal represents the associated P-values obtained with 1000 iterations. **represents the significant differences following Bonferoni correction (adjusted critical P = 0.00014) and ns means“not significant”. (DOC 111 kb)
Additional file 3: Figure S1. Allele frequency distribution for the 6 populations that experienced bottlenecks. Histograms were created based on 10 microsatellite loci. The Y-axis represents the number of alleles per class of frequency. (TIF 6077 kb)
Acknowledgements
We thank Dr. Karen Mock (Utah State University) for sharing her database, Dr. Edmund C. Packee (University of Alaska Fairbanks) for sampling in Alaska, as well as Xanthe Walker (University of Saskatchewan) for providing samples from Alaska and Yukon. We thank Dr. E.H. (Ted) Hogg (Northern Forestry Center, Canadian Forest Service) for providing full access to the CIPHA (Climate Impacts on Productivity & Health of Aspen) network in western Canada. We also thank the Centre d’Étude de la Forêt (CEF) professionals, especially Mélanie Desrochers for providing the maps and William F. J. Parsons for careful editing of the manuscript. We also thank the anonymous reviewers that helped improving an earlier version of the manuscript. Funding
A Natural Sciences and Engineering Research Council of Canada (NSERC) strategic grant (NSERC-SPS 380893–09) to Yves Bergeron supported this project. Availability of data and materials
The raw nuclear microsatellite data set is available in the Dryad digital repository, with the following reference: Latutrie M, Bergeron Y, Tremblay F
Data from: Fine-scale assessment of genetic diversity of trembling aspen in northwestern North America. BMC Evolutionary Biology. http://dx.doi.org/ 10.5061/dryad.6q5g3.
Authors’ contributions
The three authors have contributed significantly to the work reported in the manuscript. ML was a Ph.D. student under the supervision of FT and YB, and contributed to the study conception and its experimental design, conducted the field and laboratory work, analyzed the data and prepared the initial drafts of the manuscript. FT and YB are the two principal investigators of the project and contributed to the conception of the study and its experimental design, performed some data analysis, provided overall research guidance and direction and funding, and prepared and revised the manuscript. All authors have read and approved the final manuscript.
Competing interests
The authors declare that they have no competing interests. Consent for publication
Not applicable.
Ethics approvals and consent to participate Not applicable.
Received: 9 March 2016 Accepted: 14 October 2016
References
1. Hewitt G. The genetic legacy of the Quaternary ice ages. Nature. 2000;405:907–13. 2. Excoffier L, Foll M, Petit RJ. Genetic consequences of range expansions. Annu
Rev Ecol Evol Syst. 2009;40:481–501.
3. Taberlet P, Fumagalli L, Wust-Saucy A-G, Cosson J-F. Comparative phylogeography and postglacial colonization routes in Europe. Mol Ecol. 1998;7:453–64.
4. Austerlitz F, Jung-Muller B, Godelle B, Gouyon P-H. Evolution of coalescence times, genetic diversity and structure during colonization. Theor Popul Biol. 1997;51:148–64.
5. Hewitt GM. Some genetic consequences of ice ages, and their role in divergence and speciation. Biol J Linn Soc. 1996;58:247–76.
6. Dyke AS, Moore A, Robertson L. Deglaciation of North America. Ontario: Geological Survey of Canada Ottawa; 2003. Available at: http://geoscan.nrcan.gc. ca/starweb/geoscan/servlet.starweb?path=geoscan/fulle.web&search1=R=214399. 7. Williams JW. Variations in tree cover in North America since the last glacial
maximum. Global Planet Change. 2003;35:1–23.
8. Roberts DR, Hamann A. Glacial refugia and modern genetic diversity of 22 western North American tree species. Proc R Soc Lond B Biol. 2015;282:20142903. 9. Anderson LL, Hu FS, Paige KN. Phylogeographic history of white spruce
during the last glacial maximum: uncovering cryptic refugia. J Hered. 2011; 102:207–16.
10. Beatty GE, Provan JIM. Refugial persistence and postglacial recolonization of North America by the cold-tolerant herbaceous plant Orthilia secunda. Mol Ecol. 2010;19:5009–21.
11. de Lafontaine G, Turgeon J, Payette S. Phylogeography of white spruce (Picea glauca) in eastern North America reveals contrasting ecological trajectories. J Biogeogr. 2010;37:741–51.
12. Keller SR, Olson MS, Silim S, Schroeder W, Tiffin P. Genomic diversity, population structure, and migration following rapid range expansion in the Balsam Poplar, Populus balsamifera. Mol Ecol. 2010;19:1212–26.
13. Shafer A, Cullingham CI, Cote SD, Coltman DW. Of glaciers and refugia: a decade of study sheds new light on the phylogeography of northwestern North America. Mol Ecol. 2010;19:4589–621.
14. Marr KL, Allen GA, Hebda RJ. Refugia in the Cordilleran ice sheet of western North America: chloroplast DNA diversity in the Arctic-alpine plant Oxyria digyna. J Biogeogr. 2008;35:1323–34.
15. Callahan CM. Continental-scale characterization of molecular variation in quaking aspen. Logan: Utah State University; 2012.
16. Mandryk CAS, Josenhans H, Fedje DW, Mathewes RW. Late Quaternary paleoenvironments of Northwestern North America: implications for inland versus coastal migration routes. Quat Sci Rev. 2001;20:301–14.
17. Arnold TG. Radiocarbon dates from the ice-free corridor. Radiocarbon. 2002; 44:437–54.
18. Jackson LE, Wilson MC. The ice-free corridor revisited. Geotimes. 2004;49:16–9. 19. Brunsfeld SJ, Sullivan J. A multi-compartmented glacial refugium in the
northern Rocky Mountains: evidence from the phylogeography of Cardamine constancei (Brassicaceae). Conserv Genet. 2005;6:895–904.
20. Loehr J, Worley K, Grapputo A, Carey J, Veitch A, Coltman DW. Evidence for cryptic glacial refugia from North American mountain sheep mitochondrial DNA. J Evol Biol. 2006;19:419–30.
21. Abbot RJ, Smith LC, Milne RI, Crawford RMM, Wolff K, Balfour J. Molecular analysis of plant migration and refugia in the arctic. Science. 2000;289:1343–6. 22. Anderson CD, Epperson BK, Fortin M-J, Holderegger R, James PMA, Rosenberg
MS, Scribner KT, Spear S. Considering spatial and temporal scale in landscape-genetic studies of gene flow. Mol Ecol. 2010;19:3565–75.
23. Anderson LL, Hu FS, Nelson DM, Petit RJ, Paige KN. Ice-age endurance: DNA evidence of a white spruce refugium in Alaska. Proc Natl Acad Sci U S A. 2006;103:12447–50.
24. Brubaker LB, Anderson PM, Edwards ME, Lozhkin AV. Beringia as a glacial refugium for boreal trees and shrubs: new perspectives from mapped pollen data. J Biogeogr. 2005;32:833–48.
25. Peros MC, Gajewski K, Viau AE. Continental-scale tree population response to rapid climate change, competition and disturbance. Glob Ecol Biogeogr. 2008;17:658–69.
26. Hu FS, Brubaker LB, Anderson PM. Postglacial vegetation and climate change in the northern Bristol bay region, southwestern Alaska. Quat Res. 1995;43:382–92.
27. Callahan CM, Rowe CA, Ryel RJ, Shaw JD, Madritch MD, Mock KE. Continental-scale assessment of genetic diversity and population structure in quaking aspen (Populus tremuloides). J Biogeogr. 2013;40:1780–91.
28. Levson VM, Rutter NW. Evidence of Cordilleran late wisconsinan glaciers in the ‘ice-free corridor’. Quat Int. 1996;32:33–51.
29. Dayanandan S, Rajora OP, Bawa KS. Isolation and characterization of microsatellites in trembling aspen (Populus tremuloides). Theor Appl Genet. 1998;96:950–6.
30. Rahman MH, Dayanandan S, Rajora OP. Microsatellite DNA markers in Populus tremuloides. Genome. 2000;43:293–7.
31. Smulders MJM, Van Der Schoot J, Arens P, Vosman B. Trinucleotide repeat microsatellite markers for black poplar (Populus nigra L.). Mol Ecol Notes. 2001;1:188–90.
32. Tuskan GA, DiFazio S, Jansson S, Bohlmann J, Grigoriev I, Hellsten U, Putnam N, Ralph S, Rombauts S, Salamov A, et al. The genome of black cottonwood, Populus trichocarpa (Torr. & Gray). Science. 2006;313:1596–604.
33. Mock KE, Callahan CM, Islam-Faridi MN, Shaw JD, Rai HS, Sanderson SC, Rowe CA, Ryel RJ, Madritch MD, Gardner RS, et al. Widespread triploidy in western North American aspen (Populus tremuloides). PLoS One. 2012;7: e48406. doi:10.1371/journal.pone.0048406.
34. Meirmans PG, Van Tienderen PH. genotype and genodive: two programs for the analysis of genetic diversity of asexual organisms. Mol Ecol Notes. 2004;4:792–4. 35. Ally D, Ritland K, Otto SP. Can clone size serve as a proxy for clone age?
An exploration using microsatellite divergence in Populus tremuloides. Mol Ecol. 2008;17:4897–911.
36. Peakall ROD, Smouse PE. Genalex 6: genetic analysis in Excel. Population genetic software for teaching and research. Mol Ecol Notes. 2006;6:288–95.
37. Goudet J. FSTAT, a program to estimate and test gene diversities and fixation indices (version 2.9.3). Heredity. 2001;97:418–26. Available at: http://www2.unil.ch/popgen/softwares/fstat.htm.
38. Dray S, Dufour A-B. The ade4 package: implementing the duality diagram for ecologists. J Stat Softw. 2007;22:1–20.
39. R Development Core Team. R: A language and environment for statistical computing. Vienna: R Foundation for Statistical Computing; 2013. Available at: http://www.R-project.org/.
40. Diniz-Filho JAF, Soares TN, Lima JS, Dobrovolski R, Landeiro VL, Telles MPC, Rangel TF, Bini LM. Mantel test in population genetics. Genet Mol Biol. 2013; 36:475–85.
41. Oksanen J, Blanchet FG, Kindt R, Legendre P, Minchin PR, O’Hara RB, Simpson GL, Solymos P, Stevens MHH, Wagner H. Package‘vegan’. In: Community ecology package. 2013. R package version 2.0-10. Available at: http://cran.r-project.org/ web/packages/vegan/index.html.
42. Legendre P, Legendre L. Numerical ecology, 3rd English edn. The netherlands: Elsevier, Amsterdam; 2012.
43. Pritchard JK, Stephens M, Donnelly P. Inference of population structure using multilocus genotype data. Genetics. 2000;155:945–59.
44. Hubisz MJ, Falush D, Stephens M, Pritchard JK. Inferring weak population structure with the assistance of sample group information. Mol Ecol Resour. 2009;9:1322–32.
45. Evanno G, Regnaut S, Goudet J. Detecting the number of clusters of individuals using the software STRUCTURE: a simulation study. Mol Ecol. 2005;14:2611–20.
46. Earl DA, vonHoldt BM. STRUCTURE HARVESTER: a website and program for visualizing STRUCTURE output and implementing the Evanno method. Conserv Genet Resour. 2011;4:359–61.
47. Rosenberg NA. DISTRUCT: a program for the graphical display of population structure. Mol Ecol Notes. 2004;4:137–8.
48. Saitou N, Nei M. The neighbor-joining method: a new method for reconstructing phylogenetic trees. Mol Biol Evol. 1987;4:406–25. 49. Takezaki N, Nei M, Tamura K. POPTREE2: Software for constructing population
trees from allele frequency data and computing other population statistics with Windows interface. Mol Biol Evol. 2010;27:747–52.
50. Nei M. Molecular evolutionary genetics. New York: Columbia University Press; 1987.
51. Garza JC, Williamson EG. Detection of reduction in population size using data from microsatellite loci. Mol Ecol. 2001;10:305–18.
52. Cornuet JM, Luikart G. Description and power analysis of two tests for detecting recent population bottlenecks from allele frequency data. Genetics. 1996;144:2001–14.
53. Piry S, Luikart G, Cornuet J-M. BOTTLENECK: a program for detecting recent effective population size reductions from allele data frequencies. J Hered. 1999;90:502–3.
54. Luikart G, Allendorf FW, Cornuet JM, Sherwin WB. Distortion of allele frequency distributions provides a test for recent population bottlenecks. J Hered. 1998; 89:238–47.
55. McKay JK, Latta RG. Adaptive population divergence: markers, QTL and traits. Trends Ecol Evol. 2002;17:285–91.
56. Petit RJ, Hampe A. Some evolutionary consequences of being a tree. Ann Rev Ecol Evol Syst. 2006;37:187–214.
57. Landhäusser SM, Deshaies D, Lieffers VJ. Disturbance facilitates rapid range expansion of aspen into higher elevations of the Rocky Mountains under a warming climate. J Biogeogr. 2010;37:68–76.
58. Ding C. Ecological and quantitative genetics of Populus tremuloides in western Canada. Edmonton: University of Alberta; 2015.
59. Peery MZ, Kirby R, Reid BN, Stoelting R, Doucet‐Beer E, Robinson S, Vasquez‐ Carrillo C, Pauli JN, Palsboll PJ. Reliability of genetic bottleneck tests for detecting recent population declines. Mol Ecol. 2012;21:3403–18. 60. Keller LF, Jeffery KJ, Arcese P, Beaumont MA, Hochachka WM, Smith JNM,
Bruford MW. Immigration and the ephemerality of a natural population bottleneck: evidence from molecular markers. Proc R Soc Lond B Biol. 2001;268:1387–94.
61. Jaramillo‐Correa JP, Beaulieu J, Bousquet J. Variation in mitochondrial DNA reveals multiple distant glacial refugia in black spruce (Picea mariana), a transcontinental North American conifer. Mol Ecol. 2004;13:2735–47.
• We accept pre-submission inquiries
• Our selector tool helps you to find the most relevant journal
• We provide round the clock customer support
• Convenient online submission
• Thorough peer review
• Inclusion in PubMed and all major indexing services
• Maximum visibility for your research Submit your manuscript at
www.biomedcentral.com/submit