Université de Montréal
MARCH1: New insights in the activation of B cells
Par
Tristan Paul Galbas
Département de Microbiologie et d’Immunologie Faculté de Médecine
Mémoire présenté à la Faculté des études supérieures En vue de l’obtention du grade de
Magister Sciencae (M.Sc) En Microbiologie et Immunologie
Septembre 2011 © Tristan Paul Galbas, 2011
University of Montreal
This memoir:
MARCH1: New insights in the activation of B cells
Presented by Tristan Paul Galbas
Has been evaluated by a jury composed of:
President of drafting committee: Dr. Louis DeRepentigny
Research director: Dr. Jacques Thibodeau
Member of the jury: Dr. Walid Mourad
September 2011 © Tristan Paul Galbas, 2011
RÉSUMÉ
L’implication des cellules B dans le développement de l’auto-immunité ne cesse d’être illustrée par de récentes publications. Les cellules présentent des peptides du soi aux cellules T auto-réactives ce qui mène à la production de cytokines pro-inflammatoires et d’anticorps auto-réactifs. Dans le présent document, nous explorons la présentation antigénique et la modification post-traductionnelle du complexe majeur d’histocompatibilité II (CMH-II). MARCH1 est une E3 ubiquitine ligase qui cible le CMH-II et le relocalise le complexe vers les endosomes de recyclage. Ainsi, MARCH1 est un inhibiteur de la présentation d’antigènes exogènes. Ici, nous démontrons que MARCH1 est exprimé seulement dans la sous-population des cellules B folliculaires et que cette expression est perdue lors de l’entrée dans les centres germinatifs. Nous proposons que MARCH1 établie une barrière de formation de centres germinatifs. Nous démontrons le lien entre MARCH1 et la hausse de CMH-II à la surface des cellules B à la suite d’un traitement à l’IL-10. De plus, nous avons testé plusieurs stimuli activateurs des cellules B et démontrons que MARCH1 est régulé à la baisse dans tous les cas. De plus, nous mettons en valeurs le rôle de la voie canonique d’activation de NF-κB dans cette régulation de MARCH1. Finalement, nous avons développé un système de lentivirus exprimant MARCH1 qui nous permet de forcer l’expression de MARCH1 dans des cellules réfractaires à la transfection. Nous discutons de l’implication de cette régulation du CMH-II par MARCH1 dans le développement de maladies auto-immunes.
Mots clés : CMH-II, MARCH1, Cellules B, Auto-immunité, présentation antigénique.
ABSTRACT
Increasing evidence suggests a major role for B cells in the onset of auto-immune diseases. B cells present self-antigens to auto-reactive T cells which leads to the production of pro-inflammatory cytokines and auto-immune antibodies. Here we look at the process of antigen presentation and at post-transcriptional modifications of the MHC-II molecule. MARCH1 is an E3 ubiquitin ligase which targets MHC-II and re-localises the complex into recycling endosomes. Thus, MARCH1 is a direct inhibitor of exogenous antigen presentation. Here we show that only follicular B cells express MARCH1 and that upon germinal center entry, these cells lose all traces of MARCH1. We propose that MARCH1 may establish a threshold for germinal center creation. Moreover we demonstrate that the well-established increase in surface MHC-II induced by IL-10 on murine B cells is a result of a decrease in MARCH1 expression. We tested different B cell activation stimuli and showed that upon activation, MARCH1 mRNA is decreased in a time-dependent manner. In addition, we demonstrate the implication of the canonical NF-κB pathway in this regulation. Finally, we developed a lentiviral vector system expressing MARCH1 which enables us to force the expression of our target protein in non-transfectable cell types. We discuss the implication of MARCH1 in the presentation of self-antigens to auto-reactive T cells and the generation of auto-immunity.
TABLE OF CONTENTS ABSTRACT RÉSUMÉ TABLE OF CONTENTS LIST OF FIGURES LIST OF ABBREVIATIONS
CHAPTER 1 – LITERATURE REVIEW 1.0 The immune response 1.1 B cells
1.1.1 Origin 1.1.2 Function
1.1.2.1 Follicular B cells 1.1.2.2 Marginal zone B cells 1.1.2.3 B1 B cells 1.1.3 Pathology 1.1.4 Transplantation 1.1.5 Rituximab 1.2 B cell activation 1.2.1 BCR 1.2.2 TLR 1.2.3 CD40 1.2.4 IL-10 1.3 Antigenic presentation 1.3.1 HLA genes 1.3.2 MHC-I 1.3.3 MHC-II
1.3.4 MHC-II structure 1.4 Ubiquitination
1.5 MARCHs 1.6 Lentiviruses
1.7 Hypothesis and objectives
CHAPTER 2 – MATERIALS AND METHODS 2.1 Lentiviral vector production 2.2 Transduction
2.3 Chemical compounds 2.4 Plasmids
2.5 Cell culture and transfections 2.6 Mice and immunizations 2.7 Antibodies
2.8 Real-Time quantitative PCR
CHAPTER 3 – RESULTS
3.1 MARCH1 is only expressed in follicular B cells 3.2 MARCH1 is down-regulated upon B cell activation 3.3 IL-10 has no effect in FO-devoid B cells
3.4 MARCH1 down-modulation is NF-κB dependent 3.5 MHC-II-BTK complex – MARCH1
3.6 Forced expression of MARCH1 with lentiviruses
CHAPTER 4 – DISCUSSION CHAPTER 5 – CONCLUSION CHAPTER 6 – REFERENCES
FIGURE LIST
Chapter 1.
Figure 1.1. Murine B cell development.
Figure 1.2. A schematic view of the anatomy of the spleen. Figure 1.3. Marginal versus follicular fate.
Figure 1.4. BCR downstream transduction pathways. Figure 1.5. TLR4 downstream transduction pathways. Figure 1.6. CD40 downstream transduction pathways. Figure 1.7. IL-10 downstream transduction pathways. Figure 1.8. The human HLA complex genes.
Figure 1.9. MHC-I and MHC-II structure. Figure 1.10.The ubiquitination process.
Chapter 3.
Figure 3.1. MARCH1 is only expressed in follicular B cells.
Figure 3.2 MARCH1 mRNA is down-regulated upon activation of B cells.
Figure 3.3 IL-10 has no effect on MHC-II surface expression in FO-devoid XID splenocytes.
Figure 3.4 The LPS-driven down-modulation of MARCH1 is NF-κB dependent. Figure 3.5. Impaired TLR signaling in follicular B cells/MARCH1 deficient mice. Figure 3.6. Transduction of HEK293-CIITA cells with a lentiviral vector expressing the MARCH1 gene.
ABBREVIATION LIST
APC – Antigen presenting cells BCR – B cell receptor
CIITA – Class-II-transactivator FO B cell – Follicular B cell GC – Germinal center
GVHD – Graft-versus-host disease HLA – Human Leukocyte antigen HSC - Haematopoietic stem cell IFN - Interferon
Ig – Immunogobulin IL – Interleukin
LPS – Lipopolysaccharides MHC – Major Histocompatibility MZ B cell – Marginal zone B cell PCR – Polymerase chain reaction TCR – T cell receptor
TLR – Toll-like receptor TNF – Tumor necrosis factor
CHAPTER 1 - LITERATURE REVIEW
1.0 The Immune response
To achieve a successful protection against invading pathogens of all sorts, a tightly regulated and coordinated response of the two branches of the immune response must be attained. The first obstacle against these attacks is known as the innate arm of the immune system and consists of mechanical barriers and non-specific cellular responses. In contrast, the second branch, the adaptive immune system, finds its meaning in multiple features such as specificity, memory and self-nonself discrimination. The development of the adaptive arm relies on the coordinated action of dendritic cells and B and T lymphocytes in response to antigenic stimulation. While dendritic cells are better antigen presenting cells than B cells or macrophages, their functions have been largely characterised in regard to MHC-II and antigen presentation. Here, we will try to bring some light onto the regulation of MHC-II molecules and some key related mechanisms in B cells.
1.1 B lymphocytes
1.1.1 Origin
B cells originate from pluripotent haematopoietic stem cells (HSC)1. B cell development begins in the bone marrow with the differentiation of the HSC which leads to the generation of pre-pro-B cells. It’s in these cells that the Ig heavy chain gene rearrangement begins and then continues later in the pro-B cells. The intracellularly-expressed rearranged heavy chain is then expressed in large B cells along with surrogate light chain; together they form the pre-BCR that relocates to the cell surface1. The Ig light chain is then rearranged, in the small pre-B cells, which leads to the production of the mature BCR with unique
specificity. The first BCR is expressed as an IgM on the surface of immature cells2. Immature B cells then go through a first checkpoint at which self-reactive BCR-expressing cells are removed before exiting the bone-marrow as transitional (T1) B-cells to migrate to the spleen. Once at destination, T1 B cells migrate to splenic follicles where they differentiate into non-circulating T2 B cells. The existence of a third transitional stage has been proposed but no functional role has been yet identified3. After all the transitional stages, B cells finally become long-lived mature cells. A model in which these cells form a follicular type I (FO I) population has been proposed (fig 1.1)4 but is not yet widely accepted. A binary cell fate then leads to the generation of, in most cases, FO II cells or, in fewer instances, marginal zone (MZ) precursor cells. While both sub-types possess different key functions discussed later, both populations are also distinct in their localisation within the spleen (fig 1.2). The differentiation fate is mostly regulated by the strength of the BCR signaling where a strong signal will favour a FO I fate and a weaker or absent BCR signal will stimulate a MZ fate (fig 1.3). In addition to the follicular and marginal zone B cells, a third mature B cell population has been discovered in mice. These B1 B cells seem to have a B220-CD19+ progenitor lineage that appears prior to pre-pro B cells, but intermediate stages have yet to be identified5
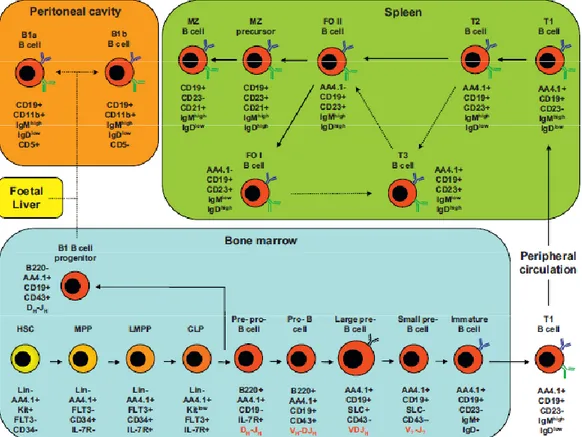
Figure 1.1. Murine B cell development.
B-cells differentiate from haematopoietic stem cells (HSC) in the bone marrow and progress through several intermediate stages before egress into the peripheral circulation. Further maturation to follicular and MZ B-cells occurs in the spleen. B1 B-cells mature in the peritoneal cavity. The intermediate developmental stages currently defined are illustrated together with a list of important cell surface markers expressed at each stage (black text) and the status of Ig gene rearrangement (red text). Solid arrows indicate known pathways of differentiation. Dotted arrows indicate hypothetical pathways, which may contain undiscovered intermediates. MPP, multi-potent progenitor; LMPP, lymphoid-primed multi-potent progenitor; CLP, common lymphoid progenitor; SLC, surrogate light chain. Figure and legend taken from Vaughan et al, 2011
1.1.2.0 Functions
The first apparent role of B cells was observed in the 1960s when Max Cooper demonstrated that antibody production was completely abolished in chickens that were irradiated after the removal of their bursa of Fabricus (the primary site of B cell development in birds)6. Subsequently, the discovery of surface Ig on B cells as the B cell receptor (BCR) confirmed the one cell, one antibody model developed in the 1950s7. In the mid-1970s, it was fully accepted that B cells had a specific and unique way to recognize antigens and differentiate into antibody-secreting plasma cells. Nowadays, several different subsets of B cells have been identified with distinct functions and responses. Here, we will not discuss plasmocytes or memory B cells since they have lost most of their antigen-presenting functions and are of no importance to our current objectives.
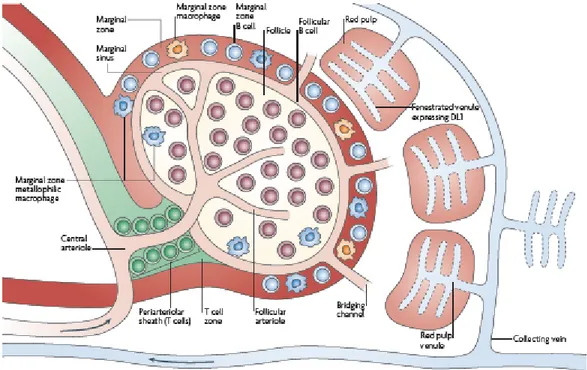
Figure 1.2. A schematic view of the anatomy of the spleen.
This figure shows the location of the different mature B cell subsets within the spleen. Figure was taken from Pillai and Cariappa, 2009.
1.1.2.1 Follicular B cells
Mature follicular B cells are responsible for the majority of T helper cell-dependent humoral immune responses. Ultimately, these responses lead to immunological memory and generation of plasma cells8. During an infection, follicular B cells are able to recognize antigens through their surface BCR which will lead to the internalization, processing and presentation to CD4+ T cells of foreign antigenic particles. This interaction will in turn promote the rapid generation of plasma cells and to an eventual formation of germinal centers9. Somatic recombination will then take place in these micro environments and will lead to an increased affinity of the BCRs to antigens and subsequent isotype class switching8. Affinity-matured, isotype-switched B cells will differentiate into memory cells or long lived plasma cells that will migrate into the bone marrow. Memory B cells remain in peripheral lymphoid organs for whole life of the host. These cells will respond at a great speed to future microbial challenges10.
1.1.2.2 Marginal zone B cells
This population is exclusively found within the splenic marginal sinus and was initially thought to be specialized in a rapid T cell-independent antigen response. Within 3 days of an antigen encounter, such as bacterial capsular polysaccharides, MZ B cells can differentiate into antigen-specific plasma cells11. Since they respond so rapidly to blood-borne antigens, MZ B cells embody an innate immunity player. On the other hand, experiments in mice have shown that the marginal sinus is also composed of memory B cells, suggesting a long-lived immune response characteristic of the adaptive immune system12. Thus, MZ B cells are believed to be the main source of naturally occurring antibodies. While follicular B cells may present antigens to activated CD4+ T cells, they lack the ability to efficiently prime naïve T cells. On the other hand, MZ B cells have higher
levels of MHC-II and B7 proteins which makes them far more potent activators of naïve CD4+ T cells both in vitro and in vivo13.
Figure 1.3. Marginal versus follicular fate.
T2 immature B cells will either become marginal zone or follicular B cells following BCR engagement with self-antigen. A strong BCR signal will favour a follicular fate whereas a weak “tickling” of the BCR will favour a marginal zone fate. Figure was taken from Pillai and Cariappa, 2009.
1.1.2.3 B1 B cells
While the functions of MZ and FO B cells have been widely studied, B1 B cells have been identified fairly recently and thus, our knowledge of this population is quite restricted. For what is known, B1 B cells are associated with the humoral branch of the immune system and they dominate the peritoneal cavity in mice. They constitutively differentiate into plasma cells in the absence of antigen and secrete low-affinity IgM antibodies. CD5+ B1a B cells are responsible for the production of these natural antibodies which grant a non-specific response to invading pathogens prior to the mobilisation of adaptive immunity14. Moreover, this production of IgM is increased by Toll-like-receptor agonists such as LPS and
CpG15. On the other hand, CD5- B1b B cells are only mild producers of natural antibodies but, in contrast, they yield specific antibodies to T cell-independent antigens (TI-2) present in the peritoneal cavity. These antigens are able, by activating B cells, to mount an immune response without the help of T cells. This singularity also occurs with MZ B cells in the spleen but, additionally, B1b B cells confer long-lasting T cell-independent immunity16. In humans, CD5 is not confined to a single cell type, singling out this marker as an unreliable B1a B cell identifier. However, CD5+ B cells capable of secreting poly-reactive antibodies in vitro have been observed and might represent the human equivalent of the murine B1 b cells14.
1.1.3 Pathology
B cells are implicated in many pathologies, most notably lymphomas17 and auto-immune disorders18. Auto-immune diseases are characterized by loss of peripheral tolerance and inappropriate production of autoantibodies. Many of the 80 distinct auto-immune disorders are associated with the development of autoantibodies12. Moreover, activated B cells secrete a variety of pro-inflammatory cytokines and chemokines such as IL-6, TNF-α, IFN-γ, IL-12 and MIF, all of which are implicated in the inflammatory cascade of auto-immune pathologies. In addition, antigen presentation by auto-reactive B-cells is pivotal in several auto-immune disorders such as systemic lupus erythematosus and rheumatoid arthritis, and can stimulate autoimmunity independently of antibody production19. There is also increasing evidence that B cells can produce the potentially anti-inflammatory cytokine IL-10 and produce regulatory IgM antibodies that bind apoptotic cells which can block the inflammatory responses of macrophages and dendritic cells20. Moreover, memory B cells are also a pool of reactive B cells which can promote and sustain the chronic ongoing of auto-immune diseases. Having said all that, it becomes obvious that in order to
effectively fight auto-immune disorders, we must undertake an in-depth examination of B cell regulation mechanisms and functions. Here, we will principally look at mechanisms implicated in the presentation of self-antigens by B cells.
1.1.4 B cell and transplantation
Graft-versus-host disease (GVHD) is a major cause of morbidity and mortality after allogeneic stem cell transplantation19. Increasing evidence indicates that B cells might play a major role in certain pathologies and that depletion of these cells in patients could be a therapeutic avenue of choice20. Although the precise mechanisms of action of B cells in graft-versus-host rejection are still unknown, it is thought that a variety of effector pathways including antigen presentation, dysregulated auto-immune antibody synthesis or allogeneic antibody induction, might be implicated21. Recent findings suggest that B cells regulate antigen presenting functions previously allocated to other professional APCs during the initial response to alloantigen, highlighting the regulatory, antibody-independent role played by B cells during this response22, 23.
1.1.5 Rituximab
While more and more evidence strengthens the idea that B cells have a much more critical role than previously expected in many diseases, this notion first started to emerge many years ago. In the early 1990s a new treatment focusing on destroying over-reactive or dysfunctional B cells entered phase 1. This treatment, which is still in use today, consists of an anti-CD20 antibody which targets only B cells. While plasma cells do not generally express CD20 and thus cannot be targeted by the anti-CD20 antibody Rituximab, promising results have been obtained in the treatment of auto-immune diseases using this strategy. Some patients have shown extended period of remission without any decrease in
serum immunoglobulin, underlying an antibody-independent mechanism for Rituxumab24. Most notably, Rituximab targets auto-reactive B cells which results is lesser pro-inflammatory cytokine production, reduced depletion of healthy cells, and presentation of self-antigens to auto-reactive T cells25, 26. Moreover, recent studies using Rituximab include treatments for rheumatoid arthritis27, systemic lupus erythematosus, Sjögren’s syndrome, vasculitis, multiple sclerosis, Graves’ disease, idiopathic thrombocytopenia, dermatomyosis, polymyositis, pemphigus and bullous pemphigoid28. This new avenue of B cell-specific treatment is still in an early stage and many groups are currently making observations that certain B cell populations such as MZ, B1 and germinal center cells are more resistant to depletion by the anti-CD20 antibody29, 30 . Thus, new treatments are being developed to target other cell specific markers such as CD22, CD19, CD40-CD40L, BAFF and APRIL31. We believe that by understanding the functional mechanisms in B cells responsible for these pathologies, we might not require such a drastic treatment. By focusing on key events in the onset of auto-immune disorders we may be able to figure how to keep the auto-reactive B cells in check and avoid auto-immunity.
1.2 B cell activation
Resting B cells have very low antigen-presenting capacities and do not produce large amounts of cytokines. In order for B cells to become potent players in the host response against infections, they need to be activated through specific signaling pathways, some of which include T cell surface molecules, antigens, cytokines and bacterial products. Here, we are focusing on the antigen-presenting functions of B cells, which mainly take place following activation and thus, relevant activating mechanisms will be discussed.
1.2.1 B cell receptor
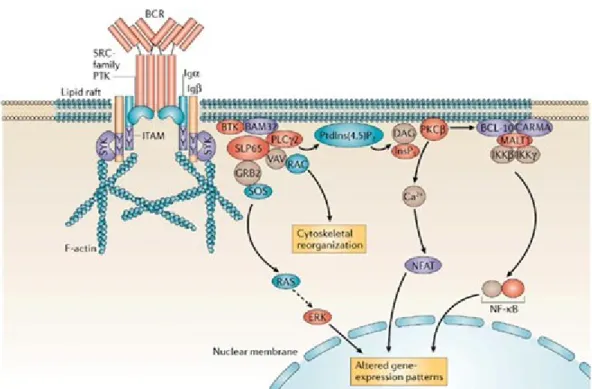
The basis of antigen recognition by B-cells resides in their specific clonal receptor. The BCR is composed of a membrane-bound immunoglobulin and a di-sulfide-linked heterodimer composed of Igα and Igβ32, 33. In the absence of antigen, each host generates a pool of B-cells in which each cell expresses a single heavy and light chain gene, the product of somatic recombinations34. The net result of gene rearrangement is a possibility of well over 1010 different immunoglobulin molecules and thus a virtually infinite number of antigens recognized. Self-reactive B-cells are removed from the repertoire while the BCRs with the highest affinity are selected upon antigen recognition. Membrane-bound immunoglobulins have a very short cytoplasmic tail ranging from only three to 28 amino acids35. While these chains are too short to associate with intracellular signaling molecules, the Igα and Igβ possess cytoplasmic tails of 61 and 48 amino acids respectively within which is comprised a conserved immuno-receptor tyrosine-based activation motif (ITAM)36. Antigen binding induces BCR aggregation and phosphorylation of its ITAM motifs by Src family phosphotyrosine kinases (PTK) such as Lyn, Fyn, Blk or Lck37. The phosphorylated ITAM recruits Syk (Spleen tyrosine kinase) through its SH2 domain which leads to an amplification of ITAM phosphorylation and the triggering of at least four different signaling cascades with downstream effectors such as p38 MAPK, JNK1/2, ERK1/2, NF-κB, CaMK and NFAT (fig 1.4)38. These molecular events are also implicated in the fate-determining steps of immature B cells. Strong BCR signal, coming from stringent association of self-antigens to the receptor, induce the differentiation of immature B cells to follicular B cells. On the other hand, if the BCR signal strength is weak, immature B cells will become marginal zone B cells. This dichotomy is of utmost importance to us as the BCR signal strength will dictate the phenotypic differences between these two populations.
Figure 1.4. BCR downstream transduction pathways.
Figure was taken from Monroe. J. G. 2006
1.2.2 Toll-like receptors
B cells are a key link between the adaptive and innate immunity as they both express antigen-specific BCRs and various TLRs. These TLRs are pattern-recognition receptors (PRRs) that recognize conserved bacterial products including bacterial lipopolysaccharides (TLR4), flagellin (TLR5), lipopeptides (TLR2), double-stranded RNA (TLR3), single-stranded RNA (TLR7/8) and CpG-containing DNA (TLR9)39, 40. For all the TLRs, except TLR3, early signal transduction occurs through MyD88 and IRAK, while later responses include NF- κB, IL-6, TNF-α and IL-12 (fig 1.5). B cell activation, proliferation and class-switching are all influenced by TLR pathways41. For instance, TLR7 was shown to induce IgM and IgG secretion in both naïve and memory human B cells42 and several TLR agonists increase MHC-II, CD80 and CD86 surface expression in different B cell subsets43. While TLR agonists have been extensively studied in regard to their activating
properties, they have been shown to assist, rather than induce, proliferation of certain sub-types of B cells such as memory B cells44. For instance, immature B cells poorly proliferate upon LPS stimulation even though they express considerable amounts of TLR445. Moreover, it has been shown, that in the context of infection, TLR4 and TLR2 agonist readily reach the bone-marrow and inhibit lymphoid precursor proliferation46. In addition, our results along with others, demonstrate that a TLR4 engagement promotes the generation of CD23+ transitional B cells derived from splenocytes in vitro47. These results suggest that TLRs can shape certain maturation pathways as opposed to their classical activating role. Finally, LPS, a TLR4 ligand, has the potential to activate and dramatically induce antigen presentation in B cells and thus, will be discussed here.
Figure 1.5. TLR4 downstream transduction pathways. Figure taken from Ragnardòttir et al. 2011
1.2.3 CD40-CD40L interaction
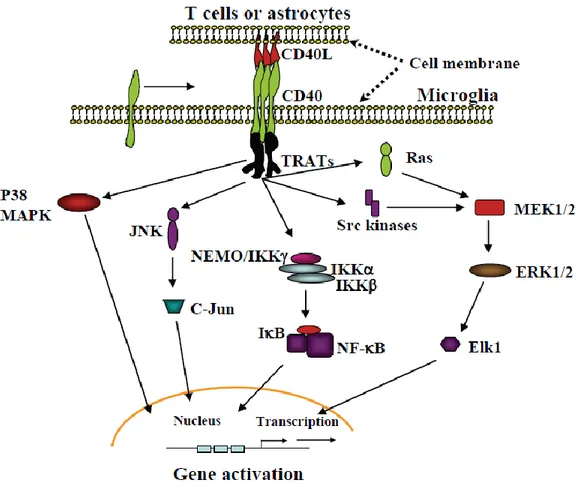
B cells constitutively express at their surface the CD40 antigen, a member of the nerve growth factor/tumor necrosis factor receptor family48. This receptor plays a crucial role in B cell activation, T cell-dependent antigen-driven isotype switching and germinal center formation. CD40 interacts with its ligand, CD40L (CD154), present mostly on activated CD4+ T cells, which stimulates B cells to deliver activating signals to T cells. Besides B and T cells, CD40 and/or CD154 are also expressed by many cell lineages including dendritic cells, monocytes/macrophages, endothelial cells, epithelial cells and fibroblasts as well as platelets49. Six TRAF proteins (TRAF1-6) have been described so far, and all of them, except TRAF4, can interact, directly or indirectly, with CD4050. Signaling downstream of CD40 is dependent on the presence of adaptor proteins which are recruited to the cytoplasmic domain of CD40. Of these, NF-κB, the mitogen-activated protein kinases (MAPKs – p38 and JNK) as well as the phophoinositide 3-kinase (PI3K) have been shown to be modulated by TRAFs recruitment (fig 1.6). Moreover, CD40 can directly recruit Jak3 and induce its activation, which leads to the phosphorylation and signal transduction of STAT550. Thus, transduction pathways following CD40-CD40L interaction have the potential to influence many different cellular outcomes such as proliferation, differentiation, activation, immunoglobulin secretion, cell survival and antigen presentation.
Figure 1.6. CD40 downstream transduction pathways. Figure taken from Chen et al. 2006.
1.2.4 IL-10
IL-10 was first described more than 20 years ago as cytokine synthesis inhibitory factor (CSIF), a cytokine, produced by Th2 clones, which could inhibit the production of IL-2, IL-3, lymphotoxin (LT)/TNF, IFN-γ, and granulocyte-macrophage CSF (GM-CSF), by Th1 cells51. Nowadays, the cellular sources of IL-10 have been extended to almost all leukocytes even though the most potent producers of in vivo IL-10 are monocytes, macrophages and T-helper cells52. The activity of IL-10 on Th1 cells was found to be indirect, acting on antigen-presenting cells’ (APC) activating properties, mainly through the modulation of costimulatory molecules (B7; CD80/CD86), MHC-II expression and IL-12 production53,54. The biological effects of IL-10 are so incredibly heterogeneous
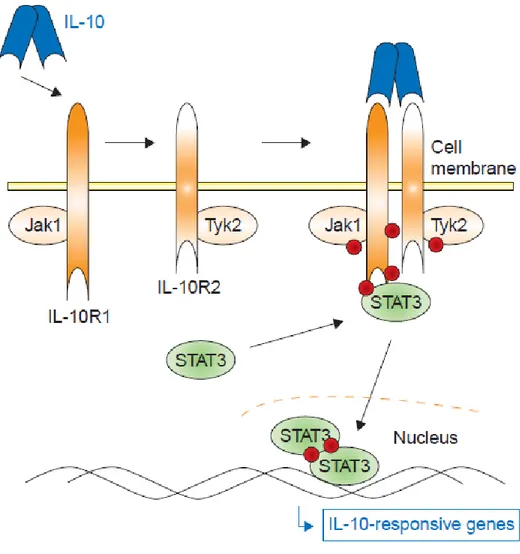
and numerous that they can hardly be generalised to a few key functions. Indeed, chip analyses have shown that IL-10 was responsible for the up-regulation of about 1600 genes and the down-regulation of about 1300 other genes mainly through the activation of STAT3 (fig 1.7)55. This cytokine partially inhibits the activity of induction of other cytokines such as IFN-γ, IL-2, TNF-α, and IL-4. Not only does IL-10 affect APCs’ activities and T cell responses, but it also enhances the survival of B cells and tumour cells56, 57. Paradoxically, it has been shown to induce apoptosis in certain types of cancers such as chronic B cell leukemia58. One of the first studies performed on IL-10 focused on the activation properties of this cytokine, showing that IL-10 increased surface expression of MHC-II and viability of murine splenic B cells59. These results, along with more recent work showing that IL-10 decreases MHC-II surface expression in monocytes and dendritic cells, allow us to appreciate the complex control and timing implicated in IL-10 signaling. This cytokine is usually produced after the pro-inflammatory mediators such as IFN-γ and TNF-α. Thus, it has a role in limiting and preventing an excessive immune response and in limiting collateral damage60. Little work has been done on the B cell response to IL-10 and the relatively late activation mechanisms of these cells occurring following the inflammation process.
Figure 1.7. IL-10 downstream transduction pathways. Figure taken from Sabat et al. 2007
1.3 Antigenic presentation
Many times above we referred to antigenic presentation as the key feature of this work. Here we will describe the different players and properties of this phenomenon. We will focus on the major-histocompatibility complex (MHC) proteins, their structure and functions.
1.3.1 HLA genes
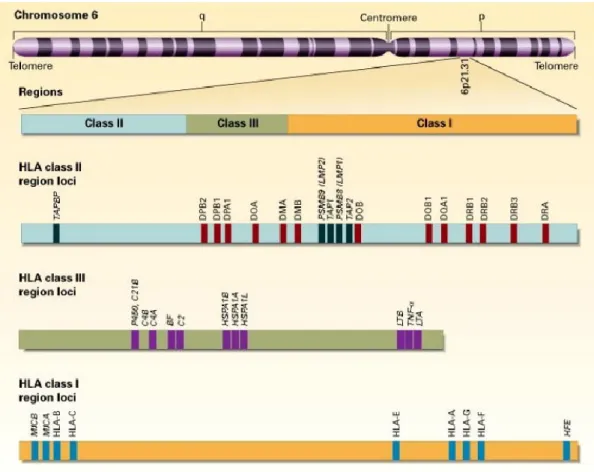
As opposed to the B-cell receptors and antibodies, the T-cell receptors can only recognize antigens that have been processed and presented by the major histocompatibility complex (MHC). This complex is a collection of genes located on chromosome 6 in humans where it is known as the HLA complex (fig 1.8), and chromosome 17 in mice where it is known as the H-2 locus61. In both cases, the MHC genes are organized in different regions encoding three major classes of molecules.
The class I genes encode for the α chain of the MHC-I molecules HLA-A, HLA-B and HLA-C which are referred to as the classical class I molecules. On the other hand, the β2-microglobulin chain is encoded in a “non-HLA” region located on chromosome 15. The MHC-I molecules are responsible for antigenic presentation of endogenous peptides and are thus implicated in the presentation of antigens to CD8+ cytotoxic T cells. As such, the MHC-I molecules are expressed on all nucleated cells.
The class II genes encode for the α and β chains of the classical molecules HLA-DP, HLA-DQ and HLA-DR and the heterodimers of the non-classical molecules HLA-DM and HLA-DO62. The MHC-II heterodimers are responsible for the presentation of exogenous peptides and are thus implicated in the presentation of antigens to CD4+ helper T cells. As such, the MHC-II molecules are mainly expressed on antigen-presenting cells (APC) such as B-cells, dendritic cells, monocytes and macrophages.
The class III genes encode some proteins implicated in the immune response but not directly in antigen presentation. Such products include proteins from the
complement system (C4, C2 and factor B) and several inflammatory cytokines including the tumour necrosis factor (TNF).
Figure 1.8. The human HLA complex genes.
The complex is conventionally divided into three regions on chromosome 6: I, II, and III. Each region contains numerous genes, only some of which are shown. Of the class I and II genes, only the expressed genes are depicted. Figure was taken from Klein et al, 2000.
1.3.2 Major histocompatibility complex I (MHC-I)
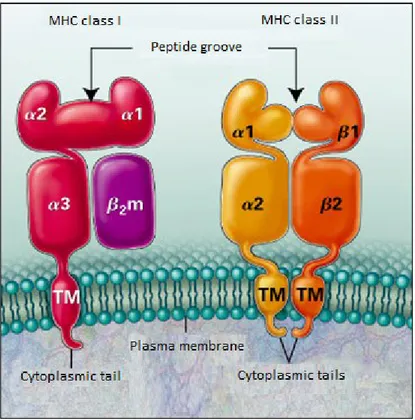
The MHC-I complex is formed by the non-covalent association of an alpha chain, containing three domains, α1, α2 and α3, and by a β2-microglobulin (fig 1.9). The association of the two chains forms a complex expressed constitutively at the
surface of virtually all nucleated cells63. This complex is formed in the endoplasmic reticulum, where an endogenous peptide enters the peptide groove of the heterodimer. The MHC-I-peptide complex then migrates to the surface of the plasma membrane where it presents its antigen to CD8+ cytotoxic T cells. In this work, we will not focus on MHC-I because of the nature of the presented peptide. MHC-I presents endogenous peptides to T cells, and thus healthy cells will be ignored while cells presenting foreign peptides will be destroyed. Here, we are interested in the antigenic presentation of exogenous peptides associated to MHC-II complexes on the surface of professional APCs.
1.3.3 Major histocompatibility complex II (MHC-II)
The MHC-II heterodimers are highly polymorphic trans-membrane glycoproteins. They are formed through the non-covalent association of an α (32 to 34 kDa) and β chain (29 to 32 kDa) (fig 1.9). Three different isotypes of the MHC-II molecules can be found in humans, HLA-DP, HLA- DQ and HLA-DR, while in the mouse, only two are present, I-A and I-E. These complexes are mainly expressed on professional APCs but can also be found on thymic epithelial cells62. Moreover, interferon-gamma can induce the expression of these molecules in a wide range of cell types. This induction is controlled through the expression of the class-II trans-activator CIITA64. Because of the ability of the MHC-II complex to present exogenous peptides and thus raise an immune response against invading pathogens and the fact that the antigenic presentation through MHC-II can be regulated through many different pathways, this thesis will focus on the post-transcriptional modifications of MHC-II and the ramifications on B cell activation of such modifications.
Figure 1.9. MHC-I and MHC-II structure. Figure was taken from Klein et al., 2000.
1.3.3.1 Classical and non-classical molecules
The MHC-II molecules are divided into two groups; the classical and the non-classical molecules. The human non-classical MHC-II comprises the HLA-DP, -DQ and – DR heterodimers while the murine counterpart has only two, H2-A and –E. MHC-II proteins are characterised by their extremely high levels of polymorphism which is vital to their antigen presentation function.
The non-classical molecules, on the other hand, are more conserved than MHC-II and comprise the HLA-DM and –DO heterodimers in humans65. In the mouse, these molecules are known as H2-DM and –DO. While these molecules cannot harbour a peptide in their groove and thus present antigens, their role relies in
controlling the function of the MHC-II complex. HLA-DM is responsible for the removal of the invariant chain peptide (CLIP) located in the MHC-II groove. Moreover, HLA-DM can edit the peptide repertoire by facilitating the binding of higher affinity peptides to the MHC-II groove66, 67, 68. On the other hand, HLA-DO is known for its inhibitory effect on HLA-DM. HLA-DO thus reduces the removal of the CLIP peptide and impairs the loading of endogenous peptides69 It is thus implicated in the editing of the peptide repertoire and can, in this fashion, reduce the ability to raise an immune response through its impairment of antigenic presentation. Moreover, HLA-DO can restrict certain peptides from entering the MHC-II groove by selecting for peptides bigger than 18kDa70
1.3.4 MHC-II structure
The classical heterodimer is sub-divided into 4 distinct domains, the peptide groove, an immunoglobulin-like domain, a trans-membrane region and a cytoplasmic tail71. The peptide groove is formed from the interaction of the α1 and β1 domains and contains 8 β sheets and 2 α helices equally distributed among both domains. This groove allows binding of an 8 to 12 amino acid antigenic peptide which will eventually be presented to CD4+ T cells72, 73. The hyper-polymorphic residues of the MHC-II complex are located in this groove and allow a wide range of peptides to bind through hydrogen bonds formed between the groove and the antigenic peptide amino acids74.
The next domain comprises the α2 and β2 regions of each chain. These regions are more conserved and possess a structure analogous to immunoglobulins. The interaction between MHC-II and the CD4 receptor occurs through these regions75. The trans-membrane domain anchors the complex in the lipid bi-layer of the plasma membrane. Thus, these trans-membranes are highly enriched in
hydrophobic residues. It has been shown that the β chain trans-membrane could be implicated in the signal transduction required for B cell activation76.
The cytoplasmic domains are composed of hydrophilic residues and act as an intracellular endosome trafficking motif77, 78, 79. They also contain critical residues for cyto-skeleton interaction80. Moreover, many functional analyses demonstrate the implication of the cytoplasmic tails in the intracellular signaling upon activation of B cells81, 82. Finally, it has been shown that the cytoplasmic domains of MHC-II can be ubiquitinated, leading to an internalization and degradation of the complex and thus, reduction in antigenic presentation83.
1.4 Ubiquitination
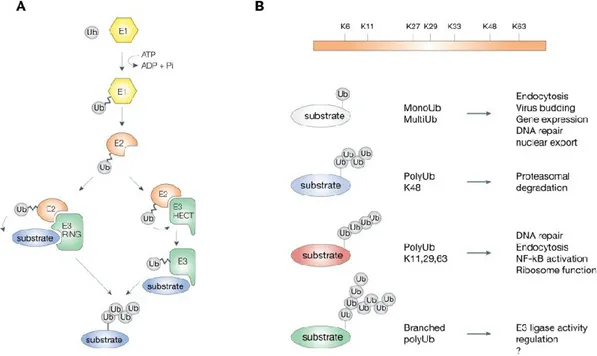
Ubiquitination plays a central role in many different cellular processes. Much like phosphorylation, ubiquitination is a reversible covalent modification that modulates the stability, activity and localization of target molecules. It has been associated with ubiquitin-mediated proteasome degradation, but also with sorting of proteins along the endocytic pathway into lysosomes84, 85. Ubiquitination is the result of the concerted effort of three enzymes, an ubiquitin-activating E1 (E1) enzyme, an ubiquitin-conjugating E2 (E2) enzyme and an ubiquitin-ligase E3 (E3) enzyme (fig1.10a). The E1 activates, in an ATP-dependent manner, ubiquitin molecules which are subsequently transferred to an E2. An E2-E3 complex is then formed and the nature and localization of this complex will determine the substrate specificity. Finally, the ubiquitin moiety is transferred to the target substrate and the E2-E3 complex is dissociated, allowing for a new round of ubiquitination86. Typically, ubiquitin molecules are transferred on lysines, but serines, methionines, cysteines and threonines have been found to be suitable, but less efficient, ubiquitin acceptors87, 88. The ubiquitin molecule contains seven lysines which can themselves be ubiquitinated, forming
poly-ubiquitin chains. It is believed that poly-poly-ubiquitin chains linked through lysine at position 48 of ubiquitin (Lys 48) target protein substrates for degradation by the proteasome, whereas poly-ubiquitin chains of alternative linkages (such as Lys 63) carry out signaling functions independent of proteolysis (fig1.10b)89. Substrates can thus be mono-ubiquitinated, one ubiquitin on one lysine, multi-ubiquitinated, one ubiquitin on many lysines, or poly-ubiquitinated. These different target modifications can lead to fates such as lysosomal or proteosomal degradation, recycling, relocalisation or even a change in function90.
Figure 1.10.The ubiquitination process
A. The different steps involved in ubiquitination from the E1 enzyme to the E3 and substrate. B. The different types of ubiquitination. Figure was taken from Woelk et al. 2007.
1.5 MARCHs
There are two main families of E3 ubiquitin ligases, HECT- and RING- containing domains91. The MARCH family of E3 ligases is characterised by the presence of an
N-terminal RING-finger (Cys3HisCys4; C3HC4)92, 93. Moreover, the MARCH family contains 11 known members which target molecules implicated in the immune response92. Until recently, no mechanism had been described to explain the retention of MHC-II molecules inside immature DCs. Two separate studies have shown that I-A dimers are ubiquitinated and relocated into endocytic compartments94, 95. Once activated by LPS, I-A molecules are no longer ubiquitinated and are thus stabilized at the cell surface. Recently, two other papers have shown that two RING-CH E3 ligases, MARCH1 and -8, can ubiquitinate mouse MHC II molecules in B lymphocytes and DCs, respectively94, 96. The human orthologs had already been shown to down-regulate the TfR, Fas and CD8697. MARCH8 is ubiquitously expressed and would play a general role in the endocytic pathway. M1 mRNA is found principally in secondary lymphoid organs, a distribution consistent with a role in immunity. Dr. Thibodeau’s laboratory has previously shown that IL-10 induced the up-regulation of MARCH1 in human primary monocytes which led to the ubiquitination and subsequent intracellular retention of the MHC-II surface molecules98.
1.6 Lentiviruses as a gene delivery system
Modern experiments on specific proteins often make use of over-expression systems to clearly delineate the role of these target proteins. While over-expressing a gene may not precisely represent constitutive amounts found in normal cells, these systems represent a useful tool for characterizing specific players in complex cellular pathways.
Prior to the use of lentiviral vectors, onco-retroviruses, such as the murine leukemia virus (MLV), had been characterised as excellent gene delivery tools. First, they possess a large cloning capacity of up to 10kbs. Second, retroviral vectors stably integrate their cargo into the chromosome of the target cell. Third,
they do not transfer viral genes enabling the transduced cells to avoid virus-specific cytotoxic T lymphocyte-mediated destruction99. Retroviral vectors are a powerful tool for gene transfer, but they lack a critical attribute of lentiviral vectors; the ability to transduce non-dividing cells. Moreover, most of the potential targets for gene therapy include neurons, hepatocytes, myocytes and hematopoietic stem cells99, 100, 101, all of which are non-dividing cells. As such, lentiviral vectors were first developed to target CNS cells102 in neurodegenerative disorders research, i.e. Parkinson’s disease. The first generations of lentiviral vectors developed were produced by expressing as much as 8 viral genes into producer HEK293T cells103. Possible recombination of these viral genes and production of a replication competent virus was soon established as a health hazard. The current, third-generation, lentiviral vectors are produced by expressing only the viral genes Gag, Pol and Rev. Additionally, the lentiviruses are pseudotyped with the vesicular stomatitis virus (VSV) G envelope protein to enhance its tropism103. Moreover, to decrease the chance of recombination and dramatically increase the safety issues of lentiviral vectors, four different plasmids are used to express all the genes required for viral assembly. Typically, a first vector will encode for Gag and Pol, a second for Rev, a third for the VSV-G gene and a fourth for the gene to be delivered. The four vectors are co-transfected into HEK293T cells and the lentiviral vectors are harvested from the supernatant two to three days post-transfection.
1.7 Hypotheses and objectives
As increasing evidence suggests that B cells might play a major role in the development and intensity of auto-immune diseases, it is of the utmost importance to recognise and characterise the multiple mechanisms associated with these diseases. Auto-reactive B cells produce pro-inflammatory cytokines and present self-antigens to auto-reactive T cells. Dr. Thibodeau’s team has previously shown that MARCH1 is a key immune suppressor which could counteract auto-immune pathologies.
Hypothesis 1
MARCH1 is a negative regulator of autoimmunity in antigen presenting cells, and thus in B cells, MARCH1 is tightly regulated.
Objective 1
We aim to characterise the different populations of B cells in regard to MARCH1 expression.
Hypothesis 2
Upon activation, MARCH1 is decreased to allow maximal antigenic presentation and thus efficient T cell priming.
Objective 2
We will assess the regulatory patterns of MARCH1 following the activation of B cells and try to uncover the regulatory mechanisms involved.
Recent evidence suggests that intracellular MHC-II molecules promote Toll-like-receptor signaling by forming a complex with CD40 and Btk.
Hypothesis 3
MARCH1, by relocating surface-associated MHC-II molecules to endosomes, increases Toll-like-receptor signaling by increasing the formation of MHC-CD40-Btk complexes.
Objective 3
We will assess the inflammatory cytokine production pattern of B cells in the presence or absence of MARCH1, MHC-II and Btk.
Hypothesis 4
Lentiviruses expressing MARCH1 DNA should be able to transfer the gene and lead to the expression of the MARCH1 protein in non-transfectable cells.
Objective 4
We will try to develop a lentiviral vector system which would allow us to transduce cells with the MARCH1 gene leading to its expression and activity in target cells.
CHAPTER 2 – MATERIALS AND METHODS
2.1 Lentiviral vector production
Production of third-generation lentiviral vectors pseudotyped with the vesicular stomatitis virus (VSV) G envelope protein was achieved by transient co-transfection of four plasmids in Lenti-XTM 293T cells (Clontech). The packaging constructs used were pLP1 and pLP2 (Invitrogen), which encode the HIV-1-derived Gag/Pol and Rev genes respectively. The VSV-G protein was expressed from pLP/VSVG (Invitrogen) and GFP or GFP-mM1 from the expression plasmid pLVX-Tet-On Advanced (Clontech). After transient transfection of the four plasmids by polyethyleneimine (PEI, Polyscience Inc.) in Lenti-XTM 293T cells, the cells were incubated at 37°C in DMEM medium (supplemented with 5% serum) for 48 hours. The supernatant was harvested and filtered through a 0,4μm low-protein-binding membrane filter, concentrated by ultracentrifugation at 85000g for 105 minutes and re-suspended in serum-free DMEM. Viral stocks were stored at -80°C and titers and activity were determined by transduction and flow cytometry analysis of GFP and MHC-II expression in 293E-CIITA cells.
2.2 Transduction
Adherent cells were transduced in 6-well plates by removing the existing media, adding the lentiviral vectors directly onto the cells, adjusting the volume to 250μL with DMEM medium and then incubating at 37°C in the presence of 8μg/mL of Polybrene (Sigma) for one hour. DMEM medium was then added to a final volume of 2mL supplemented with 4μg/mL of Polybrene (Sigma) and then incubated for 48 hours at 37°C. Cells were then washed with PBS and analysed for GFP and MHC-II expression by flow cytometry analysis. Non-adherent cells were transduced in the same fashion but were previously centrifuged to remove the existing medium.
2.3 Chemical compounds and cytokines
The following compounds were used: polyethyleimine 2.5kD linear from Polysciences Inc., and Polybrene from Sigma, which was used at a final concentration of 4 or 8μg/mL. STAT3 inhibitor: STATTIC was used at a final concentration of 10µM. NF-kB inhibitor: BAY-11-7082 was used at a final concentration of 25µM unless otherwise indicated. JNK inhibitor: SP600125 was used at a final concentration of 5µM. ERK1/2 inhibitor: PD98,059 was used at a final concentration of 5µM. p38 inhibitor SB239063 was used at a final concentration of 2.5µM. Human IL-10 was purchased from Sigma and was used at a final concentration of 40ng/mL. LPS was purchased from Sigma and used at a final concentration of 100ng/mL.
2.4 Plasmids
The lentiviral vectors pLP1, pLP2 and pLP/VSGS were purchased from Invitrogen. The expression plasmid pLVX-Tet-On advanced was purchased from Clontech. The murine MARCH1 cDNA was kindly provided by Satoshi Ishido and was cloned and YFP-tagged into the pcDNA3.1 vector obtained from Daniel Lamarre. This was done using the PCR-overlapping method and the BAMH1 and Xho1 restriction enzymes. The pLVX constructs were sub-cloned from the pcDNA3.1-YFP-mM1 newly made construct by an Xba1 digestion and ligation.
2.5 Cell culture and transfections
The Lenti-XTM 293T cells purchased from Clontech and the 293E CIITA cells were cultured in DMEM (Wisent) supplemented with 5% FBS (Wisent). For lentiviral vector production, 5M Lenti-XTM 293T cells were plated in 10cm Petri dishes 24 hours prior transfection. They were transfected using 3μg of polyethylneimine (PEI) per μg of DNA. For the 293E CIITA, 0,25M cells were plated in 6-well plates 24 hours prior transduction and titration.
2.6 Mice and immunizations
C57BL/6 (B6) mice were purchased from Charles River Laboratory. Use of animals was in accordance with University of Montreal’s Institutional Animal Care and Use Committee guidelines. Age- and sex-matched 6 to 10 week old B6 mice were immunized intra-peritoneally with 50 μg of (4-hydroxy-3-nitrophenyl)acetyl (NP) conjugated to chicken γ globulin (CGG) (Biosearch Technologies) precipitated in alum (Pierce) and 14 days later germinal center B cells were isolated from the spleen and were analyzed by FACS and quantitative real-time PCR.
2.7 Antibodies
Anti-mouse antibodies used for FACS analysis and cell sorting and purchased from BD Pharmingen (unless otherwise noted) were as follows: FITC-conjugated anti-I-Ab (M5/114; ATCC), anti-CD93 (C1qRp; AA4.1), anti-T and B cell activation Antigen (GL7/Ly-77; GL7); PE-conjugated CD95 (Fas/APO-1; Jo2), IgM (μ), anti-CD21/CD35 (CR2/CR1; 7G6); PE/Cy7-conjugated anti-CD23 (B3B4) and Alexa fluor 647-conjugated anti-CD19 (6D5; eBioscience).
2.8 Real-time quantitative PCR
Cells were re-suspended in TRIzol (Sigma) and frozen at -20 until RNA isolation. Per 1mL of TRIzol, 250μL of chloroform was added. Samples were incubated at room temperature for 5 minutes and centrifuged at 13000g for 15 minutes at 4°C. The aqueous phase was collected and 700μL of isopropanol was added per 1mL of TRIzol. Samples were incubated at room temperature for 10 minutes and then centrifuged at 13000g for 15 minutes at 4°C. The DNA/RNA pellet was washed with 70% ethanol and air dried. DNA digestion was performed as per the manufacturer’s protocol (Ambion). RNA quantification was obtained using a Nanodrop. cDNA was generated using SuperscriptTM reverse transcriptase as per the manufacturer’s instruction (Invitrogen) from 1μg of RNA per reaction. Each
qPCR reaction contained 1,5μL of 5μM of each primer (table 1), 1μL of cDNA, 8,5μL of DEPC water and 12,5μL of SYBR Green mix (Roche) for a final volume of 25μL. Each sample was run in duplicate and a no-template control without cDNA (NTC) was run for every primer set.
Table 1. Sequence of primer sets used in figures 3.1, 3.2, 3.4 and 3.5.
2.9 Statistical analyses
A two-tailed, paired Student’s t test was used to determine statistically significant differences among groups for all figures (where mentioned) but 3.1 where a two-way ANOVA using the Bonferroni method was used to determine statistically significant differences between FO B cells and other groups.
Target Forward Primer sequence Reverse Primer sequence TNF-α 5’ GTGATCGGTCCCCAAAGG 3’ 5’ GGGTCTGGGCCATAGAACTG 3’ IL-6 5’TGAAGTTCCTCTCTGCAAGAGACT 3’ 5’ TAGGGAAGGCCGTGGTTGT 3’ MARCH1 5’ CCTTGCGCTTTGTCCACCAGTCCT 3’ 5’ AATATTTTCCTCCTTTCGCTCGTG 3’
CHAPTER 3 – RESULTS
MARCH1 is only expressed in follicular B cells
Throughout their maturation, B cells express a wide range of different molecules that dictate their phenotype and function. It had previously been shown94 that immature and marginal zone B cells do not express MARCH1 as opposed to follicular B cells. Here, to follow MARCH1 regulation, we widened the search and included precursors and different specialized B cell stages such as germinal center, plasma and bone-marrow cells.
Figure 3.1. MARCH1 is only expressed in follicular B cells
qPCR analysis was performed on different B cell populations that were sorted by flow cytometry. Cells sorting was performed as follow: T1: CD19+, AA4.1+, IgM Hi, CD23- ; T2: CD19+, AA4.1+, IgM Hi, CD23+ ; MZ: CD19+, AA4.1-, CD21 Int-Hi, CD23 low-Int; FO: CD19+, AA4.1-, CD21 Int, CD23 Int; GC: CD19+, GL7+, FAS+; Plasma cells: CD138+ ; Bone-Marrow: CD19+. Error bars represent the SEM between three independent experiments. P-value was obtained by comparing the difference between FO B cells and the other cell populations.
We isolated the different sub-populations (at least 95% purity) from mice spleens or bone marrow using specific cell-surface-expressed molecules and flow cytometry cell-sorting. Quantitative real-time qPCR was then used to evaluate the mRNA expression of MARCH1. While we confirm that T1, T2 and marginal zone B cells do not express MARCH1, we also show that germinal center, plasma and bone-marrow B cells are also devoid of MARCH1 mRNA (Fig 3.1). Thus, follicular B cells represent the only B cell sub-population that expresses MARCH1.
MARCH1 is down-regulated upon B cell activation
Upon activation, B cells transit from a resting to an effector state. Activated B cells have increased antigen presenting functions, phagocytosis and cytokine production capacities105. Moreover, these cells can undergo differentiation to further increase their specificity and ability to counteract infections, i.e. plasmocyte or memory cell differentiation. A wide panel of stimuli can induce B cell activation such as LPS, CD40L-CD40 interaction, BCR engagement and IL-10. Since MARCH1 dampens antigen presenting functions of APCs, we set out to investigate whether activation of B cells was related in any way to MARCH1 expression. Accordingly, we treated mice splenocytes with activating agents (LPS, CD40L) and evaluated the amplitude of MARCH1 mRNA expression using quantitative real-time PCR (fig 3.2a). We are not able to detect MARCH1 at the protein level because of its constitutively low expression. We show that upon activation by LPS or CD40L-CD40 interaction, B cells decrease their expression of MARCH1 mRNA in a time-dependent fashion. LPS down-modulates MARCH1 for the first 8 hours and then, the mRNA level gradually increases until at least 24 hours post-stimulation (fig3.2a left panel). On the other hand, CD40L-CD40 interaction progressively decreases MARCH1 expression in a time dependent manner for at least 24 hours (fig3.2a right panel).
Dr. Thibodeau’s laboratory has previously shown that MARCH1 can be induced by IL-10 in monocytes, leading to a decreased MHC-II surface expression98. Others have shown that IL-10 treatment leads to an increase in MHC-II surface expression in B cells94. To clarify these contradictory results, we used flow cytometry to investigate the surface expression of MHC-II in mouse splenocytes after 12 hours of an IL-10 or LPS treatment (fig 3.2b). Then, we used the corresponding samples along with quantitative real-time PCR, to evaluate the amount of MARCH1 mRNA (fig 3.2c). LPS was used as a control for down-modulation of MARCH1 mRNA level. We show that IL-10 decreases MARCH1 mRNA expression but less effectively than LPS. Also, we correspondingly correlated this effect with an increase in the surface expression of MHC-II on B cells.
While LPS has been shown to induce the transcription of MHC-II expression, IL-10 has not been proved able of a similar effect. To elucidate the role of MARCH1 in the modulation of surface MHC-II, we finally tested the hypothesis that if the increase in MHC-II surface expression was MARCH1 dependent, follicular B cells would be the only population to manifest an effect after IL-10 treatment as they are the only B cells to express MARCH1. We separated follicular B cells from the remaining splenic B cells and treated the two groups with either IL-10 or LPS and measured the surface expression of MHC-II using flow cytometry. We show that while LPS increases MHC-II levels in both groups, IL-10 was only able to do so in follicular B cells, suggesting that MARCH1 was the key player in this MHC-II modulation (fig 3.2d). Thus, IL-10 and LPS decrease MARCH1 expression which leads to an increase in MHC-II surface expression.
A
B. C.
D.
Figure 3.2 MARCH1 mRNA is down-regulated upon activation of B cells
A. Quantitative real-time PCR analysis of MARCH1 expression at different time points after either LPS treatment or CD40L-CD40 interaction. Expression is illustrated as fold level of non-treated samples at time 0. B. Quantitative
real-time PCR analysis of MARCH1 expression at 12h after treatment of either IL-10 or LPS. C. Histogram of flow cytometry analysis showing the surface expression of MHC-II for the corresponding samples (fig 3.2c). Population was gated on CD19+ cells. D. Mean-fluorescence values of a flow cytometry analysis showing the MHC-II surface expression at 12h after treatment of either IL-10 or LPS on follicular B cells and follicular-deprived B cells. Error bars for A and B represent the SEM between three independent experiments. Experiments shown in C and D are representative of four replicates. For this figure, the p-values are represented as follow: p≤0,001 = ***, p≤0,002 = ** and p≤0,05 = *.
FO-devoid XID mice do not up-regulate MHC-II upon IL-10 treatment
XID mice have a mutation in the Bruton’s tyrosine kinase gene (Btk), and are a model of human X-linked immunodeficiency. They have a B cell specific defect which results in a dramatic decrease in follicular B cell numbers. We hypothesised that FO-devoid XID mice splenocytes may not respond to IL-10 stimulation in regard to surface MHC-II levels. To test this premise, we treated either C57BL/6 or XID splenocytes with IL-10 or LPS for 12 hours and assessed the surface expression of MHC-II by flow cytometry. Our results indicate that even though XID splenocytes respond normally to LPS stimulation, they display no increase in MHC-II surface expression after IL-10 treatment (fig 3.3). Thus, these results demonstrate that IL-10 increases MHC-II surface expression only in follicular B cells.
A. B.
Figure 3.3 IL-10 has no effect on MHC-II surface expression in FO-devoid XID splenocytes.
C57BL/6 (in A) or XID (in B) splenocytes were harvested and treated for 12 hours with either LPS or IL-10. Flow cytometry was then used to assess the amount of surface MHC-II proteins in all samples. Numbers represent the mean-fluorescence intensity of MHC-II surface expression. Results shown are representative of three different experiments. NS represents the auto-fluorescence of non-stained cells.
The LPS-mediated down-modulation of MARCH1 is NF-κB dependent
Activation of B cells can lead to a wide range of functions such as immunoglobulin production and secretion, cytokine production, maturation, differentiation, migration and effector functions. Major signaling pathways implicated in the activation of B cells through TLR4 or CD40 stimulation include the phosphorylation or activation of JNK, ERK1/2, p38, NF-κB and STAT346, 47. To investigate the role of each of these downstream effectors on MARCH1 expression, we treated splenocytes for 2 hours with specific inhibitors and then
with LPS for 4 hours. We then used quantitative real-time PCR to estimate the amount of MARCH1 mRNA in each sample. We show that while the inhibitors for JNK, ERK1/2 and p38 have no effect on the down-modulation of MARCH1 by LPS, those specific for STAT3 and κB impaired, and even increase, in the case of NF-κB, the expression of MARCH1 (Fig3.4a). These results indicate that the activation of NF-κB and STAT3 is probably responsible for the down-regulation of MARCH1 mRNA by LPS. We then performed a dose-response analysis to confirm our results on NF-κB since it presented the most notable effect. We treated mice splenocytes with 3 different doses of the NF-κB inhibitor for 2 hours and then either treated or not with LPS for 4 hours. Finally, we used quantitative real-time PCR to evaluate the level of synthesis of MARCH1 mRNA. Here, we show that the NF-κB inhibitor hinders, in a dose-dependent manner, the LPS-driven down-regulation of MARCH1 (fig 3.4b).
A. B.
Figure 3.4 The LPS-driven down-modulation of MARCH1 is NF-κB dependent A. Mice splenocytes were treated with inhibitors of STAT3, NF-κB, JNK, ERK1/2 or p38 (inhibitor is indicated in parenthesis) for 2 hours and then treated with LPS for 4 hours. Quantitative real-time PCR were performed on each sample to
evaluate the amount of MARCH1 mRNA. B. Mice splenocytes were treated with different concentration of the NF-κB inhibitor for 2 hours and then treated or not with LPS. Quantitative real-time PCR were performed on each sample to evaluate the amount of MARCH1 mRNA. Error bars represent the SEM between four independent experiments.
MARCH1 could increase the LPS response and B cell activation
Recent evidence by the group of Liu et al. has demonstrated a role for MHC-II in TLR signaling. Intracellular, but not membrane-associated, MHC-II molecules interact with the Btk tyrosine kinase through the costimulatory molecule CD40. Then, the activated Btk interacts with Myd88 and TRIF and thus promotes TLR signaling. Thibodeau et al. have previously shown that MARCH1 ubiquitinated membrane-bound MHC-II molecules leading to their intracellular relocalisation and degradation98. Moreover, the group of Toyomoto et al. have shown that MARCH8, an analogue of MARCH1, transgene impaired LPS-driven production of TNF-α and IL-6 in mice PBMC. We treated C57BL/6, Ii-KO and XID mice with LPS for 24 hours and used quantitative real-time PCR to evaluate the amount of TNF-α and IL-6 synthesis (Fig 3.5a). We show that while TNF-TNF-α production is dramatically impaired in Ii-KO and XID mice, only XID mice have reduced IL-6 production following LPS treatment. Ii-KO mice have reduced amounts of MHC-II proteins and virtually absent follicular B cells pools while XID mice have a mutated Btk protein and dramatically reduced follicular B cell pools. Moreover, both mice have reduced MARCH1 expression as seen by quantitative real-time PCR (fig 3.5b).
Figure 3.5. Impaired TLR signaling in follicular B cells/MARCH1 deficient mice. A. C57BL/6, Ii-KO or XID mice splenocytes were treated with LPS for 24 hours. Quantitative real-time PCR was then used to assess the amount of TNF-α or IL-6 mRNA. B. C57BL/6, Ii-KO or XID mice splenocytes were treated with LPS for 24 hours. Quantitative real-time PCR was then used to assess the amount of MARCH1 mRNA. Amount of mRNA is shown as fold of non-stimulated cells mRNA levels and error bars represent the SEM of 4 independent experiments.
A.
Lentiviral vectors expressing MARCH1 DNA can infect non-dividing cells.
Expression of foreign genes in eukaryotic cells can be achieved through many different techniques including electroporation, transfection and transduction.
Figure 3.6. Transduction of HEK293-CIITA cells with a lentiviral vector expressing the MARCH1 gene.
Cells were transduced as described previously in Materials and Methods. Different volumes of viral stock were used to determine the titer of the stock. Percentage of YFP-positive cells was determined by flow cytometry for each volume. Titer was established at 3x10⁷ infectious particles per mL. The figure also demonstrates the down-regulation of surface MHC-II molecules in a dose dependent manner when adding MARCH1-expressing lentiviruses. Results shown are representative of at least 4 different experiments.
While not every cell type can be efficiently electroporated or transfected, transduction using viral vectors widens the possibilities. For instance, the tropism of the transducing particles can be enhanced using VSV-G proteins. Moreover, lentiviruses have been shown to proficiently transfer their DNA cargo into non-dividing cell types such as neurons and dendritic cells. Bearing this in mind, we developed a lentiviral system encoding the YFP-tagged MARCH1 gene to ultimately force its expression in non-transfectable primary B cells. We transduced HEK293 cells stably expressing the class II trans-activator CIITA with different volumes of a viral stock which enabled us to determine our stock titer to 3x10⁷ infectious particles per mL. Our preliminary results using these viruses indicate that MARCH1 can be expressed in almost 100% of the infected cells while maintaining viability. Moreover, MARCH1 is functionally expressed in HEK293 CIITA cells and its presence can be followed by a YFP tag as well as a decrease in amounts of surface MHC-II molecules (fig 3.6).
CHAPTER 4 - DISCUSSION
MARCH1 is an important regulator of antigenic presentation in certain APCs. In addition to targeting surface-bound MHC-II molecules, MARCH1 also regulates the surface expression of various molecules, including CD86 and TfR97. Bearing this in mind, we set out to understand the different mechanisms and patterns of MARCH1 expression in particular subsets of APCs. We decided to look at the mouse system since human splenocytes are not readily available. Moreover, our results, along with those of others, indicate that there are some critical differences between the mouse and the human system regarding the responsiveness of B cells to specific stimuli. For instance, human B cells do not up-regulate surface MHC-II expression in response to IL-10. Increasing evidence suggests a major role for B cells in auto-immune diseases due to their vast array of immune functions such as antigenic presentation, self-reactivity and secretion of pro-inflammatory cytokines. Thus, we directed our initial research towards the regulation and function of MARCH1 in B cells, seeking a link between the tightly regulated modulators of immune functions and self-reactivity leading to auto-immune diseases.
While MARCH1 targets proteins implicated in antigenic presentation of exogenous peptides, it is not present in all professional APCs. For instance, MARCH1 in present in immature dendritic cells following treatment with IL-10 but is virtually absent in macrophages94. Moreover, the group of Matsuki published a study showing that MARCH1 was also absent in T cells while being highly expressed in splenic B cells and more specifically in follicular B cells94. We further challenged these findings by characterizing the different stages of B cell maturation from the bone-marrow to highly specialised populations. Here we showed that follicular B cells are the only sub-population of B cells that expresses