HAL Id: inserm-01074715
https://www.hal.inserm.fr/inserm-01074715
Submitted on 15 Oct 2014HAL is a multi-disciplinary open access archive for the deposit and dissemination of sci-entific research documents, whether they are pub-lished or not. The documents may come from teaching and research institutions in France or abroad, or from public or private research centers.
L’archive ouverte pluridisciplinaire HAL, est destinée au dépôt et à la diffusion de documents scientifiques de niveau recherche, publiés ou non, émanant des établissements d’enseignement et de recherche français ou étrangers, des laboratoires publics ou privés.
Visual Versus Quantitative Assessment of Intratumor
18F-FDG PET Uptake Heterogeneity: Prognostic Value
in Non-Small Cell Lung Cancer.
Florent Tixier, Mathieu Hatt, Clémence Valla, Vincent Fleury, Corinne
Lamour, Safaa Ezzouhri, Pierre Ingrand, Remy Perdrisot, Dimitris Visvikis,
Catherine Cheze Le Rest
To cite this version:
Florent Tixier, Mathieu Hatt, Clémence Valla, Vincent Fleury, Corinne Lamour, et al.. Visual Versus Quantitative Assessment of Intratumor 18F-FDG PET Uptake Heterogeneity: Prognostic Value in Non-Small Cell Lung Cancer.: FDG PET heterogeneity in NSCLC. Journal of Nuclear Medicine, Society of Nuclear Medicine, 2014, 55 (8), pp.1235-1241. �inserm-01074715�
Visual versus quantitative assessment of intra-tumor
18F-FDG PET uptake heterogeneity: prognostic value in
Non-Small Cell Lung Cancer
Florent Tixier1,2, Mathieu Hatt2, Clemence Valla1, Vincent Fleury1, Corinne Lamour3, Safaa Ezzouhri1, Pierre Ingrand4, Remy Perdrisot1, Dimitris Visvikis2, Catherine Cheze Le Rest1
1 Nuclear Medicine, CHU Milétrie, Poitiers, France.
2 INSERM, UMR 1101, LaTIM, Brest, France.
3 Department of Oncology, CHU Milétrie, Poitiers, France
4 Epidemiology & Biostatistics, CIC Inserm 1402, CHU Milétrie, Poitiers, France.
Running title: FDG PET heterogeneity in NSCLC
Corresponding author: M. Hatt, INSERM, UMR 1101, LaTIM CHRU Morvan 2 avenue Foch 29609, Brest, France Tel: +33(0)2.98.01.81.11 Fax: +33(0)2.98.01.81.24 e-mail: hatt@univ-brest.fr
Disclosure of Conflicts of Interest: No potential conflicts of interest. Funding: None.
ABSTRACT
The goal of this study was to compare visual assessment of intra-tumor 18F-FDG PET
uptake distribution with an automated quantification through textural features (TF)
analysis and to establish their respective prognostic value in non-small cell lung cancer
(NSCLC).
METHODS: One hundred and two consecutive patients with NSCLC were
retrospectively included. Only primary tumors were considered. Intra-tumor
heterogeneity was visually scored by two nuclear medicine physicians using a 3-level
scale (Hvisu). Metabolically active tumor volumes (MATV) were automatically delineated
and heterogeneity was quantified through TF parameters. Mean and maximum SUV
(SUVmean, SUVmax) were also included. Inter-observer agreement in visual assessment
was evaluated using the Kappa test. Correlations between quantitative and visual
assessment were evaluated using Spearman rank () coefficient. Association with overall survival (OS) and recurrence-free survival (RFS) was investigated using the
Kaplan-Meier method and Cox regression models.
RESULTS: Moderate correlations (0.4<<0.6) between TF parameters and Hvisu were observed. Inter-observer agreement for Hvisu was moderate (kappa=0.64), with
discrepancies in 27% of the cases. High SUV, large metabolic volumes and high
heterogeneity according to TF analysis was associated with poorer OS and RFS, and
remained an independent prognostic factor of OS with respect to usual clinical
variables.
CONCLUSIONS: Quantification of 18F-FDG uptake heterogeneity in NSCLC through
TF analysis is correlated with visual assessment by experts. However, TF analysis is
variability, and independent prognostic value potentially useful for patient stratification
and management.
Keywords: 18FDG-PET/CT, heterogeneity, textural features, tumor delineation, prognosis, NSCLC.
18F-FDG Positron Emission Tomography/Computed Tomography (PET/CT) imaging is
today a well-established tool for diagnostic oncology applications (1). Its exploitation
for gross tumor volume delineation in radiotherapy treatment planning (2) and/or
monitoring response to therapy (3,4) is increasing. For non-small cell lung cancer
(NSCLC), 18F-FDG PET/CT image quantification has been shown to provide
prognostic information. PET image-derived features, including metabolically active
tumor volume (MATV), mean standardized uptake value (SUVmean) and total lesion
glycolysis (TLG, defined as MATV×SUVmean) have been shown to provide an accurate
assessment of tumor burden with potentially higher prognostic value than standard
maximum SUV (SUVmax), for both surgical and non-surgical patients (5–9).
Intra-tumor 18F-FDG uptake heterogeneity has been associated with treatment failure
(10) and its quantification has recently generated interest (11–14), including in lung
cancer (15). Several methodologies have been proposed to assess intra-tumor
heterogeneity, including visual evaluation (16), SUV coefficient of variation (SUVCOV)
(17), area under the curve of the cumulative histogram (CHAUC) (18), and textural
features (TF) analysis (17,19).
TF analysis generates a large number of features quantifying heterogeneity within a
delineated MATV. Recent studies have identified few of these features that are robust
to the clinical range of reconstruction algorithms and acquisitions protocols (20), the
delineation step or partial volume effects (PVE) (21), reaching similar or better
physiological reproducibility than SUV (22).
However, to date there has been no study investigating whether or not the quantitative
heterogeneity assessment of the intra-tumor activity distribution through TF represents
an added value relative to a visual assessment by nuclear medicine physicians. This
assessment with a characterization through TF analysis, and (ii). assess their
respective prognostic value in NSCLC.
MATERIALS AND METHODS Patients & PET/CT Imaging
One hundred and eight consecutive non-metastatic patients with newly diagnosed
NSCLC between 2008 and 2011 were retrospectively considered. The institutional
review board approved this retrospective study and the requirement to obtain informed
consent was waived. Only primary tumors with MATV larger than 3 cm3 were included
due to the inability of PET to characterize tracer distribution within smaller tumors
because of its limited spatial resolution. As a result, 102 patients (79 men, mean age
64) were included (table 1). There were 49 squamous cell carcinomas and 53
adenocarcinomas.
All patients underwent an 18F-FDG PET/CT scan before initiating treatment as part of
the routine staging procedure within a maximum 2 weeks from diagnosis. Patients
fasted for at least 6 hours before injection of 5 MBq/kg (425±95, range 223-690) of 18
F-FDG, administered at 60±4 minutes before data acquisition on a Philips GEMINI
PET/CT scanner (Philips Medical Systems, Cleveland, USA). CT data were acquired
first (120kV and 100mAs, no contrast-enhancement). 3D PET data were subsequently
acquired with 2 min per bed position, and images were reconstructed using CT based
attenuation correction and a 3D row-action maximum likelihood algorithm (RAMLA)
using a previously optimized protocol (2 iterations, relaxation parameter equal to 0.05,
5 mm full-width-at-half-maximum 3-D Gaussian post-filtering, 4×4×4 mm3 voxels grid
Treatment & Follow-up
Treatment consisted of surgery for 48 patients [surgery only (n=18), adjuvant
chemotherapy (n=20), radiochemotherapy (n=9), or radiotherapy (n=1) followed by
surgery], whereas 54 patients did not undergo surgery [chemotherapy (n=12) or
concomitant chemo-radiotherapy (n=42)] (Supplemental Fig. 1). Chemotherapy
consisted of 2 to 6 courses (median=4) of cisplatine/carboplatine in association with
taxol, navelbine, gemcitabine or pemetrexed. The mean total radiotherapy dose was
59.4Gy.
Patients were followed with clinical examination and CT every 3-4 months. Overall
survival (OS) and recurrence-free survival (RFS) were defined as the time between
diagnosis and death (or last follow-up), and between the end of treatment and
recurrence respectively.
Image Analysis
Only the primary tumors were analyzed. Intra-tumor heterogeneity was first scored by
two observers (denoted Hvisu from here onwards), and quantified through TF analysis
after MATV automatic delineation.
Two experienced nuclear medicine physicians were asked to review all PET images,
blinded to the survival information and heterogeneity quantification. They assigned to
each primary tumor a score on a 3-point scale: 1 for homogeneous distribution, 2 for
moderately heterogeneous and 3 for highly heterogeneous. An alternative scale was considered by adding two sub-levels, A for “diffuse” or B for “focalized” heterogeneity,
in scores 2 and 3, hence resulting in a 5-score scale: 1, 2A, 2B, 3A, 3B. For instance,
In order to carry out the quantitative heterogeneity analysis, MATV were firstly
delineated using the Fuzzy Locally Adaptive Bayesian (FLAB) algorithm (24,25). FLAB computes a probability of belonging to a given “class” (e.g. tumor with high or moderate
uptake, and background) for each voxel within a 3D ROI containing the tumor and its
surrounding physiological background. This probability is iteratively estimated by taking into account the voxel’s intensity with respect to the statistical distributions
(characterized by their mean and variance) within the ROI, and its spatial correlation
with neighbouring voxels. This approach has been previously validated for accuracy,
robustness and reproducibility using simulated and clinical datasets, including
homogeneous and heterogeneous MATVs (26–28). FLAB was exploited in this work
using 2 or 3 classes in order to adequately cover the entire MATV, including low uptake
regions.
Intra-tumor uptake heterogeneity was quantified considering few textural features that
have been previously shown as robust considering variability in image reconstruction
and acquisition protocols (20), and physiological reproducibility based on test-retest
acquisitions (22). Considered local heterogeneity parameters quantifying intensity
variations between each voxel and its immediate neighbours only, averaged over the
entire volume were entropy (E), homogeneity (H) and dissimilarity (D). Regional
heterogeneity parameters calculated through analysis at the level of groups of voxels
and areas of various sizes and intensities were high intensity emphasis (HIE),
size-zone variability (SZV) and size-zone percentage (ZP). A 64 grey level resampling was used,
and local features were computed over 13 directions (19,22).
Other global parameters such as skewness or kurtosis were excluded considering their
previously demonstrated poor robustness (20) and/or physiological reproducibility (22).
edge-preserving filtering (29) and PVE correction (30), as it has been previously shown that
such pre-processing is necessary for these parameters (18,21).
Finally, SUVmax, SUVmean, MATV and TLG were also included for comparison purposes
as they have been previously shown to provide prognostic value in NSCLC (5–9).
Statistical Analysis
Statistical analyses were performed using MedcalcTM (MedCalc Software, Belgium). Inter-observer’s agreement regarding Hvisu was estimated using the weighted Kappa
test with linear weights. Correlation between Hvisu and quantitative features was
assessed using Spearman's rank correlation. Variables with non-normal distributions (e.g. MATV) were log-transformed.
The prognostic value of each feature for overall survival (OS) and recurrence-free
survival (RFS) was assessed through univariate analysis using Kaplan-Meier curves
and the log-rank test, with optimal cut-off values determined through receiver operating
characteristic (ROC) analysis. Statistically significant differences were considered for
p<0.05 after Bonferroni correction for multiple testing.
Multivariate analysis was performed with Cox regression by including clinical variables
along with image-derived features as continuous variables. Since there were 62
deaths, no more than 6 uncorrelated variables were included in separate models for
OS.
RESULTS
Inter-observer’s Agreement
Figure 1 illustrates three tumors with Hvisu values of 1, 2 and 3. About half of the tumors were scored as highly heterogeneous. Using the 3-point scale, inter-observer’s
agreement reached a moderately satisfactory level with a weighted kappa value of 0.64
(95% CI 0.52 to 0.75). The two observers were in agreement on the visual score for
74/102 tumors (73%). All discrepancies occurred between consecutive scores (1 and
2 or 2 and 3, never 1 and 3) (Supplemental Table 1). Using the five-level scale, inter-observer’s agreement decreased to 0.58 (95% CI 0.47 to 0.70), the two observers
agreeing on 62/102 (61%) (Supplemental Table 2). For the subsequent analysis, only
the 3-point scale was considered, and only one value of Hvisu obtained through
consensus was used.
Correlation Between Visual Scoring and Quantitative Heterogeneity
Significant correlations were observed between Hvisu and quantitative features
(Supplemental Table 3). Highest correlations were observed for local and regional TF
with from 0.59 to 0.61 except ZP and HIE (0.44, p<0.0001 and 0.20, p=0.04 respectively). CHAUC was not correlated with Hvisu (0.07, p=0.5), whereas SUVCOV showed similar correlation as HIE (0.22, p=0.027) (Supplemental Fig 2).
SUVmax and SUVmean were not correlated with MATV (r<0.2). On the other hand, TF
showed variable levels of correlation with MATV, with r=0.6, -0.7 and 0.7 for entropy,
dissimilarity and homogeneity respectively, and r=-0.5, -0.6 and -0.3 for SZV, ZP and
HIE respectively. These correlations show that although heterogeneity is correlated
with volume, such heterogeneity measurements could provide complementary
information.
Survival Analysis
Median follow-up was 36.6±11.8 months. After surgery, 32 patients had evidence of
were 18.4 (range 1-58, 95% CI 14.5-23.1), and 11.4 (range 1-58, 95% CI 6.8-18.4)
months respectively.
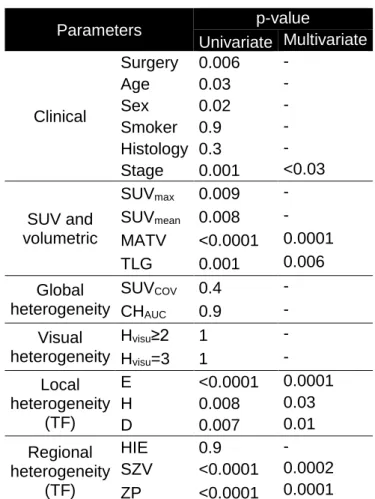
In the univariate analysis (table 2), surgery (p=0.006), gender (p=0.02), age (p=0.03)
and stage (p=0.001) were significantly associated with OS, as well as standard SUV
or volume parameters (p from 0.009 for SUVmax to <0.0001 for MATV). For instance,
patients with MATV>35 cm3 had a median survival of 10 months vs. 49 months for those with MATV≤35 cm3. Patients who underwent surgery survived almost twice as
long (median survival of 28 months) compared to those who did not (median survival
of 15 months).
Higher visual heterogeneity (Hvisu=3) was associated with poorer OS, although the
trend was not statistically significant. Patients with Hvisu=3 had a median survival of 17
months, whereas those with Hvisu<3 had a median survival of 20 months. Higher heterogeneity assessed by TF was associated with poorer OS (p≤0.007 for local TF
and <0.0001 for regional TF, except HIE). For example, entropy>0.75 was associated with a median survival of 11 months vs. 49 months for those with entropy≤0.75.
SUVCOV and CHUAUC were not associated with OS (p=0.4 and 0.9 respectively). Figure
3 provides examples of Kaplan-Meier curves for the different parameters considered.
In the multivariate Cox models that included surgery, gender, stage, SUVmax (or
SUVmean) and either MATV, TLG or one heterogeneity parameter (since these latter
are correlated with each other), stage remained an independent prognostic factor but
not surgery, gender and SUVmax (or SUVmean). MATV, as well as all heterogeneity
quantification parameters obtained through TF, except HIE, remained independent
prognostic factors with respect to stage (although not independent on each other).
The addition of risk factors allowed a better differentiation of patients’ outcome.
had a median survival of 9 months and a 3-year survival rate of 0%, whereas the other
group had a median survival of 49 months and a 3-year survival rate of 50% (Fig. 5).
The complementary value of TF heterogeneity to MATV can be shown by comparing
the finer stratification of patients into 4 groups with statistically different outcomes (Fig.
6). MATV combined with entropy (Fig. 6B) led to different survival curves compared to
the use of MATV alone (Fig. 6A). MATV>50 cm3 were associated with longer survival
than MATVs between 35 and 50 cm3. However, among volumes above 35 cm3, those
with entropy>0.95 had significantly shorter survival (Fig. 6B).
Concerning recurrence free survival none of the patients treated with
chemoradiotherapy achieved complete response, therefore only patients who
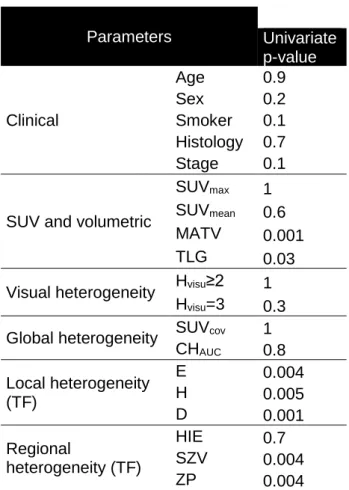
underwent surgery were included (table 3). None of the clinical variables were
associated with RFS. MATV (p=0.001) and TLG (p=0.03) were significant prognostic
factors of RFS, in contrast to SUV measurements. Hvisu=3 was associated with a
median RFS of 7 months whereas median RFS was 25 months for those with Hvis<3,
although this trend was not statistically significant (p=0.3). Higher heterogeneity as quantified through TF analysis was significantly associated with poorer RFS (p≤0.004),
except when using HIE. For example, patients with a dissimilarity>0.57 had a median RFS of 6 months vs. 25 months for those with dissimilarity≤0.57. No multivariate
analysis was performed for RFS due to the lack of uncorrelated variables statistically
significant in the univariate analysis. Figure 4 provides examples of corresponding
Kaplan-Meier curves.
DISCUSSION
There is currently an increasing interest in the use of PET image derived features
may be considered as a simple and valuable way of scoring intra-tumor tracer
distribution. In the present study, visual/qualitative and quantitative assessment of
heterogeneity were simultaneously considered in the same NSCLC patient cohort and
compared in terms of prognostic value.
Firstly, our results suggest that quantitative parameters obtained through TF analysis
are correlated with the visual assessment by nuclear medicine physicians. Our study
also demonstrated an added value for TF analysis over visual assessment. The first
advantage is that, as MATV and heterogeneity determination is fully automatic, the
only inter- or intra-observer variability that might occur lies in the tumor location
identification. Automated characterization is therefore likely to reduce inter-observer
variability associated with visual assessment, which as shown in this study was an
issue for 27% of the cases. This was even worse when considering a larger scale for
visual scoring, with a substantial decrease of inter-observer agreement from 0.64 to
0.58 (from 73% to 61% of the 102 tumors). As a result this finer scale was not further
exploited, clearly demonstrating the difficulty in reaching a fine visual characterization
of intra-tumor tracer distribution.
A recent study comparing visual heterogeneity scoring, SUVCOV and CHAUC found high
correlations (0.72&0.87 for SUVCOV&CHAUC respectively) (31). In our study, lower
correlations were found between Hvisu and TF, whereas SUVCOV and CHAUC were not
correlated with Hvisu. Several factors may explain this difference. This previous study
included only 9 gastrointestinal stromal tumors (GIST) and 12 malignant lymphomas
(ML), manually delineated within a single 2D slice. A four-value scale was used for
visual scoring and inter-observer variability was not reported. The authors did not take
into account the difference in volumes between GIST and ML. These volumes were
and SUVCOV might be appropriate to characterize high heterogeneity levels as found
in very large GIST and ML lesions, but may not be sufficient to quantify finer
heterogeneity differences found in smaller NSCLC tumors. This is also supported by
the distributions of CHAUC values with a small range (SD=0.05) in our study (0.32±0.05)
compared to those found in Watabe et al (0.41±0.14 for GIST and 0.64±0.08 for ML)
(31).
The second advantage of TF analysis is that it leads to additional prognostic value that
may be useful for patient management. A stronger differentiation between groups of
patients with different outcome was highlighted by combining parameters, albeit being
correlated with each other. As an example, patients with MATV>35 cm3 combined with entropy>0.74 and zone percentage≤0.32 had a median survival of 9 months and a
year survival of 0%, whereas the others had a median survival of 60 months and a
3-year survival of 50% (Fig. 5). As shown in figure 6, despite the correlation between TF
parameters and MATV, patient outcome could not be fully described using the MATV
alone (Fig. 6A). This is illustrated in figure 6B, showing that smaller but more
heterogeneous lesions were associated with poorer OS than larger and more
homogeneous ones.
A recent study suggested that entropy is unable to predict tracer uptake heterogeneity
for tumors with MATV<45 cm3 (32). In our cohort, volumes were 48±58 cm3 (range
3-415, median=34). Our results only partly confirm this, since entropy provided additional
information with respect to MATV in larger volumes (Fig. 6). MATV between 30 and 45
cm3 exhibited an entropy between 0.55 and 0.81 (Supplemental Fig. 3A), with a weak
correlation of r=0.57. For tumours with volumes <30 cm3 this correlation was equal to
0.95, suggesting that for MATV<30 cm3 the information provided by entropy was
not be applicable for other heterogeneity measurements, since in our study different
values of homogeneity or zone percentage were observed for similar volumes down to
the lower limit of 3 cm3 (Supplemental Fig. 3B, 3C).
Regarding the prognostic value of PET parameters in NSCLC, including SUV, MATV
and derived TLG (5–9) and TF (15), our findings are in line with previous results. The
only study that investigated the prognostic value of 18F-FDG PET heterogeneity in
NSCLC was conducted on 53 patients with stage 3 and above, exclusively treated with
combined chemoradiotherapy (non-surgical patients) (15). Their results regarding
MATV and TLG, showing no significant association with outcome might be confounded
by the fact that all their patients were stage 3 and 4 combined with the use of a
fixed-thresholding delineation approach. However, considering tracer distribution they found
that heterogeneity quantified through busyness, coarseness, contrast and complexity
was significantly associated with RFS and OS. None of these parameters were
included in our study because we have previously demonstrated their lower
reproducibility (22). However, although our parameters were different and extracted
from MATVs delineated using a more robust segmentation method, we also found that
intra-tumor 18F-FDG heterogeneity was significantly associated with outcome, for
non-surgical patients but also for non-surgical ones, which have not been evaluated in previous
studies. In the present study, the heterogeneity parameters obtained through TF
analysis remained independent prognostic factors of OS with respect to standard
clinical variables such as gender, age, stage and surgery, in contrast to visual
heterogeneity assessment.
Our study is limited by its retrospective nature. It included a mixture of different
treatments (with or without surgery, radiotherapy, chemotherapy), leading to a
allowed taking into account surgery in the survival analysis. The large number of
squamous cell carcinomas in our cohort was due to the exclusion of metastatic disease
(mostly adenocarcinomas), since related patient management and prognosis greatly
differ. We considered more interesting to assess new parameters to refine patient
stratification beyond the well-established TNM classification.
A last limitation of our study is that we focused on the primary tumor. Including lymph
nodes in the analysis could be of importance due to their impact on prognosis (33), but
was outside the scope of the present study focusing on tracer distribution
heterogeneity, which is meaningless to assess on small structures such as lymph
nodes, considering the limited spatial resolution in PET imaging. The main objective of
this study was to determine whether or not automated quantification through TF
analysis could relate to visual assessment of PET images, and primary tumor analysis
was sufficient within this context.
CONCLUSIONS
Automated quantification of intra-tumor 18F-FDG uptake heterogeneity in NSCLC
through textural feature analysis provides parameters that are correlated with visual
analysis by experts. Nevertheless, our results also highlight several advantages of
using automated quantification, including objective heterogeneity evaluation with
reduced inter-observer variability, and more clinically pertinent stratification through
References
1. Krause BJ, Schwarzenbock S, Souvatzoglou M. FDG PET and PET/CT.
Recent Results Cancer Res. 2013;187:351–69.
2. Jarritt PH, Carson KJ, Hounsell AR, Visvikis D. The role of PET/CT scanning in radiotherapy planning. Br J Radiol. 2006;79 Spec No 1:S27–35.
3. Wahl RL, Jacene H, Kasamon Y, Lodge MA. From RECIST to PERCIST: Evolving Considerations for PET response criteria in solid tumors. J Nucl Med. 2009;50 Suppl 1:122S–50S.
4. Herrmann K, Benz MR, Krause BJ, Pomykala KL, Buck AK, Czernin J. (18)F-FDG-PET/CT in evaluating response to therapy in solid tumors: where we are and where we can go. Q J Nucl Med Mol Imaging. 2011;55(6):620–32.
5. Chen HH, Chiu NT, Su WC, Guo HR, Lee BF. Prognostic value of whole-body total lesion glycolysis at pretreatment FDG PET/CT in non-small cell lung cancer.
Radiology. 2012;264(2):559–66.
6. Kahraman D, Holstein A, Scheffler M, et al. Tumor lesion glycolysis and tumor lesion proliferation for response prediction and prognostic differentiation in patients with advanced non-small cell lung cancer treated with erlotinib. Clin Nucl Med. 2012;37(11):1058–1064.
7. Kim K, Kim S-J, Kim I-J, Kim YS, Pak K, Kim H. Prognostic value of volumetric parameters measured by F-18 FDG PET/CT in surgically resected non-small-cell lung cancer. Nucl Med Commun. 2012;33(6):613–620.
8. Liao S, Penney BC, Wroblewski K, et al. Prognostic value of metabolic tumor burden on 18F-FDG PET in nonsurgical patients with non-small cell lung cancer. Eur
J Nucl Med Mol Imaging. 2012;39(1):27–38.
9. Hyun SH, Ahn HK, Kim H, et al. Volume-based assessment by (18)F-FDG PET/CT predicts survival in patients with stage III non-small-cell lung cancer. Eur J
Nucl Med Mol Imaging. 2014;41(1):50–58.
10. Basu S, Kwee TC, Gatenby R, Saboury B, Torigian DA, Alavi A. Evolving role of molecular imaging with PET in detecting and characterizing heterogeneity of cancer tissue at the primary and metastatic sites, a plausible explanation for failed attempts to cure malignant disorders. Eur J Nucl Med Mol Imaging. 2011;38(6):987– 91.
11. Visvikis D, Hatt M, Tixier F, Cheze Le Rest C. The age of reason for FDG PET image-derived indices. Eur J Nucl Med Mol Imaging. 2012;39(11):1670–2.
12. Lambin P, Rios-Velazquez E, Leijenaar R, et al. Radiomics: extracting more information from medical images using advanced feature analysis. Eur J Cancer. 2012;48(4):441–6.
13. Chicklore S, Goh V, Siddique M, Roy A, Marsden PK, Cook GJ. Quantifying tumour heterogeneity in 18F-FDG PET/CT imaging by texture analysis. Eur J Nucl
Med Mol Imaging. 2013;40(1):133–40.
14. Davnall F, Yip CS, Ljungqvist G, et al. Assessment of tumor heterogeneity: an emerging imaging tool for clinical practice? Insights Imaging. 2012;3(6):573–89. 15. Cook GJ, Yip C, Siddique M, et al. Are pretreatment 18F-FDG PET tumor textural features in non-small cell lung cancer associated with response and survival after chemoradiotherapy? J Nucl Med. 2013;54(1):19–26.
16. Miller TR, Pinkus E, Dehdashti F, Grigsby PW. Improved prognostic value of 18F-FDG PET using a simple visual analysis of tumor characteristics in patients with cervical cancer. J Nucl Med. 2003;44(2):192–7.
17. El Naqa I, Grigsby P, Apte A, et al. Exploring feature-based approaches in PET images for predicting cancer treatment outcomes. Pattern Recognit.
2009;42(6):1162–1171.
18. Van Velden FH, Cheebsumon P, Yaqub M, et al. Evaluation of a cumulative SUV-volume histogram method for parameterizing heterogeneous intratumoural FDG uptake in non-small cell lung cancer PET studies. Eur J Nucl Med Mol Imaging. 2011;38(9):1636–47.
19. Tixier F, Le Rest CC, Hatt M, et al. Intratumor heterogeneity characterized by textural features on baseline 18F-FDG PET images predicts response to concomitant radiochemotherapy in esophageal cancer. J Nucl Med. 2011;52(3):369–78.
20. Galavis PE, Hollensen C, Jallow N, Paliwal B, Jeraj R. Variability of textural features in FDG PET images due to different acquisition modes and reconstruction parameters. Acta Oncol. 2010;49(7):1012–6.
21. Hatt M, Tixier F, Cheze Le Rest C, Pradier O, Visvikis D. Robustness of intratumour 18F-FDG PET uptake heterogeneity quantification for therapy response prediction in oesophageal carcinoma. Eur J Nucl Med Mol Imaging.
2013;40(11):1662–1671.
22. Tixier F, Hatt M, Le Rest CC, Le Pogam A, Corcos L, Visvikis D.
Reproducibility of tumor uptake heterogeneity characterization through textural feature analysis in 18F-FDG PET. J Nucl Med. 2012;53(5):693–700.
23. Visvikis D, Turzo A, Gouret A, et al. Characterisation of SUV accuracy in FDG PET using 3-D RAMLA and the Philips Allegro PET scanner. J Nucl Med.
2004;45(5):103.
24. Hatt M, Cheze le Rest C, Turzo A, Roux C, Visvikis D. A fuzzy locally adaptive Bayesian segmentation approach for volume determination in PET. IEEE Trans Med
Imaging. 2009;28(6):881–93.
25. Hatt M, Cheze le Rest C, Descourt P, et al. Accurate automatic delineation of heterogeneous functional volumes in positron emission tomography for oncology applications. Int J Radiat Oncol Biol Phys. 2010;77(1):301–8.
26. Hatt M, Cheze Le Rest C, Albarghach N, Pradier O, Visvikis D. PET functional volume delineation: a robustness and repeatability study. Eur J Nucl Med Mol
Imaging. 2011;38(4):663–72.
27. Hatt M, Cheze-le Rest C, van Baardwijk A, Lambin P, Pradier O, Visvikis D. Impact of tumor size and tracer uptake heterogeneity in (18)F-FDG PET and CT non-small cell lung cancer tumor delineation. J Nucl Med. 2011;52(11):1690–7.
28. Hatt M, Cheze-Le Rest C, Aboagye EO, et al. Reproducibility of 18F-FDG and 3’-deoxy-3’-18F-fluorothymidine PET tumor volume measurements. J Nucl Med. 2010;51(9):1368–76.
29. Le Pogam A, Hanzouli H, Hatt M, Cheze Le Rest C, Visvikis D. Denoising of PET images by combining wavelets and curvelets for improved preservation of resolution and quantitation. Med Image Anal. 2013;17(8):877–891.
30. Boussion N, Cheze Le Rest C, Hatt M, Visvikis D. Incorporation of wavelet-based denoising in iterative deconvolution for partial volume correction in whole-body PET imaging. Eur J Nucl Med Mol Imaging. 2009;36(7):1064–75.
31. Watabe T, Tatsumi M, Watabe H, et al. Intratumoral heterogeneity of F-18 FDG uptake differentiates between gastrointestinal stromal tumors and abdominal malignant lymphomas on PET/CT. Ann Nucl Med. 2012;26(3):222–227.
32. Brooks FJ, Grigsby PW. The effect of small tumor volumes on studies of intratumoral heterogeneity of tracer uptake. J Nucl Med Off Publ Soc Nucl Med. 2014;55(1):37–42.
33. Cuaron J, Dunphy M, Rimner A. Role of FDG-PET scans in staging, response assessment, and follow-up care for non-small cell lung cancer. Front Oncol.
Figure captions
Figure 1. Illustration primary lung tumors with Hvisu values of 1, 2 and 3 (A, B and C
respectively). Green contours are the FLAB delineations and examples of features are
provided (values normalized between 0 and 1).
Figure 2. Illustration of the distributions of A) homogeneity and B) zone percentage
according to the three levels of Hvisu.
Figure 3. Examples of survival curves for OS (n=102) according to A) Stage, B)
SUVmax, C) Hvisu, D) zone percentage.
Figure 4. Examples of survival curves for RFS (n=48) according to A) Hvisu, B)
dissimilarity.
Figure 5. Survival curves for OS (n=102) with the stratification obtained according to
the combination of MATV, entropy and zone percentage.
Figure 6. Differentiation of four different overall survival groups using A) MATV alone
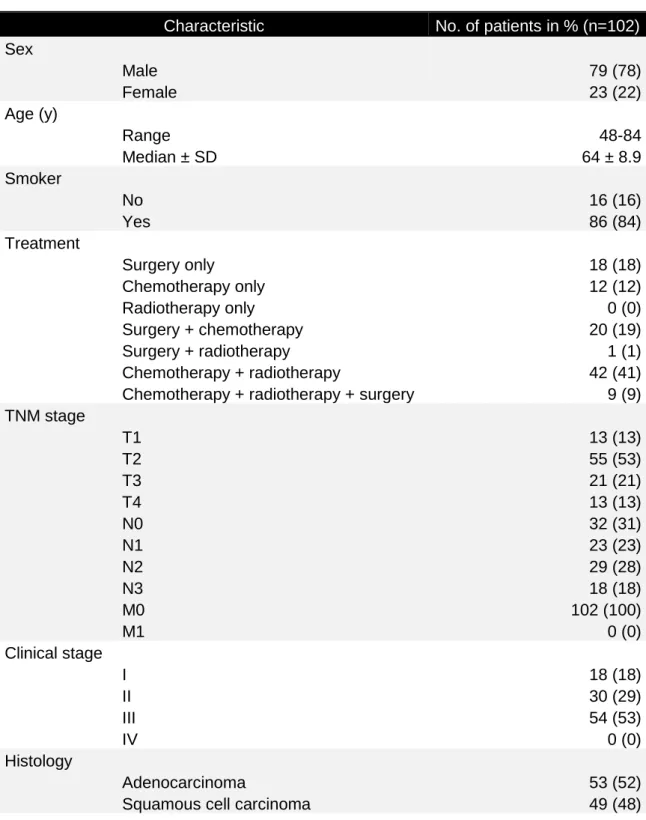
Table 1. Patient Characteristics
Characteristic No. of patients in % (n=102)
Sex Male 79 (78) Female 23 (22) Age (y) Range 48-84 Median ± SD 64 ± 8.9 Smoker No 16 (16) Yes 86 (84) Treatment Surgery only 18 (18) Chemotherapy only 12 (12) Radiotherapy only 0 (0) Surgery + chemotherapy 20 (19) Surgery + radiotherapy 1 (1) Chemotherapy + radiotherapy 42 (41)
Chemotherapy + radiotherapy + surgery 9 (9)
TNM stage T1 13 (13) T2 55 (53) T3 21 (21) T4 13 (13) N0 32 (31) N1 23 (23) N2 29 (28) N3 18 (18) M0 102 (100) M1 0 (0) Clinical stage I 18 (18) II 30 (29) III 54 (53) IV 0 (0) Histology Adenocarcinoma 53 (52)
Table 2: OS analysis (n=102) Parameters p-value Univariate Multivariate Clinical Surgery 0.006 - Age 0.03 - Sex 0.02 - Smoker 0.9 - Histology 0.3 - Stage 0.001 <0.03 SUV and volumetric SUVmax 0.009 - SUVmean 0.008 - MATV <0.0001 0.0001 TLG 0.001 0.006 Global heterogeneity SUVCOV 0.4 - CHAUC 0.9 - Visual heterogeneity Hvisu≥2 1 - Hvisu=3 1 - Local heterogeneity (TF) E <0.0001 0.0001 H 0.008 0.03 D 0.007 0.01 Regional heterogeneity (TF) HIE 0.9 - SZV <0.0001 0.0002 ZP <0.0001 0.0001
Table 3: RFS analysis (n=48) Parameters Univariate p-value Clinical Age 0.9 Sex 0.2 Smoker 0.1 Histology 0.7 Stage 0.1
SUV and volumetric
SUVmax 1 SUVmean 0.6 MATV 0.001
TLG 0.03
Visual heterogeneity Hvisu≥2 1 Hvisu=3 0.3 Global heterogeneity SUVcov 1
CHAUC 0.8 Local heterogeneity (TF) E 0.004 H 0.005 D 0.001 Regional heterogeneity (TF) HIE 0.7 SZV 0.004 ZP 0.004