HAL Id: hal-01459888
https://hal-mines-paristech.archives-ouvertes.fr/hal-01459888
Submitted on 7 Feb 2017HAL is a multi-disciplinary open access
archive for the deposit and dissemination of sci-entific research documents, whether they are pub-lished or not. The documents may come from teaching and research institutions in France or abroad, or from public or private research centers.
L’archive ouverte pluridisciplinaire HAL, est destinée au dépôt et à la diffusion de documents scientifiques de niveau recherche, publiés ou non, émanant des établissements d’enseignement et de recherche français ou étrangers, des laboratoires publics ou privés.
Evaluation of ventilative cooling in a single family house
-Characterization and modelling of natural ventilation
Nicolas Dupin, Bruno Peuportier, Karsten Duer, Michael Cohen, Berenger
Favre, Olfa Mejri, Eric Vorger
To cite this version:
Nicolas Dupin, Bruno Peuportier, Karsten Duer, Michael Cohen, Berenger Favre, et al.. Evaluation of ventilative cooling in a single family house -Characterization and modelling of natural ventilation. SB 14 Barcelona, Oct 2014, Barcelone, Spain. �hal-01459888�
1
Evaluation of ventilative cooling in a single family house - Characterization
and modelling of natural ventilation
Speakers:
Dupin, Nicolas (ND)1; Peuportier, Bruno (BP)2; Duer, Karsten (KD)3; Cohen Michaël (MC)2; Favre, Berenger (BF)2; Mejri, Olfa (OM)2; Vorger, Eric (EV)2
1 VELUX France, Morangis, France, nicolas.dupin@velux.com
2 ARMINES CEP, Palaiseau, France, bruno.peuportier@mines-paristech.fr 3 VELUX A/S, Hørsholm, Denmark, karsten.duer@velux.com
Abstract: Passive cooling through window airing presents a promising potential for low energy
houses in order to avoid overheating risks and to reduce energy consumption of air conditionners. One barrier against this solution is the complexity of evaluating air flows, which limits the use of natural ventilation during the design phase of a building. This study aims at analyzing a characterization and modelling process allowing natural ventilation to be accounted for in the evaluation of energy performance and thermal comfortof a single-family house. The evaluation of summer comfort and passive cooling performance will be compared to measurements performed on a zero energy house Maison Air et Lumière, located near Paris. Window characterization, on-site air flow measurements, as well as ventilation evaluation method will be described in this paper; the accuracy of the evaluation method (ventilation flow rates and thermal comfort) will be assessed thanks to a specific measurement campaign.
2
Introduction
Low energy buildings, especially nearly Zero Energy Buildings (nZEB), are subject to significant overheating risks during summer and mid-season [1] [2]. Thermal simulations as well as experimental studies has shown the large potential of ventilative cooling; nevertheless, these studies were mainly focused on potential energy savings in office or commercial buildings [3] [4] and only few papers were published on the cooling potential of natural ventilation in dwellings.
One major barrier against the use of natural ventilation in the design process of a house is the difficulty of evaluating air flows through windows opening. The use of appropriate hypothesis and relevant coefficients regarding windows is crucial to perform building thermal simulations and accurately evaluate indoor thermal comfort of occupants.
The present work aims at studying a characterization and modelling process allowing natural ventilation to be accounted for in the evaluation of energy performance and thermal comfort of buildings. The approach is tested using the monitoring system of the zero energy Active House Maison Air et Lumière, located near Paris.
The project went through the following steps:
A test bench has been used to characterize the air flow features of a roof window (such features of roof windows are not well described in literature)
These air flow features have then been used for numerical simulations of the air flows and air temperatures in the building
On site measurements of air flows and air temperatures have been performed in order to get realistic data about natural ventilation and its contribution to summer comfort
Comparisons between simulations and on site measurements have been performed in order to validate the models used to evaluate air flow rates through windows. These comparisons are also used for checking the relevancy of numerical simulations in terms of summer comfort
Laboratory measurements
A test bench has been built in a laboratory in order to evaluate aerodynamic features of a roof window. A ventilator is used to create a regulated pressure difference between inside and outside environments of the roof window.
Air flow rates and pressure differences have been varying in order to get a curve and to derive C and n characteristics from the below empirical equation (powerlaw) [5] [6]:
𝑄 = 𝐶. (𝑃2− 𝑃1)𝑛 = 𝐶. (∆𝑃)𝑛 (1)
Figure 1: Test bench: aerodynamic chamber and regulated ventilator
3 The flow coefficient 𝐶 is depending on the free opening area (geometrical area), which is linked to the window size and opening angle. The flow coefficient can then be evaluated using the free opening area S, a discharge coefficient 𝐶𝑑and the air density 𝜌, using the following equation 𝐶 = 𝐶𝑑. 𝑆. (𝜌2)
𝑛
. Measurements were performed for ∆𝑃 varying from 0.05 to 10 Pa. The log-linearization of equation (1) gives 𝐿𝑜𝑔(𝑄) = 𝐿𝑜𝑔(𝐶) + 𝑛. 𝐿𝑜𝑔(∆𝑃)
An example of a fully opened window is shown in Figure 2.
It shows a log-linearization of measurements for a full opening of the window (maximum length of the actuator), measured for a large range of ∆𝑃.
In this figure, 𝑛 = 0.45 and 𝐶 = 0.32.
Similar measurements are performed for different openings. All 𝐶 and 𝑛 coefficients are shown in Table 3. With the assumption that the opening area S is around 0.07 m² (, we find a
Cd value 𝐶𝑑 = 𝐶𝑆. (𝜌2) 0.5
of around 0.75, which is near the standard values [7] [Etheridge, 1996].
On site measurements
The house extends over 2 storeys, 135 m² and is designed as a net zero energy house. Concrete slab on the ground floor and first floor are providing its thermal mass. The window-to-living-area is 1/3. All windows are equipped with dynamic solar protection and the operation of all systems in the building is fully automated.
The house is equipped with a detailed monitoring system providing event-logged data for both indoor and outdoor environments: indoor temperature, humidity, light level, as well as outdoor wind speed and direction, sun radiation
Window opening percent [%] n coefficient C coefficient 50 0.49 0.074 60 0.46 0.12 70 0.45 0.17 80 0.48 0.22 90 0.45 0.27 100 0.45 0.32
Table 3: Air flow characteristics of the roof window
Figure 2: Logarithm of the air flow rate with an opening of 100%
Figure 4: The nZEB Active House Maison Air et Lumière, located near Paris. © Adam Mørk
4 and temperature, are continiously monitored and recorded. Windows and awning blinds positions are continiously recorded in order to bring a complete description of the house: these input data will then be used with the dynamic simulation software Pléiades+Comfie for evaluating the complete approach of ventilative cooling.
The evaluation of on site air flow rates passing through this house were performed with tracer gas measurements using CO2. In addition,
wind velocity and pressure sensors were placed within the free opening areas of windows in order to validate the precision of the simplified models used for simulations (i.e. the “powerlaw” described in equation (1)). Figure 5 shows as an example the relative CO2 concentrations (CO2
concentration above outdoor level), measured in the living room for the two scenarios: internal doors being
opened (blue curve) or closed (green curve). The continuous lines and the dashed lines respectively correspond to the measurements during the morning and the afternoon.
The calculation of the air change rate is deduced from the general tracer gas mass balance equation [8]:
𝑉.𝑑𝐶𝑖𝑛𝑡(𝑡)
𝑑𝑡 = 𝑆(𝑡) − 𝑄(𝑡). (𝐶𝑖𝑛𝑡(𝑡) − 𝐶𝑜𝑢𝑡(𝑡)) (2) Where:
𝐶𝑖𝑛𝑡(𝑡) is the CO2 concentration of indoor air (ppm) 𝐶𝑜𝑢𝑡(𝑡) is the CO2 concentration of outdoor air (ppm) 𝑆(𝑡) is the injection rate of tracer gas into the room (m3/h) 𝑉 is the indoor air volume (m3)
𝑄(𝑡) is the air flow rate (m3/h)
Integration of equation (2) leads to an exponential function where the concentration is a function of time (𝐶𝑖𝑛𝑡(𝑡) − 𝐶𝑜𝑢𝑡(𝑡)) = 𝐶. 𝑒
−𝑄.𝑡
𝑉 where 𝐶 is a constant.
After log-linearization, the relative tracer gas concentration can be plotted against time and a linear regression gives the corresponding air change rate (being the slope of the line).
Air flow simulations
Thermal numerical simulations have been carried out in order to understand the behaviour of the building. The study of natural ventilation is then improved by using both thermal and air-flow models.
Figure 5: Relative CO2 concentration in the living room during
5 Air flow simulations requires data about wind pressure on external sides of windows. These pressures can be evaluated according to wind velocity and direction using pressure coefficients 𝐶𝑝. The software “Cp generator”1 was used in this study to evaluate 𝐶
𝑝 values of the windows.
Air flow simulations have been performed using CONTAM 7, allowing infiltrations, windows and room-to-room airflows to be evaluated, taking into account mechanical systems, wind pressures on windows and buoyancy effects.
CONTAM simulations were performed using laboratory measured 𝐶𝑑 and 𝑛 for roof windows – 0.75 and 0.5, respectively – and default CONTAM values for vertical windows – 𝐶𝑑 = 0.6
and 𝑛 = 0.65 [9].
Each tracer gas measurement period has been simulated using CONTAM. Table 6 shows the comparisons between on-site measured values and simulations output.
South bedroom temp [°C] North bedroom temp [°C] Bathroom temp [°C] Wind speed [m/s] Tracer Gas [ACH] CONTAM simulation [ACH]
Morning Closed door 23.7 21.3 22.5 3.6 13.4 13.9 Open door 23.7 21.3 22.5 2.8 22.5 20.6 Afternoon Closed door 27.1 26.5 26.2 2.3 13.2 16.6 Open door 27.1 26.5 26.2 2.3 19.8 19.5
Morning Closed door 24.2 22.5 23.3 3.6 13.4 14 Open door 24.2 22.5 23.3 3.6 14.6 17.4 Afternoon Closed door 26.5 25.2 25 2.9 10.6 13.2 Open door 27 26.1 25.6 2.8 13.1 17
Table 6: Measured and simulated Air Change per Hour (ACH)
Thermal simulations
A dynamic thermal simulation tool was used to evaluate temperature profiles in the house [10] based on measured outdoor conditions. It turns out that air change rates have a large influence on temperature profiles.
Different measurement and simulation conditions were used to compare typical cases and present the direct influence of natural ventilation on indoor thermal environment:
From 23rd to 26th of July 2012 without any natural ventilation
From 27th of July to 3rd of August with natural ventilation (all windows open) and internal
doors open
From 4th to 7th August with natural ventilation (all windows open) and internal doors closed.
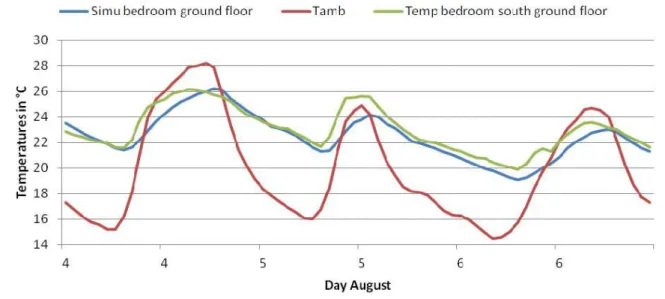
6 Figure 7 shows simulation and measurement results during the second period (internal doors open). There is a good correlation between simulated (blue) and measured temperature profiles (green), whereas the impact of night ventilation can easily be seen from the external temperature curve (red line).
Figure 7: Comparision of simulated and measured indoor temperature in the ground floor bedroom. All windows open and all internal doors closed
As a reference, simulations with closed windows have been carried out in order to evaluate the potential of ventilative cooling in a single family house. Figure 8 shows a comparison between “free-running” temperature (windows closed, in green), natural ventilation (windows open, in blue) and exterior temperature (in red).
Figure 8: Comparison on simulation cases. In green: all windows closed. In blue: all windows open. In red: outdoor air temperature
7
Feedback on occupation period
In order to confirm the house indoor climate, especially its summer thermal comfort, a family of 4 moved into the house from September 2012 to August 2013. This family lived inside the house for one year without any restrictions on their behaviour and use of the automated system:
wall-mounted push buttons were installed in order to allow a by-pass of windows openings or blinds moves. Figure 9 shows a comparison between a free running system (summer 2012, no occupants) and a “real case” scenario (summer 2013, 4 people inside the house) during a heat wave of the summer period.
It can be seen from Figure 9 that indoor temperature was 11°C lower than exterior temperature during unoccupied period, while the difference during the occupied period was 8°C. This deviation could be explained by the “real use” of the house, which leads to frequent opening of doors and sliding-doors, letting the outside warm air enter into the house. The presence of four people inside the house led to higher internal gains which added a significant heat source inside the house. In addition, the family got used to limit window openings during night time so that they were not disturbed by the wind effects while sleeping.
The indoor thermal comfort, as described before, has been described by the family after summer 2013:”When we were arriving inside the house, the heatwave still was present and the exterior air was above 30°C, and the temperature was 24 to 25°C inside the house without any other cooling system than natural cooling“2.
Conclusion
Measurements performed in Maison Air et Lumière have shown that, without ventilation, indoor temperature can reach 35°C. Ventilative cooling allowed a fast decrease of indoor temperature, keeping rooms below 27°C most of the time: this has shown that ventilative cooling was very efficient during this period.
During typical indoor and outdoor conditions – wind speeds between 2 to 3 m/s and temperature a difference lower than 3 °C – Air Change Rates between 10 to 22 h-1 have been achieved. Air
2 Quote from inhabitant of Maison Air et Lumière. Final conference Decembre 2013 « L’habitat de demain : au-delà des expériences. Retour sur l’expérience Maison Air et Lumière VELUX MODEL HOME 2020 »
Figure 9: Comparison of ventilative cooling benefits during a heat wave in unoccupied (left) and occupied periods (right). Blue: indoor temperature. Red: outdoor temperature
8 flow rates, measured on site and simulated with CONTAM, have shown a very good predictability with an average difference of 10% and local differences up to 30%.
In addition, dynamic thermal simulations have reproduced the indoor air temperature quite precisely, with an average difference between calculated and measured values around 1K. The accuracy of these simulations has allowed to evaluate the potential of ventilative cooling, by comparing 2 similar cases with and without natural ventilation during night. Indoor temperatures have then been reduced by 5°C on average thanks to ventilative cooling.
This work shows the feasability of modeling ventilative cooling and its impact on indoor thermal comfort for a project: it has been illustrated in this work, and could be extended to the design process of a project, assuming that relevant weather data are available. Natural ventilation provides a relevant way to achieve carbon neutral passive cooling in nZEB houses; thermal simulations have shown good correlation on temperature and the relevant air flow models used in this study could now be implemented into national regulatory softwares assuming the use of an efficient thermal model.
References
[1] Lomas, KJ. (2012). Summertime temperatures in 282 UK homes: thermal comfort and overheating risk. The changing context of comfort in an unpredictable world (7th Windsor Conference, London).
[2] NHBC Foundation (2012). Overheating in new homes. A review of the evidence.
[3] Artmann, N. (2006). Climatic potential for passive cooling of buildings by night-time ventilation in Europe. Integrating Environmentally Responsive Elements in Buildings (4th Annex, 44 Forum, Torino).
[4] Yao, R. (2009). Assessing the natural ventilation cooling potential of office buildings in different climate zones in China. Renewable Energy (Volume 34, Issue 12, pages 2697-2705). [5] Axley, J. (2002). Modeling the Performance of a Naturally Ventilated Commercial
Building with a Multizone Coupled Thermal/Airflow Simulation Tool. ASHRAE Transactions
2002 (V. 108, Annual Meeting, Honolulu, pages 1-16).
[6] [9] Walton, G. (2010). CONTAM User Guide and Program Documentation (Report NISTIR 7251, Gaithersburg).
[7] Etheridge, D. (1996). Building Ventilation: Theory and Measurement. Wiley.
[8] Cheong, K.W. (2001), Airflow measurements for balancing of air distribution system- tracer-gas technique as an alternative?. Building and Environment (Volume 36, Pages 955– 964).
[10] Peuportier, B. (1990). Simulation tool with its expert interface for the thermal design of multizone buildings. International Journal of Solar Energy (Volume 8, Pages 109-120).