HAL Id: hal-02277115
https://hal.univ-brest.fr/hal-02277115
Submitted on 3 Sep 2019
HAL is a multi-disciplinary open access
archive for the deposit and dissemination of
sci-entific research documents, whether they are
pub-lished or not. The documents may come from
teaching and research institutions in France or
L’archive ouverte pluridisciplinaire HAL, est
destinée au dépôt et à la diffusion de documents
scientifiques de niveau recherche, publiés ou non,
émanant des établissements d’enseignement et de
recherche français ou étrangers, des laboratoires
Loudness and distance estimates for noise bursts coming
from several distances with and without visual cues to
their source
Gauthier Berthomieu, Vincent Koehl, Mathieu Paquier
To cite this version:
Gauthier Berthomieu, Vincent Koehl, Mathieu Paquier. Loudness and distance estimates for noise
bursts coming from several distances with and without visual cues to their source. 23rd International
Congress on Acoustics, integrating 4th EAA Euroregio 2019, German Acoustical Society (Deutsche
Gesellschaft für Akustik, DEGA), Sep 2019, Aachen, Germany. pp.3897-3904,
�10.18154/RWTH-CONV-239023�. �hal-02277115�
Loudness and distance estimates for noise bursts coming from several
distances with and without visual cues to their source
Gauthier BERTHOMIEU(1), Vincent KOEHL(1), Mathieu PAQUIER(1)
(1)Lab-STICC, University of Brest, France, [email protected]
Abstract
The at-ear sound pressure decreases with the distance to the source. Since pressure plays an essential part in loudness judgments, loudness could be expected to decrease similarly with the distance to the source. Yet, several studies reported conflicting results when assessing loudness as a function of sound source distance. The present study gathers loudness judgments for noise bursts displayed from several distances from listeners in a virtual environment. A visual representation of the distant sound sources could or could not be available to the listeners in order to modify the perceived distance of these sounds since visual distance cues affect auditory distance perception. Sounds were displayed in free or diffuse fields in order to also provide auditory distance cues. The results of this study show that visual cues had no significant effect on loudness estimates, even though they significantly affected apparent source distance judgments. The discrepancy between these results and the generally accepted loudness constancy phenomenon could come from the instructions that were given to the listeners, which focused on “at-ear” loudness judgments whereas loudness constancy is predominantly obtained when asking the listeners to make loudness judgments based on the sound source power.
Keywords: Loudness, Distance, Audiovisual interactions
1
INTRODUCTION
In everyday life, humans combine information from their different senses to apprehend the world in which they live. In auditory research, audiovisual interactions are widely investigated as they underlie many phenom-ena. Earlier studies assumed that visual information could significantly affect perceived loudness [12, 3, 2] and auditory localization [5]. Besides, loudness perception is also known to depend on auditory localization [16]. The present study focuses on audiovisual interactions in conditions where a sound source is located at several distances from a listener. When a sound is emitted, it propagates in the environment and its intensity lowers as it gets farther from its source. Thus, the apparent loudness of this sound could be expected to decrease with the distance between the source and the listener. However, a loudness constancy phenomenon tends to demonstrate that loudness estimates can, in certain conditions, be independent of source distance [10,21]. This phenomenon was assumed to rely on auditory cues to the source power (such as the reverberant energy) rather than on the perceived source distance [21]. Yet, visual cues to distance were also reported to modify loudness estimates in conditions where auditory cues were fixed [9]. Then, it is unclear to what extent perceived loudness varies with sound source distance and visual information to the source. Moreover, determining such relations can be difficult because of the experimental design. Indeed, it can be complicated to easily manipulate a sound source distance while controlling the visual and auditory information provided to a listener in the real world. Then, the present experiment was set up in a virtual environment, which allows to control sound source distance, auditory and visual cues independently. This was carried out in order to observe the effects of visual information on the perceived loudness and distance of noise bursts displayed at several distances from a listener.
2
MATERIAL AND METHOD
A virtual environment was created in order to allow the experimenters to manipulate source distance, source level, source visibility and room acoustics independently while providing the participants with a natural
listen-ing situation. Durlisten-ing the experiment, listeners were seated on a chair and wore a HTC Vive virtual reality head mounted display (HMD) displaying a virtual visual environment. A loudspeaker and a large panel were displayed in this environment. The listener faced the loudspeaker, which could be fully obstructed by the panel if the latter was placed between the listener and the loudspeaker. A picture of the virtual environment is given in Fig. 1.
Figure 1. Representation of the virtual visual environment gathering the loudspeaker, the panel, and traffic cones. The green square depicts the listener’s position in the virtual environment, whose point of view faced the loudspeaker. The red path represents the possible positions of the loudspeaker and the blue path those of the panel. The ground texture is patterned with 1 m2 squares.
2.1 Auditory stimuli
Three room acoustics were studied: one anechoic, one from a large sports hall and one from a small concert hall. For creating the auditory stimuli used in the two reverberant rooms, sine sweeps were first displayed by a Genelec 8040A loudspeaker and recorded using a mh acoustics Eigenmike ambisonics microphone in a large sports hall (RT60= 2 s) and in a small concert hall (RT60= 0.5 s). Sweeps were recorded at a unique microphone
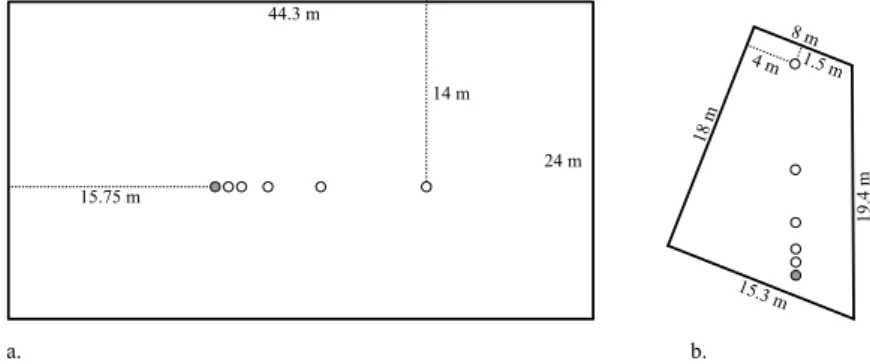
position while the loudspeaker was at a distance of 1, 2, 4, 8 and 16 m. Fig. 2 is a drawing of both rooms that includes a representation of the loudspeaker and microphone positions during the recordings.
15.3 m a. b. 24 m 44.3 m 15.75 m 14 m 18 m 8 m 19.4 m 4 m 1.5 m
Figure 2. Drawings (to scale) of the large sports hall (a.) and small concert hall (b.) in which the recordings were made. Filled circles depict the microphone positions, empty circles depict the loudspeaker positions. Fourth order ambisonics Room Impulse Responses (RIRs) were computed from these recordings. The final stimuli were obtained by convolving 200 ms white noise bursts with these RIRs for the two reverberant rooms
and with anechoic RIRs for the anechoic room.
In order to provide a realistic listening situation while reproducing the sounds over headphones, the yaw, pitch and roll values of the HMD were used to rotate the ambisonics field according to the movements of the subject’s head thanks to the ambiX Rotator plugin [7]. Finally, ambisonics signals were converted to binaural sounds using the IEM BinauralDecoder plugin1.
Virtual sound sources could display noise bursts at three different levels so that at-ear pressure level did not rely only on the sound source distance. These levels were fixed at 0, −6 and −12 dB with respect to a reference level. This reference source level was adjusted so that the sound pressure level reached 80 dB SPL at the subject’s ears when the source was located at 1 m from the listener.
45 stimuli were created this way, corresponding to the 3 source levels located at each of the 5 distances in each of the 3 rooms.
The sounds were displayed over open circum-aural headphones (Sennheiser HD 650) after the use of headphone compensation filters as provided by the IEM BinauralDecoder plugin1. The sounds were played in MAXMSP and were delivered to the headphones by a RME Babyface Pro sound card. Restitution levels were calibrated using a Brüel & Kjær sound calibrator Type 4231 and a Neumann KU 100 dummy head.
2.2 Visual stimuli
In their 2013 review of studies focusing on egocentric distance perception in virtual environments, Renner et al. [15] concluded with a list of elements that are likely to improve the quality of distance perception in virtual environments. They reported that “to facilitate distance perception as well as possible, it is important to provide binocular disparity, use high quality of graphics, carefully adjust the virtual camera settings, display a rich virtual environment containing a regularly structured ground texture, and enhance the user’s sensation of presence”. The visual environment of the present experiment was designed with regard to these recommendations. The HMD provides the subjects with most pictorial (occlusion, relative size, height in the visual field and aerial perspective) and non-pictorial (motion parallax, convergence and binocular disparity) visual distance cues. The 3D models were created and rendered in high quality then displayed on the 2160 × 1200 px screen of the HMD at 90 frames per second. A structured ground texture was rendered and traffic cones were added to enrich the virtual environment with constant size objects located at several distances. The head tracking provided by the HMD, which is known to be a component of immersion and to enhance presence [15], was linked to the head tracking of the audio stimuli so that the consistency of information across modalities was preserved, which is also an important factor for the sensation of presence [4].
Three different-sized environments were created, corresponding to the three rooms in which sounds were ren-dered. For the two reverberant rooms, the virtual environments were rooms that had the exact same dimensions and shapes as the actual rooms in which the recordings were made (see Fig. 2). For the anechoic room, no wall was represented and the environment was an infinite regularly-structured ground texture. This was achieved since the visual impression of the room enclosing the sound source is known to affect externalization [18] and could therefore also improve the sensation of presence.
2.3 Procedure
The experiment took place in a small, acoustically-isolated audiometric room. Participants sat in a chair which faced a tablet computer displaying a response interface that they could see in the virtual environment. The experiment was split in two sessions, each corresponding to one task that was either to estimate the egocentric source distance or to estimate the apparent loudness of the sounds it displayed.
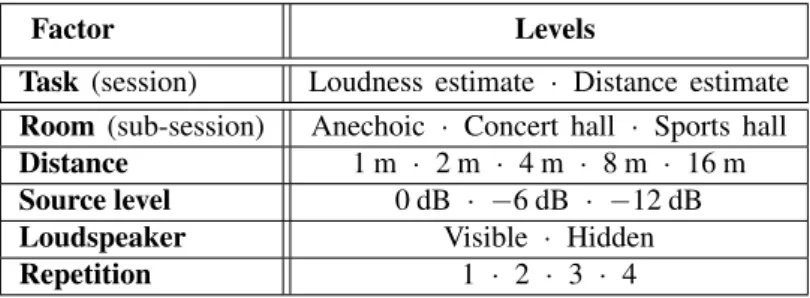
Each session was then split in three sub-sessions corresponding to each room. In each of these sub-sessions, all combinations of distance, sound source level and visibility of the loudspeaker were presented to each subject four times in a random order. This led to a total of 120 estimates (5 distances × 3 source levels × 2 visibility
conditions of the loudspeaker × 4 repetitions) per subject in each sub-session. See table 1 for a summary of factors levels and sessions. Apparent loudness was reported using a free-modulus magnitude estimation protocol [8] and apparent distance was reported in meters.
Table 1. Summary of the experimental conditions for each subject.
Factor Levels
Task (session) Loudness estimate · Distance estimate Room (sub-session) Anechoic · Concert hall · Sports hall
Distance 1 m · 2 m · 4 m · 8 m · 16 m
Source level 0 dB · −6 dB · −12 dB
Loudspeaker Visible · Hidden
Repetition 1 · 2 · 3 · 4
After each answer, the panel hid the loudspeaker while the loudspeaker moved to its position for the next trial. Then, the panel revealed or not the loudspeaker (according to whether the loudspeaker had to be visible or hidden in the trial to come), the sound was played and the participants could type their answer. If in the current trial the loudspeaker was hidden, the panel stayed in its position while the loudspeaker moved to its next position so that the hidden loudspeaker position was not revealed2.
Twenty subjects (5 women and 15 men aged 20 to 25 years) with normal hearing attended the experiment and were remunerated for their participation. Instructions were given in written form within the virtual environment and were also read by the experimenter at the beginning of each session (loudness or distance). Participants carried out the two sessions on two different weeks and performed around ten training estimates at the beginning of each sub-session which answers were not kept. Half of the subjects began with the distance estimate session and the other half with the loudness estimate session. Each session lasted approximately one hour.
3
RESULTS
Repeated-measures analyses of variance (ANOVA) were carried out to assess the factors effects and interactions on loudness and distance estimates. Four factors were included in each of the two analyses: the room (3 levels), the source distance (5 levels), the source level (3 levels) and the visibility of the source (2 levels). As this paper focuses on the effect of the visibility of the sound source on the perceived distance and loudness, only effects and interactions involving this factor will be analyzed and discussed. The results of these ANOVAs are given Table 2.
3.1 Loudness estimates
Since loudness estimates were gathered using a free-modulus scale, they were first normalized using the same method as described by Altmann et al. [1]. During this process, estimates were converted to their logarithm which were normally distributed around the mean estimates. An ANOVA was performed on the normalized logarithm of the loudness estimates. As indicated by the results given in the right side of Table 2, visibility did not prove to have any significant effect on loudness estimates as well as no significant interaction with any other factor. The geometric means of the results are plotted in Fig. 3, which shows in each room (separated plots) the geometric mean of loudness estimates made when the loudspeaker was either visible (solid lines) or hidden (dashed lines). Each plot gathers three lines of each type (solid and dashed), corresponding to the three source levels (which is identified next to each line). This figure clearly shows that apparent loudness estimates were similar whether the loudspeaker was visible (solid lines) or hidden (dashed lines) in each of the experimental configurations and that loudness constancy did not occur in any of these configurations.
Table 2. Results of the two ANOVAs. The left-side of the table shows the results of the ANOVA performed on the logarithm of the distance estimates. The right-side of the table shows the results of the ANOVA performed on the logarithm of the loudness estimates. None of the interactions involving three or more factors was found to be significant by one of the ANOVAs. Those interactions were therefore not displayed as a matter of clarity.
Dependent variable Distance estimates Loudness estimates
Source SS DF MS F Sig.p SS DF MS F Sig.p
Room 9.165 1.132* 8.097 14.601 ...000000111 1.783 2 .892 9.879 <<< ...000000111 Distance 163.111 1.136* 143.526 244.122 <<< ...000000111 36.353 1.125* 32.316 186.970 <<< ...000000111 Level 16.564 1.183* 14.002 235.614 <<< ...000000111 24.763 1.042* 23.759 217.213 <<< ...000000111 Visibility .170 1 .170 3.543 .075 .017 1 .017 2.125 .161 Room × Distance .693 2.423* .286 3.948 ...000222000 2.059 2.883* .714 37.202 <<< ...000000111 Room × Level .807 2.070* .390 11.130 <<< ...000000111 .055 2.451* .022 1.492 .233 Distance × Level 1.799 2.562* .702 21.464 <<< ...000000111 .269 4.077* .066 5.960 <<< ...000000111 Room × Visibility .294 1.374* .214 7.659 ...000000666 .004 2 .002 .528 .594 Distance × Visibility 1.531 1.610* .951 13.736 <<< ...000000111 .014 2.363* .006 .712 .518 Level × Visibility 1.476 1.075* 1.373 14.996 ...000000111 .009 2 .004 1.230 .304
*A Greenhouse-Geisser correction was applied to the degree of freedom due to a sphericity assumption violation.
1 2 4 8 16 101 Visible source Hidden source 1 2 4 8 16 1 2 4 8 16 0 dB -12 dB -6 dB 0 dB -6 dB -12 dB 0 dB -12 dB -6 dB Loudness e sti mate
Figure 3. Geometric means of loudness estimates, with 95% confidence intervals. Means and limits of the con-fidence intervals were computed on the logarithm of the estimates and converted back to the original estimates.
3.2 Distance estimates
As distance estimates are approximately normally distributed along a logarithmic scale [20], each individual distance estimate was converted to its logarithm prior to the analysis. The arithmetic mean of the four repetitions of each trial was then computed for each participant and each trial. A repeated-measures analysis of variance was conducted on these converted results. Results of this ANOVA are given in the left side of Table 2. Visibility did not prove to have a significant simple effect on distance estimates, similarly to loudness, but significantly interacted with the three other factors (level, distance and room), contrarily to loudness.
The significant “Level × Visibility” interaction shows that sound source level did not have the same effect on distance estimates whether the loudspeaker was hidden or visible. A Bonferroni post hoc test revealed significant
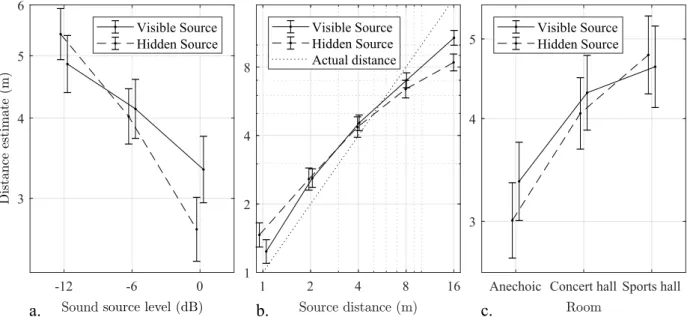
differences across source visibility conditions at the source levels −12 dB (p = .046) and 0 dB (p = .002). As a result (see Fig. 4 a.), the distance estimate as a function of source level has a smoother slope when the loudspeaker was visible (solid line) compared to when the loudspeaker was hidden (dashed line).
The significant “Distance × Visibility” interaction indicated that the distance estimates depended on the distance itself and on the visibility of the loudspeaker. Bonferroni post hoc tests revealed a significant difference between the two distances reported with or without visible loudspeaker when the latter was located at 1 m (p = .015), 8 m (p = .025) and 16 m (p = .001). For the closest distance (1 m), the estimated distance was closer when the source was visible than when it was hidden whereas the contrary was observed at the two farthest distances. This is shown in Fig. 4 b., where the averaged distance estimates made when the loudspeaker was either visible (solid line) or hidden (dashed line) are represented together with the actual distance of the loudspeaker. The significant “Room × Visibility” interaction indicated that the distance estimates depended on the room and on the visibility of the loudspeaker. Bonferroni post hoc tests revealed a significant difference between the two distances reported with or without visible loudspeaker in the anechoic room (p = .042) only, as it can be seen in Fig. 4 c., which represents the averaged distance estimates in each of the three rooms when the loudspeaker was either visible (solid line) or hidden (dashed line).
Dist ance estim ate (m) -12 -6 0 3 4 5 6 Visible Source Hidden Source 1 2 4 8 16 1 2 4 8 Visible Source Hidden Source Actual distance
Anechoic Concert hall Sports hall 3
4
5 Visible SourceHidden Source
a.
source level (dB)b.
c.
Figure 4. Geometric means of distance estimates as a function of Level (a.), Distance (b.) and Room (c.) for the two visibility conditions with 95% confidence intervals, computed in the same way as in Fig. 3.
4
DISCUSSION
The results of this study state that the loudness estimates were the same whether the loudspeaker was visible or hidden, even though this was not the case for distance estimates.
According to the statistical analysis of the distance estimates, the “Level × Visibility” interaction was signifi-cant, and distance estimates were found to be less dependent on the source level (and then on the at-ear SPL) when the source was visible than when it was hidden. This occurred not only in the anechoic room (where visual cues were the only absolute distance cues available) but also in the two reverberant rooms, which sup-ports the prevalence of visual cues over auditory cues in distance estimates. Then, one could wonder if the sound source level still had an effect on distance estimates when the source was visible. A Bonferroni post hoc
test revealed that this was still the case, as distance estimates were significantly different between source levels (0 dB vs. −6 dB (p < .001), −6 dB vs. −12 dB (p < .001)) even when the source was visible.
The significant “Distance × Visibility” interaction revealed that seeing the loudspeaker led to closer distance estimates when the loudspeaker was close to the participants and to farther estimates when the loudspeaker was distant. Since distance estimates are often overestimated for close sources and underestimated for remote sources in auditory and not in visual depth perception [6], this interaction proves an improvement of distance estimates when visual cues were available, as it can be seen in Fig. 4 b. where the averaged distance estimates made when the loudspeaker was visible (solid line) are closer to the actual distances (dotted line) than the averaged distance estimates made when the loudspeaker was hidden (dashed line).
The significant “Room × Visibility” interaction and its post hoc test indicated that the distance perception depended on the visual cues only if they were the only available distance cues. In the reverberant rooms, the diffuse field and visual cues appeared to provide the participants with similar information about distance. Despite the effective modification of perceived distance achieved by providing the participants with visual cues to the sound source distance, no significant effect of the visibility of the loudspeaker was found on the loudness estimates in any experimental condition. These findings are in accordance with previous studies that found no loudness constancy with the distance of non-familiar sound sources when asking the participants to base their judgment on the loudness “at the ear” [17, 13, 1], as opposite to judgments based on the loudness “at the source”, which are more likely to show loudness constancy [10, 21]. However, loudness constancy had been observed when asking participants to report apparent loudness estimates for speech [14,19]. This might be due to the particularities of speech, which contains intrinsic information about its source power (a whisper is known to be less powerful than a shout), and which involves a specific perception [11]. Then, one could wonder if apparent loudness perception relies on the source power perception. In the current study, direct information about the source power was available in the reverberant rooms through the reverberant energy, which was not the case in the anechoic room. However, the “Room × Level” interaction did not have a significant effect on loudness estimates. This means that apparent loudness was the same whether information about the sound source power was available or not.
5
CONCLUSIONS
The results of the present experiment show no interaction between visual information and “at the ear” loudness estimates for white noise bursts displayed by a loudspeaker in anechoic or reverberant virtual environments, even though distance estimates depended significantly on visual information. These findings support the hypothesis that, contrarily to speech, information about the source level has no effect on “at the ear” loudness estimates for noise. Further experiments will be carried out following this hypothesis, which will investigate “at the source” loudness estimates for noise and both loudness estimates for speech in the environments of the present study.
ACKNOWLEDGEMENTS
The authors wish to thank the IRT b<>com, the staff of the “Image & Son” department of the University of Brest and everyone who participated in this experiment.
REFERENCES
[1] C. F. Altmann, M. Matsuhashi, M. Votinov, K. Goto, T. Mima, and H. Fukuyama. Visual distance cues modulate neuromagnetic auditory N1m responses. Clin. Neurophysiol., 123(11):2273–2280, 2012.
[2] G. Berthomieu, V. Koehl, and M. Paquier. Directional loudness of low-frequency noises actually presented over loudspeakers and virtually presented over headphones. J. Audio Eng. Soc., in press.
[4] R. M. Held and N. I. Durlach. Telepresence. Presence: Teleoperators Virtual Environ., 1(1):109–112, 1992. [5] E. Hendrickx, M. Paquier, V. Koehl, and J. Palacino. Ventriloquism effect with sound stimuli varying in
both azimuth and elevation. J. Acoust. Soc. Am., 138(6):3686–3697, 2015.
[6] A. J. Kolarik, B. C. J. Moore, P. Zahorik, S. Cirstea, and S. Pardhan. Auditory distance perception in humans: a review of cues, development, neuronal bases, and effects of sensory loss. Atten Percept Psychophys, 78(2):373–395, 2016.
[7] M. Kronlachner. Plug-in Suite for mastering the production and playback in surround sound and ambison-ics. In Proceedings of the 136th AES convention, Berlin, Germany, 2014.
[8] L. E. Marks and M. Florentine. Measurement of loudness, part I: Methods, problems, and pitfalls. In Loudness, pages 17–56. Springer, 2011.
[9] D. H. Mershon, D. H. Desaulniers, S. A. Kiefer, T. L. Amerson, and J. T. Mills. Perceived loudness and visually-determined auditory distance. Perception, 10(5):531–543, 1981.
[10] K. Mohrmann. Lautheitskonstanz im entfernungswechsel. Zeitschrift f. Psychol., 145:145–199, 1939. [11] B. C. J. Moore. Speech perception. In An introduction to the psychology of hearing, pages 299–332. BRILL,
Leiden, Netherlands, 2012.
[12] E. C. Odgaard, Y. Arieh, and L. E. Marks. Brighter noise: Sensory enhancement of perceived loudness by concurrent visual stimulation. Cogn. Affect. Behav. Neurosci., 4(2):127–132, 2004.
[13] J. Petersen. Estimation of loudness and apparent distance of pure tones in a free field. Acta Acust. united Ac., 70:5, 1990.
[14] I. Pollack. On the measurement of the loudness of speech. J. Acoust. Soc. Am., 24(3):323–324, 1952. [15] R. S. Renner, B. M. Velichkovsky, and J. R. Helmert. The perception of egocentric distances in virtual
environments - A review. ACM Computing Surveys, 46(2):1–40, 2013.
[16] V. P. Sivonen and W. Ellermeier. Directional loudness in an anechoic sound field, head-related transfer functions, and binaural summation. J. Acoust. Soc. Am., 119(5):2965–2980, 2006.
[17] S. S. Stevens and M. Guirao. Loudness, reciprocality, and partition scales. J. Acoust. Soc. Am., 34(9B):1466–1471, 1962.
[18] J. Udesen, T. Piechowiak, and F. Gran. The effect of vision on psychoacoustic testing with headphone-based virtual sound. J. Audio Eng. Soc., 63(7/8):552–561, 2015.
[19] R. M. Warren, E. A. Sersen, and E. B. Pores. A basis for loudness-judgments. Am. J. Psychol., 71(4):700, 1958.
[20] P. Zahorik. Auditory distance perception in humans: A summary of past and present research. Acta Acust. united Ac., 91:12, 2005.
[21] P. Zahorik and F. L. Wightman. Loudness constancy with varying sound source distance. Nat. Neurosci., 4(1):78–83, 2001.