HAL Id: hal-01741829
https://hal.archives-ouvertes.fr/hal-01741829
Submitted on 7 Nov 2018HAL is a multi-disciplinary open access archive for the deposit and dissemination of sci-entific research documents, whether they are pub-lished or not. The documents may come from teaching and research institutions in France or abroad, or from public or private research centers.
L’archive ouverte pluridisciplinaire HAL, est destinée au dépôt et à la diffusion de documents scientifiques de niveau recherche, publiés ou non, émanant des établissements d’enseignement et de recherche français ou étrangers, des laboratoires publics ou privés.
continuous paddle dryer
Christophe Charlou, Patricia Arlabosse, Martial Sauceau
To cite this version:
Christophe Charlou, Patricia Arlabosse, Martial Sauceau. Characterisation of the residence time dis-tribution in a continuous paddle dryer. ECSM 2012 -3rd European Conference on Sludge Management, Sep 2012, Leon, Spain. 9 p. �hal-01741829�
CHARACTERISATION OF THE RESIDENCE TIME
DISTRIBUTION IN A CONTINUOUS PADDLE DRYER
C. Charlou, P. Arlabosse, M. Sauceau
Université de Toulouse;Mines Albi; CNRS; Centre RAPSODEE, Campus Jarlard, F-81013 Albi, France
E-mail of the corresponding author: Christophe.Charlou@mines-albi.fr
Abstract
A method to determine the residence time distribution (RTD) of municipal
sewage sludge in a continuous contact dryer with agitation has been developed.
The experiments were conducted using a pulse injection of chloride sodium and
by sampling and analysing the electrical conductivity of sludge leachate offline.
The principle of this method was to trace the solid phase of sludge during
drying. The accuracy and reproducibility of the method was quantified.
INTRODUCTION
Methods which exploit the energy content of the sludge are promising solutions. Even if thermal valorization routes encounter an increasing interest, they are still under-implemented in some European countries. Dedicated incineration, co-combustion, pyrolysis or gasification require a minimal lower heating value, which can only be reached by partial or full drying. Because of their relative low specific energy consumption compared to convective dryers [1], discs and paddle dryers are frequently used for sludge drying. In addition to the understanding of the clogging phenomena, one of the main scientific challenges for these technologies lies in the prediction of the residence time of the sludge in the drier to control the dry solids content at the dryer exit. A non-linear cell model based on the theory of Markov chains has been proposed to describe the stochastic motion of the sludge in a continuous paddle dryer [2, 3]. Heat and mass transfer are predicted according to the penetration theory [4], which was used successfully to represent experimental drying kinetics from laboratory scale batch dryers[5-7]. The cell model gives the moisture content, the product temperature, the solids hold up over the drying process as well as the residence time distribution (RTD). Computational results illustrate the ability of the cell model to qualitatively describe the drying process [3]. To refine this model, drying and residence time distribution experiments are now needed. The purpose of this work was to characterize the RTD of municipal sewage sludge in a continuous lab-scale contact dryer with agitation. The choice of the tracer, the calibration curve and the injection method are described in the”Material and Methods “section. The methodoly validated, the reproducibility and accuracy of the method is discussed in the last section.
MATERIAL AND METHODS
Feed material
The sewage sludge was sampled in the urban wastewater treatment plant (WWTP) of Albi city (France). The WWTP, designed for a capacity of 91 000 population equivalent (PE) but operating at 60 000 PE, implements a conventional extended aeration process, a nitrification/denitrification process, a biological phosphorus removal and an anaerobic digestion. Three drying experiments were performed, requiring sampling of 3 different sludge batches. The sludge was sampled after centrifugation. The sludge was stored at 4°C in a tight container and experiments were performed within 1 week after sampling.
Table 1: Initial dry solid contents Experiment 1 Experiment 2 Experiment 3 19.1 ± 0.1% 19.3± 0.1% 21.6 ± 0.1%
Continuous contact dryer
Currently, drying and RTD experiments are performed on a lab-scale (15 kg/h) continuous agitated contact dryer, designed and built in our institute. This dryer consists of a U-shaped jacketed trough with a rotating shaft. The trough is 1m long, 0.32m high and has an inner diameter of 0.16m. Three U-shaped electrical resistances (Chromalox, Soissons, France), 0.33m long each, are inserted in the double wall. Each can supply up to 6 104 W/m2. Three temperature sensors, one for each electrical resistance, are used for the thermal regulation of the dryer wall. These sensors, set at 0.001 m from the wall front side in contact with the sludge, are positioned at 0.164, 0.497 and 0.83 m from the dryer inlet, respectively. To limit the thermal losses towards the outside, the trough is insulated with a 5 cm thick Superwool® HT Fibers (Eurotech, Cessales, France), whose thermal resistance amounts to 13.9 m2.K/W. This trough is closed by a removable and tight hood with three trap doors. For each zone of
0.33m length, four heating cartridges (Chromalox, Soissons, France) are inserted in the 6-cm diameter hollow shaft. Each can supply up to 105 W/m2. Three temperature sensors, one for each electrical resistance, are used for the thermal regulation of the rotor. These sensors, set at 0.015 m from the outward, are positioned at 0.12, 0.455 and 0.79 m from the dryer inlet. 18 full wedge-shaped paddles are screwed on the rotor and heated by conduction. In the current configuration, the paddles are regularly distributed along the shaft. Scrapers, formed to interact with the paddles, are positioned on the trough. A 4 kW asynchronous motor with variable frequency drive (Leroy Somer, Colomiers, France) permits a precise adjustment of the rotor’s speed between 10 and 60 rpm. A contactless DR2112 torque meter (LR Mesures, Libourne, France), for measurements up to 500 Nm max, equips the stirrer.The drier rests on a support, which can be tilted of ± 5°. A Moineau 2.6 IVA pump (PCM, Levallois Perret, France) conveys the mechanically dewatered sludge from the feed hopper, of a capacity of 40l, to the dryer. Pump speed is controlled with a frequency inverter. The sludge is fed into one end of the trough and flows due to gravity, dryer slope and mechanical agitation to the opposite end, where the dry material is discharged. The solids hold-up in the dryer is controlled through an adjustable overflow. Superheated steam (1atm, 120°C) produced by a 4kW steam generator and a 0.3kW superheater (TATT, Eybens, France) is used as sweeping gas. The sweeping gas and the vapors evolved during processing are carried out through a central exhaust port.
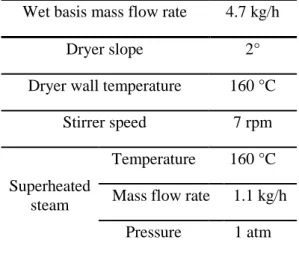
The operating conditions used for the drying experiments are summarized in Table 2. Table 2. Operating conditions
Wet basis mass flow rate 4.7 kg/h
Dryer slope 2°
Dryer wall temperature 160 °C
Stirrer speed 7 rpm
Superheated steam
Temperature 160 °C Mass flow rate 1.1 kg/h
Pressure 1 atm
Tracer
Choice and test validation
The choice of the tracer was made considering tracers currently used in wastewater treatment studies, the measurement techniques available in the lab, the repeatability and accuracy of the measurement techniques in regard to the required degree of precision and the “thermal stability’’ regarding drying conditions [8]. In the field, three tracers are mainly used: LiCl [9-11], NaCl [12] and rhodamine [13-16]. Sodium of chloride is a popular choice for tracer test studies given its low cost and the ease of monitoring. Electrical conductivity was retained as detection method and NaCl was selected as tracer.
The influence of the tracer powder dispersion method on the sludge structure and viscosity, on the drying kinetics and sticky phase were investigated. Even if mixing in a planetary mixer changes the rheological properties of the raw sludge and increases its stickiness, it does not have any influence on the drying kinetic and the sticky phase [17]. Thermal stability of the tracer was also analysed. 96% of the 10g of NaCl introduced into 2kg of sewage sludge were recovered in the dry matter after a drying experiments performed in a batch contact dryer [18] heated at 160°C.
To implement the detection method, the sludge samples must be dried at 105°C for 24hr and leached during 24hr with demineralised water (mwater/mDM=10).
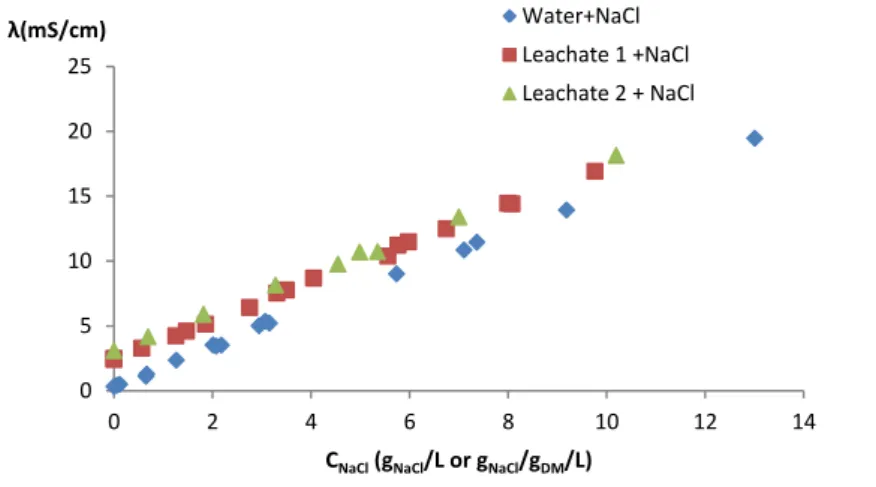
A serie of standards, in demineralised water and sludge samples, across a range of concentration near the expected concentration of NaCl in the leachate has been prepared. Calibration curves for NaCl in water and NaCl in sludge leachates are plotted on Figure 1. To investigate the influence of sludge composition, two batches were sampled at an interval of one month.
Figure 1: Calibration curves.
As expected, the electrical conductivity (λ) of the standards varies linearly with the ion concentrations. The data were fitted, according to Eq. (1). The sensitivity, a, and the conductivity of the background (demineralised water and sludge), λini are given in Table 3.
λ= λini + a*C NaCl (1)
The displacement of the curves induced by the conductivity of the background has to be considered for each sludge batch. Indeed, a change of the initial sludge conductivity might induce an over or underestimation of the tracer concentration and thus a wrong estimation of the experimental RTD.
Table 3. Coefficients of Eq. 1.
Water + NaCl Leachate 1+NaCL Leachate 2 + NaCl λini (mS.cm -1 ) 0.44 3.18 2.46 a (gNaCl.cm. mS-1L-1) or (gNaCl.cm. mS-1L-1.gDM-1) 1.48 1.47 1.49 r2 0.991 0.989 0.990
The calibration equation that should be used to calculate the NaCl concentration of unknown samples is given by Eq. 2.
(2)
Figure 2 shows the error in the calculation of the concentration from the calibration equation. The maximal error on the prediction is of 5%.
0 5 10 15 20 25 0 2 4 6 8 10 12 14 λ(mS/cm)
CNaCl (gNaCl/L or gNaCl/gDM/L)
Water+NaCl Leachate 1 +NaCl Leachate 2 + NaCl
Figure 2: Accuracy of the calibration curve.
Tracer injection and sludge sampling
A quantity of 90g of NaCl powder, determined in order to have a minimum pic of conductivity three times higher than the conductivity of the background was mixed with 56g of raw pasty sludge. The tracer was injected at the inlet of the dryer in one and half minute, which represents less than 1% of the theoretical residence time (τ≈200min ).
The whole sludge outflow mass was sampled and analysed. After the introduction of the tracer, samples were taken every 10 min or each 5 min and then dried and leached as described before. The concentration of NaCl in the leachate was measured with a DCM210 conductivity meter (MeterLab, Copenhage, Denmark).
When the sampling was achieved, the sludge flow was stopped and the collection of the solids retained in the dryer were collected and dried at 105°C during 24h.
Data Analysis
Knowing the NaCl concentration the exit distribution age function E(t) was calculated according to Eq. (3):
(3)
The mean residence time, <ts>, and averaged dryer velocity, , are then given by Eqs.
(4-5):
(4)
(5)
Where L is the length of the dryer.
The theoretical residence time, τ, and theoretical averaged dryer velocity, , were estimated
according to Eq. (6-7), respectively:
(6) (7) -6% -5% -4% -3% -2% -1% 0% 1% 2% 3% 4% 5% 0 20 40 60 80 100
(Cexp-Ccal)/Cexp
Where is the inlet dry matter mass flow rate and the dry solids hold-up in the dryer.
RESULTS AND DISCUSSION
Drying experiments
Three drying experiments were performed with the operating conditions given in Table 2. The cumulated mass of dry solids content and the dry solid content of the samples recovered at the dryer outlet during the 3 experiments is plotted on Figure 3. As it can be seen, the steady state is difficult to reach, mainly because of the sludge rheology. As the dry solid content of the raw sludge is higher for experiment 3, the mass flow rate of dry matter is higher (for a given mass flow rate of raw sludge).Consequently the slope of the curves on Figure 3a is slightly enhanced.
Figure 3: (a) Outlet cumulated dry mass, (b) dry solids content of experimentation. In spite of those fluctuations, the dry basis moisture content distribution, given on Figure 4, is reproducible for the three experiments.
Figure 4 : Dry basis moisture content distribution along the dryer
To conclude, it was not possible to reach the perfect steady state of the drier. But as the operating conditions remained unchanged during the experiments the steady state was assumed to be obtained.
RTD experiments
Figure 5 shows the conductivity and the percentage of recovered tracer versus the sampling time after the tracer injection. As the conductivity of the background were higher for the experiment 1 , the corresponding curve is shifted upwards. Nevertheless, shape of the three curves is similar.
0 2 4 6 8 10 12 0 5 10 15 Ou tl et c u m u la te d d ry m a ss (k g ) Time (hr) Experiment 1 Experiment 2 Experiment 3 0% 10% 20% 30% 40% 50% 60% 70% 80% 90% 100% 0 5 10 15 D ry so li d s co n te n t Time (hr) Experiment 1 Experiment 2 Experiment 3 0 1 2 3 4 5 0 0.5 1 1.5 D ry basi s m oi st ur e cont e nt Dryer length (m) Experiment 3 Experiment 2 Experiment 1 (a) (b)
Figure 5: (a) Conductivity measurements and (b) Percentage of recovered tracer versus sampling time.
Approximately 6 hours after the tracer had been injected, the electrical conductivity of the samples tends toward the initial conductivity level values. The percentage of tracer recovered reach at least 95%. The normalized exit distribution age function E(θ), with θ = t/τ, is plotted on figure 6.
Figure 6: Normalized RTD function.
As it can be seen, the 3 normalised RTD are perfectly superimposed. Values of the mean residence time and averaged velocity in the dryer are listed in Table 4 for each drying experiments.
For the three experiments, around 85% of the tracer leaves before θ=1. This suggests that the total volume of the dryer is not active and that short circuiting occurs. Indeed an averaged velocity (Eq.5-7) of the tracer of 0.28m.h-1 was obtained with <ts> versus 0.38 m. h-1 with τ which means that the tracer flowed faster than in theory.
Table 4. Characteristics of the RTD.
Experiment 1 Experiment 2 Experiment 3 Averaged
mNacl injected (g) 90 90 90 mNaCl recovered (g) 87.5 85.5 87.1 Mretained (g) 3100 3330 3500 (g.h-1) 890 895 1003 τ (min) 210 223 209 214 ± 8 <ts> (min) 155 163 154 157 ± 5 (m.h-1) 0.39 0.37 0.39 0.38 ± 0.01 (m.h-1) 0.29 0.27 0.27 0.28 ± 0.01
The standard deviation of the mean residence time is 5 min, thus establishing the acceptable reproducibility of the results.
0 2 4 6 8 10 12 0 2 4 6 8 10 C onduct iv it y λ (m S/cm ) time (hr) Experiment 1 Experiment 2 Experiment 3 0% 20% 40% 60% 80% 100% 0 5 10 R e cov e re d tr acer time (hr) Experiment 1 Experiment 2 Experiment 3 0.0 0.2 0.4 0.6 0.8 1.0 1.2 1.4 1.6 0.0 0.5 1.0 1.5 2.0 2.5 3.0 E(θ) θ Experiment 1 Experiment 2 Experiment 3 Averaged <ts> (b) (a)
CONCLUSION
In this paper, a method to characterize the residence time distribution of sewage sludge in a contact dryer with agitation has been developed. NaCl tracer allows a simple and accurate method for the determination of RTD curves. The calibration curve has been established and the error in the concentration quantified. Reproducibility of drying experiments have been characterised and RTD experiments performed. Even if the steady state is difficult to reach, RTD characteristics (Mean residence time and averaged dryer velocity) are reproducible. In a future work, response surface methodology will used to evaluate and the impact of the main processing parameter (stirring speed, angle of inclination, mass flow rate...) on drying and RTD characteristics.
REFERENCES
1. Arlabosse P, Ferrasse J-H, Lecomte D, Crine M, Dumont Y, Léonard A: Efficient Sludge Thermal Processing: From Drying to Thermal Valorization. In Modern Drying Technology. Wiley-VCH Weiheim; 2012:295-329.
2. Mizonov V, Berthiaux H, Arlabosse P, Djerroud D: Application of the theory of Markov chains to model heat and mass transfer between stochastically moving particulate and gas flows. Granular Matter 2008, 10(4):335-340.
3. Djerroud D: Modélisation markovienne du séchage continu par contact avec agitation. Institut National Polytechnique de Toulouse 2010.
4. Tsotsas E, Schlûnder EU: Contact drying of mechanically agitated particulate material in the presence of inert gas. Chemical Engineering and Processing: Process Intensification 1986, 20(5):277-285.
5. Arlabosse P, Chitu T: Identification of the Limiting Mechanism in Contact Drying of Agitated Sewage Sludge. Drying Technology 2007, 25(4):557-567.
6. Deng W-Y, Yan J-H, Li X-D, Wang F, Lu S-Y, Chi Y, Cen K-F: Measurement and simulation of the contact drying of sewage sludge in a Nara-type paddle dryer. Chemical Engineering
Science 2009, 64(24):5117-5124.
7. Yan J-H, Deng W-Y, Li X-D, Wang F, Chi Y, Lu S-Y, Cen K-F: Experimental and Theoretical Study of Agitated Contact Drying of Sewage Sludge under Partial Vacuum Conditions. Drying Technology 2009, 27(6):787-796.
8. Daud WRBW, Armstrong WD: Residence time distribution of the drum dryer. Chemical
Engineering Science 1988, 43(9):2399-2405.
9. Gopala Krishna GVT, Kumar P, Kumar P: Treatment of low-strength soluble wastewater using an anaerobic baffled reactor (ABR). Journal of Environmental Management 2009, 90(1):166-176.
10. Martînez-Delgadillo SA, Mollinedo-Ponce H, Mendoza-Escamilla V, Barrera-Dîaz C: Residence time distribution and back-mixing in a tubular electrochemical reactor operated with different inlet flow velocities, to remove Cr(VI) from wastewater. Chemical Engineering
Journal 2010, 165(3):776-783.
11. Rajakumar R, Meenambal T, Saravanan PM, Ananthanarayanan P: Treatment of poultry slaughterhouse wastewater in hybrid upflow anaerobic sludge blanket reactor packed with pleated poly vinyl chloride rings. Bioresource Technology 2011, 103(1):116-122.
12. Le Moullec Y, Potier O, Gentric C, Pierre Leclerc J: Flow field and residence time distribution simulation of a cross-flow gas “liquid wastewater treatment reactor using CFD. Chemical
Engineering Science 2008, 63(9):2436-2449.
13. Burrows LJ, Stokes AJ, West JR, Forster CF, Martin AD: Evaluation of different analytical methods for tracer studies in aeration lanes of activated sludge plants. Water Research 1999, 33(2):367-374.
14. Batstone DJ, Keller J, Newell RB, Newland M: Modelling anaerobic degradation of complex wastewater. II: parameter estimation and validation using slaughterhouse effluent. Bioresource
15. Môndez-Romero DC, Lôpez-Lôpez A, Vallejo-Rodrîguez R, Leôn-Becerril E: Hydrodynamic and kinetic assessment of an anaerobic fixed-bed reactor for slaughterhouse wastewater treatment. Chemical Engineering and Processing: Process Intensification 2011, 50(3):273-280.
16. Behin J, Bahrami S: Modeling an industrial dissolved air flotation tank used for separating oil from wastewater. Chemical Engineering and Processing: Process Intensification 2012, 59(0):1-8.
17. Charlou C, Sauceau M, Arlabosse P: Influence of premixing on the rheological properties and drying characteristics of municipal sewage sludge In 15th European Biosolids and Organic Resources Conference 2012; Leeds; 2012.
18. Ferrasse J-H: Développement d'outils expérimentaux pour le dimensionnement de procédés de séchage conductif avec agitation:Application à des boues de station d'épuration urbaines. Université de Paul Sabatier de Toulouse II; 2000.