Pépite | Recyclage des eaux grises : Etude de nouvelles filières de traitement
170
0
0
Texte intégral
(2) Thèse de Bouchra Halwani, Université de Lille, 2018. II © 2018 Tous droits réservés.. lilliad.univ-lille.fr.
(3) Thèse de Bouchra Halwani, Université de Lille, 2018. Dedication. Facing a window in a residence in Lille 1 campus on a vacation. You began dreaming of what your future will be. Today, I wanted to dedicate this thesis for you. Because no one deserve it but you. You stood up, alone, with no one’s help. You never gave up on your self. To my little me, I say, you first dream came true. And to myself I say! Baby keep on dreaming. III © 2018 Tous droits réservés.. lilliad.univ-lille.fr.
(4) Thèse de Bouchra Halwani, Université de Lille, 2018. Acknowledgments First and foremost, praises and thanks to the God, the Almighty, for His showers of blessings throughout my research work to complete the research successfully. I am pleased to extend my sincere gratitude to all those who have brought me from near and far, helped and advice in developing this doctoral thesis. I would like to thank in particular the University of Lille for hosting me these 3 years to accomplish my thesis as well as the Lebanese University and Azm and Saade association for funding my works. Without forgetting the director of the LASIR laboratory Dr. Hervé VEZIN and the director of LSSE laboratory Dr. Jalal HALWANI, for giving me the access to the laboratory and research facilities. I would like to express my deep and sincere gratitude to my research supervisor, Pr. Baghdad OUDDANE and Pr. Jalal HALWANI, who provided the direction of my thesis, with a lot of availability. Their dynamism, vision, sincerity and motivation have deeply inspired me. They have taught me the methodology to carry out the research and to present the research works as clearly as possible. It was a great privilege and honor to work under their guidance. The complementarity of their skills and their requirement as well as their human qualities have brought me a lot. I am also indebted to Dr. Sopheak Net, who has always been concerned to offer me the best possible working conditions. I thank her in particular for her great availability, her great scientific qualities and the trust she has placed in me. I would like to thank all the members of the jury committee: Dr. Marc ELSKENS and Dr. Moutasem FADEL who have accepted to judge this work and to be reporter of my thesis and Dr. Fawaz El OMAR, Dr. Abdul halim MOUNEIMNE and Dr. Sopheak NET-DAVID who agreed to review my project and to be part of this jury. I would like to thank my 2 friends aboard Chaza Chbib and Rayane Sahmarani, who accompanied me during these tough years, who shared my stress, my difficult moments and my moments of joy. I thank them for their advice and support. They were always here to listen to me nagging when things gone wrong. They were always here to motivate me, encourage me through my career. We dreamt of changing the word together and inchala we will. I also would like to thank Mrs. Catherine Ouddane, she was always by my side, and she gave me all the love that a mother can give to her daughter. She was always there to hear me and give me advices and correct my grammar. I thank her for all the good times we had together.. IV © 2018 Tous droits réservés.. lilliad.univ-lille.fr.
(5) Thèse de Bouchra Halwani, Université de Lille, 2018. As for my family in Lebanon, were do I have to start. First I would like to thank the doctoral school and especially the director Dr. Mhamad Kahlil who was always there to make sure we were on the right path. I don’t want to forget of course Mrs. Jana Al Hajj, who was always here to guide us and help us in our papers and if anything went wrong. I would like to thank my CNF family, especially Dr. Imad Al Kasaa, for supporting our craziness, Yumna Sayour for being the best friend that you can ever wish for, Rayan Nasser to have the purest heart that any gang should have, Rami Khoder for encouraging me always and having always my back, Kheder Makawi for being simply his crazy brave self, Salma Khaled for making me laugh and eating with me cheese sticks and mushrooms and Souhayb Al Kass for always walking beside me even when I am walking alone. I would like to thank my parents in laws to always encouraging me to pursuit my dream in having my PhD certificate. For my soul mate, there are no words that can describe my gratitude, you were always my support in these years and even before. To my fiancé, my future husband, thank you for being always by my side. To my family, to my sister, to my other half, my twin, we chose to walk this path together and together we are almost there. I am ready to begin with you crossing our bucket list to achieve our dreams together and always side by side. To my brother and his wife, I would like to thank you for supporting me. To my mommy, my weakness, my rock, my support, you were the only one who really had faith in me. You didn’t gave up on me, you stayed up all night with me since I was at school to finish my homework, you suffered with me, I know, and I am sorry for all the nights that you missed because of me. But mommy, I finished and now I am thanking you for being supportive in every chose I took in my life. I love you. To my dadi, I think, I thank you the most in this acknowledgment but this is because you are everywhere, my gradient angel, my professor, my mentor, my idol my everything. When I was a little girl I always wanted to be like you and today I stepped a little bit in your world. To my cousin, Fatima thank you for always listening to me and being my stress ball.. V © 2018 Tous droits réservés.. lilliad.univ-lille.fr.
(6) Thèse de Bouchra Halwani, Université de Lille, 2018. Abstract We can’t deny that our world is suffering from a major water crisis, with climate change, everything is changing. Countries must take actions toward alleviating stress on water resource and start realizing the importance of a resource that be easily recycled but instead is thrown in vain. Greywater constitutes 61% of the total wastewater stream that includes bathroom waters, kitchen water and washing machines. When treated, this source can be easily reused in wide options excluding potable uses. Our thesis explores the opportunities to treat greywater and will try to choose the most efficient yet cheap treatment systems. First we did an overall view of different types of treatment systems, then we chose which systems can deliver both efficiency and feasibility for a certain type of greywater (low load greywater). After selecting two types of treatment systems, we wanted to merge both of them into one system that will enhance the treatment efficiency. These two system rely tightly on adsorption that is why we wanted to identify which adsorbent can offer the best percentage of pollutants elimination but still fit in the low budget of low income countries. Different type of adsorbent were tested: bricks residus, bricks risidus activated with HCl, brick activated with a deposit of FeOOH, activated carbon and different granulometry of sand. Chemical oxygen demand, turbidity and the percentage of elimination of active agents were used to judge their effectiveness. After selecting fine sand and coarse sand we jumped into the phytoremediation concept and wanted to test different type of plants. Lavender was then selected to be part of our system. Chemical oxygen demand and turbidity were used to judge whether or not our system could deliver good results. After running these two tests, our pilot showed great results and recovered great amount of water that could be then used in different reuse options like toilet flushing or irrigation. Because user’s opinion and social acceptance is a threat to any new treatment system, we visited some of the nearest hotels and resorts to see their willingness to engage in such treatment path. In addition, cost is always a major throwback to any new treatment system, therefore, cost benefit analysis was used to ensure the feasibility of our pilot. Keywords: Chemical oxygen demand, greywater, pilot, reuse, turbidity, treatment systems.. VI © 2018 Tous droits réservés.. lilliad.univ-lille.fr.
(7) Thèse de Bouchra Halwani, Université de Lille, 2018. Résume Nous ne pouvons pas nier que notre monde souffre actuellement d'une crise majeure de l'eau en particulier avec le changement climatique, tout change. Les pays doivent prendre des mesures pour réduire le stress sur la ressource en eau. Le recyclage constitue une bonne option pour une majeure partie des eaux usées qui est rejetée en vain. L'eau grise constitue 61% du flux total des eaux usées, elle provient essentiellement de l’usage en salle de bain, en cuisine et machines à laver. Une fois traitée, cette source peut être facilement réutilisée dans de larges options, à l'exclusion de l’utilisation comme eau potable. Notre travail de recherche explore les possibilités de traitement des eaux grises et de choisir les techniques de traitement les plus efficaces et les moins coûteuses. D'abord, nous avons identifié des différents types de systèmes de traitement, puis nous avons choisi les systèmes qui peuvent fournir à la fois de l'efficacité et la faisabilité pour un certain type d'eaux grises (eaux grises à faible charge). Après avoir sélectionné deux types de systèmes de traitement, nous avons voulu les fusionner en un seul système qui améliorera l'efficacité du traitement. Ces deux systèmes s'appuient fortement sur les procédés d'adsorption, c'est pourquoi nous avons voulu identifier quel adsorbant peut offrir le meilleur pourcentage d'élimination des polluants à faible coût et adapté au budget des pays à faible revenu. Différents types d'adsorbants ont été testés : résidus de briques, briques activées avec l’acide chlorhydrique (HCl, 6M), résidus de briques activées avec un dépôt de ferrihydrite (FeOOH), du charbon actif et différentes granulométries de sable. La demande chimique en oxygène, la turbidité et le pourcentage d'élimination des agents actifs ont été utilisés pour juger leur efficacité. Après avoir sélectionné le sable fin et le sable grossier, nous voulons se concentrer sur le concept de phytoremédiation et tester différents types de plantes. La Lavande a été sélectionnée pour les expérimentations avec notre système. Deux paramètres ont été suivis, la demande chimique en oxygène et la turbidité, pour juger l’efficacité de notre système. Les résultats obtenus montrent que le pilote est opérationnel et permet de récupérer une grande quantité d'eau qui pourrait être réutilisée dans les toilettes ou l'irrigation. La dimension sociétale est un élément très important dans le succès de tout nouveau système de traitement destiné à une large utilisation par la population ou la collectivité. En fonction de l'opinion choisie, des enquêtes d’utilisateurs sont indispensables pour examiner l’intérêt suscité et l'acceptation de tout nouveau système de traitement. Dans ce but, nous avons réalisé un questionnaire qui a été utilisé lors de certaines visites d’hôtels pour percevoir la volonté d’engagement dans une telle voie de traitement. En outre, le coût est toujours le retour majeur des résultats des enquêtes, par conséquent, l'analyse coûts-avantages a été utilisée pour assurer la faisabilité de notre pilote. VII © 2018 Tous droits réservés.. lilliad.univ-lille.fr.
(8) Thèse de Bouchra Halwani, Université de Lille, 2018. Mots-clés: Demande chimique en oxygène, eaux grises, pilote, réutilisation, systèmes de traitement, turbidité.. ملخص ال يمكننا أن ننكر أن عالمنا يعاني من أزمة مياه كبيرة ،مع تغير المناخ ،كل شيء يتغير .يجب على الدول اتخاذ إجراءات لتخفيف الضغط على مياه الشرب والبدء في إدراك أهمية المورد الذي يمكن إعادة تدويره بسهولة ولكن بدالً من ذلك يتم طرحه بال جدوى .تشكل المياه الرمادية ٪61من مجمل مياه الصرف الصحي التي تشمل مياه الحمام ،مياه المطبخ والغساالت .عند المعالجة ،يمكن إعادة استخدام هذا المصدر بسهولة في خيارات واسعة باستثناء االستخدامات الصالحة للشرب .هذه األطروحة يتكشف الفرص لمعالجة المياه الرمادية وسيحاول اختيار تقنيات العالج األكثر كفاءة. أوالً ،قمنا بتغطية شاملة ألنواع مختلفة من أنظمة المعالجة ،ثم اخترنا األنظمة التي يمكن أن توفر كفاءة لنوع معين من المياه الرمادية (المياه الرمادية منخفضة الحمولة) .بعد اختيار نوعين من أنظمة المعالجة ،أردنا دمج كليهما في نظام واحد سيعزز كفاءة المعالجة .هذان النظامان يعتمدان بإحكام على االمتزاز ،لذلك أردنا تحديد أي الممتزات يمكن أن تقدم أفضل نسبة من القضاء على الملوثات وفي الوقت عينه تراعي الميزانية المنخفضة للبلدان منخفضة الدخل .تم اختبار نوع مختلف من الممتز ؛ من الطوب الطبيعي إلى الطوب المنشط مع حمض الهيدروكلوريك ،إلى الكربون المنشط ومختلف أحجام من حبيبات الرمل .تم استخدام الطلب على األكسجين الكيميائي ،التعكر ونسبة التخلص من العوامل النشطة للحكم على فعاليتهم. بعد اختيار الرمال الناعمة والرمل الخشن إنتقلنا إلى مفهوم المعالجة النباتية وأردنا اختبار أنواع مختلفة من النباتات .ثم تم اختيار الخزامى لتكون جزءا من نظامنا .تم استخدام الطلب على األكسجين الكيميائي والتعكر للحكم على ما إذا كان نظامنا يمكن أن يحقق نتائج جيدة أم ال .بعد إجراء هذين االختبارين ،أظهر النظام نتائج رائعة واستعاد كمية كبيرة من المياه التي نظرا ألن رأي المستخدمين والقبول يمكن إعادة استخدامها بعد ذلك في خيارات مختلفة مثل تنظيف المرحاض أو الريً . االجتماعي يشكالن تهديدًا ألي نظام جديد للعالج ،فقد زرنا بعضًا من الفنادق والمنتجعات لمعرفة استعدادها للمشاركة في مسار العالج هذا .أيضا ،التكلفة هي دائما االرتداد الكبير ألي نظام عالج جديد ،وبالتالي ،تم استخدام تحليل التكلفة و المنفعة لضمان قبول المستخدم.. الكلمات المفتاحية :التعكر ,الطلب األكسجين الكيميائي ,المياه الرمادية ,أنظمة المعالجة ,إعادة االستخدام.. VIII. lilliad.univ-lille.fr. © 2018 Tous droits réservés..
(9) Thèse de Bouchra Halwani, Université de Lille, 2018. Contents Dedication .............................................................................................................................................. III Acknowledgments .................................................................................................................................. IV Abstract .................................................................................................................................................. VI Résume .................................................................................................................................................. VII ملخص..................................................................................................................................................... VIII List of figures ......................................................................................................................................... XI List of tables .......................................................................................................................................... XII List of acronyms ................................................................................................................................... XIII General Introduction................................................................................................................................ 1 1.1.. Background ............................................................................................................................. 2. 1.2.. Aim and Objectives of this study ............................................................................................ 4. 1.3.. Outline of the thesis ................................................................................................................. 4. 1.4.. References ............................................................................................................................... 5. Chapter 1 – Literature review .................................................................................................................. 6 1.1. Introduction .................................................................................................................................. 7 1.2. Greywater Composition ............................................................................................................... 8 1.3. Greywater Characteristics ............................................................................................................ 9 1.3.1. Physical and Chemical greywater characteristics .................................................................. 9 1.3.2. Microbial Characteristics..................................................................................................... 15 1.4. The most popular systems used in treating greywater (Published in Desalination and Water treatment (DESWATER) journal) ..................................................................................................... 18 1.4.1. Abstract ............................................................................................................................... 18 1.4.2. Introduction ......................................................................................................................... 18 1.4.3. Treatment systems ............................................................................................................... 21 1.4.4. Discussion ........................................................................................................................... 35 1.4.5. Conclusion ........................................................................................................................... 36 1.4.6. References ........................................................................................................................... 36 1.5. Greywater guideline and reuse possibilities ............................................................................... 44 1.5.1. Reuse advantages................................................................................................................. 44 1.5.2. Reuse possibilities ............................................................................................................... 44 1.5.3. Greywater guidelines ........................................................................................................... 46 1.6. Conclusion .................................................................................................................................. 47 1.7. Reference .................................................................................................................................... 48 Chapter 2 – Adsorption and adsorbents................................................................................................. 51 2.1. Adsorption .................................................................................................................................. 52. IX © 2018 Tous droits réservés.. lilliad.univ-lille.fr.
(10) Thèse de Bouchra Halwani, Université de Lille, 2018. 2.1.1. Adsorption types.................................................................................................................. 52 2.1.2. Factors affecting adsorption and adsorbent ......................................................................... 53 2.2. Adsorbent ................................................................................................................................... 55 2.3. Performance of 3 types of residual bricks in treating greywater pollutants ............................... 56 2.3.1. Introduction ......................................................................................................................... 56 2.3.2. Materials and methods ......................................................................................................... 57 2.3.3. Results ................................................................................................................................. 60 2.3.4. Conclusion ........................................................................................................................... 66 2.4. Ability of three different activated carbons to eliminate greywater pollutants .......................... 67 2.4.1. Introduction ......................................................................................................................... 67 2.4.2. Materials and methods ......................................................................................................... 69 2.4.3. Results ................................................................................................................................. 73 2.4.4. Conclusion ........................................................................................................................... 79 2.5.1. Introduction ......................................................................................................................... 82 2.5.2. Materials and methods ......................................................................................................... 82 2.5.3. Results ................................................................................................................................. 83 2.5.4. Combination of fine sand .................................................................................................... 89 2.5.5. Experimental design ............................................................................................................ 91 2.5.6. Conclusion ........................................................................................................................... 93 2.6. Conclusion .................................................................................................................................. 93 2.7. Reference .................................................................................................................................... 95 Chapter 3 – Pilot design and analysis .................................................................................................. 103 3.1. Introduction .............................................................................................................................. 104 3.2. Design of the pilot .................................................................................................................... 104 3.2.1. Dimensions of the pilot ..................................................................................................... 105 3.2.2. Plants choice ...................................................................................................................... 107 3.2.3. Plant testing ....................................................................................................................... 109 3.2.4. Sand used in the pilot ........................................................................................................ 113 3.2.5. Pilot water input ................................................................................................................ 119 3.2.6. Pilot testing ........................................................................................................................ 120 3.2.7. System requirements ......................................................................................................... 122 3.2.8. Reuse options .................................................................................................................... 127 3.3. Conclusion ................................................................................................................................ 127 Conclusion ........................................................................................................................................... 133 Appendix ............................................................................................................................................. 137. X © 2018 Tous droits réservés.. lilliad.univ-lille.fr.
(11) Thèse de Bouchra Halwani, Université de Lille, 2018. List of figures Figure 2. 1. Schematic representation of different types of pores ............................................ 54 Figure 2. 4. Brick activated with HCl and FeOOH (B+Fe) ..................................................... 58 Figure 2. 3. Brick activated with HCl (B-Fe) ........................................................................... 58 Figure 2. 2. Natural residual bricks (NB) ................................................................................. 58 Figure 2. 5. The percentage of elimination of COD for the 3 types of residual bricks ............ 61 Figure 2. 6. The percentage of elimination of turbidity for the 3 types of residual bricks..... 63 Figure 2. 7. The percentage of elimination of active agents for the 3 types of residual bricks .................................................................................................................................................. 65 Figure 2. 8. Norit RAW 0.8 Supra ........................................................................................... 70 Figure 2. 9. Norit ROX 0.8....................................................................................................... 71 Figure 2. 10. Norit C Gran .............................................................. Erreur ! Signet non défini. Figure 2. 11. Norit C Gran ....................................................................................................... 72 Figure 2. 12. The percentage of elimination of COD for the 3 types of activated carbon ....... 74 Figure 2. 13. The percentage of elimination of turbidity for the 3 types of activated carbon .. 76 Figure 2. 14. The percentage of elimination of active agent for the 3 types of activated carbon .................................................................................................................................................. 78 Figure 2. 16. Coarse sand ......................................................................................................... 82 Figure 2. 15. Gravel .................................................................................................................. 82 Figure 2. 19. Microsand ........................................................................................................... 82 Figure 2. 18. Fine sand ............................................................................................................. 82 Figure 2. 17. Medium sand....................................................................................................... 82 Figure 2. 20. The elimination percentage of COD for sand type ............................................. 84 Figure 2. 21. The elimination percentage of turbidity for different sand type ......................... 86 Figure 2. 22. The elimination percentage of active agent for different sand type ................... 88 Figure 2. 23. Effect of combining fine sand to activated carbon in the elimination of COD .. 89 Figure 2. 24. Effect of combining fine sand to activated carbon in the elimination of turbidity .................................................................................................................................................. 90 Figure 2. 25. Effect of combining fine sand to activated carbon in the elimination of active agents ........................................................................................................................................ 91 Figure 3. 1. The pilot constructed .......................................................................................... 106 Figure 3. 2. One of the chamber interior ................................................................................ 107 Figure 3. 3. Achillea millefolium ........................................................................................... 110 Figure 3. 4. Calendula officinalis ........................................................................................... 110 Figure 3. 5. Celosia argentea cristata ..................................................................................... 110 Figure 3. 6. Celosia argentea plumosa ................................................................................... 110 Figure 3. 7. Linum usitatissimum........................................................................................... 110 Figure 3. 8. Lavandula angustifolia vera ................................................................................ 110 Figure 3. 9. Plants growth after 17 days of sowing seeds ...................................................... 112 Figure 3. 10. Celosia argentea plumosa after transplanting to different pots with different mixtures .................................................................................................................................. 113 Figure 3. 11. The texture triangle of GEPPA ......................................................................... 115. XI © 2018 Tous droits réservés.. lilliad.univ-lille.fr.
(12) Thèse de Bouchra Halwani, Université de Lille, 2018. List of tables Chapter 1 Table 1. 1. Values for physical-chemical parameters and nutrients in greywater.................... 14 Table 1. 2. Indicator bacteria in different greywater types ...................................................... 17 Table 1. 3. Average percentage of physical chemical and biological elimination of low load greywater pollutants ................................................................................................................. 28 Table 1. 4. Average percentage of physical chemical and biological elimination of high lowed greywater pollutants ................................................................................................................. 34. Chapter 2 Table 2. 1. Characteristics of the 3 activated carbon used in the study.................................... 80 Table 2. 2. Experimental design variables ............................................................................... 92 Table 2. 3. Experimental design and the percentage of elimination of turbidity and COD ..... 92. Chapter 3 Table 3. 1 . Comparison between the plant growths between trays irrigated with tap water and synthetic greywater ................................................................................................................ 112 Table 3. 2 . Elimination percentage of COD in each chamber in our pilot ............................ 128 Table 3. 3. Elimination percentage of turbidity in each chamber in our pilot ....................... 129. XII © 2018 Tous droits réservés.. lilliad.univ-lille.fr.
(13) Thèse de Bouchra Halwani, Université de Lille, 2018. List of acronyms -. µm: Micrometer AM: Achillea millefolium B+Fe: Activated bricks with a deposit of FeOOH BAF: Biological Aerated Filter BC: Before Christ BET: Brunauer–Emmett–Teller B-Fe: Activated bricks but without a deposit of FeOOH BOD: Biological Oxygen Demand BSF: BioSand Filter CAR: Central African Republic CC: Celosia argentea cristata CIRIA: Construction Industry Research and Information Association CO: Calendula officinalis COD: Chemical Oxygen Demand CP: Celosia argentea plumose DOC: Dissolved Organic Carbon E.Coli: Escherichia Coli EC: Electrocoagulation GAC: Granular Activated Carbon GW: Greywater ISO: International Standards Organization LA: Lavendula angustifolia vera LU: Linum usitatissimum MENA: Middle East and North Africa MIEX: Magnetic Ion Exchange Resin N: nitrogen NB: Natural Bricks OM: Organic Matter P: Phosphorus PAC: Powdered Activated Carbon RSF: Rapid Sand Filter SBR: Sequencing Batch Reactor SSF: Slow Sand Filtration TDS: Total Dissolved Solids TOC: Total Organic Carbon Tot-N: Total Azote Tot-P: Total Phosphorus TSS: Total Suspended Solids UASB: Upflow Anaerobic Sludge Blanket UN: United Nations US: United States WHO: World Health Organization. XIII © 2018 Tous droits réservés.. lilliad.univ-lille.fr.
(14) Thèse de Bouchra Halwani, Université de Lille, 2018. General Introduction. 1 © 2018 Tous droits réservés.. lilliad.univ-lille.fr.
(15) Thèse de Bouchra Halwani, Université de Lille, 2018. 1.1.. Background. Everyone fears the depletion of oil resources, but these people do not realize that a much important issue can threat our future is happening: the depletion of underground water and freshwater resources. Water is the source of life, as we know it. Difficult to purify, expensive to transport and impossible to substitute; water is the vain of food production, energy generation, economic development, our daily rituals and life itself. This vital source has its limits of approximately 1.4 billion cubic kilometers but only 2.5% are considered as fresh water (Xercavins, 1999), which can be used for drinking, irrigation and for industrial uses. Population growth is a major factor in water availability. Our nation nowadays is around 7 billion and is expected to increase to reach about 9 billion in the year 2050 according to the UN (Dubois, 2011). This huge number will boost the demands for water sources that are already extreme in so many countries and will worsen through the years that come, due to global warming. With this growing population rate, the income per capita will also increase, which will raise the demands on water and food. This exponential growth is pressuring many cities that are trying to satisfy the needs for water in urban areas. Therefore, all this evolution, prosperity and population growth, mismanagement, the overconsumption and pollution of water leads to one thing: Water scarcity. With an increasing water demands and without any possibility for an increase in water supplies, water scarcity, is one of the most significant problems facing most parts of the world. Within 50 years, more than 40% of the world’s population will face water stress (WHO, 2006). It is estimated that 48 and 54 countries will be classified as water-scarce or water-stressed countries by 2025 and 2050 respectively. To protect these finite resources two approaches can be taken. The first is to increase water supplies and the second is to reduce potable water demands. The first option has different strategies. Countries can increase their water supplies by constructing dams, reservoirs or can desalinate seawater, upgrade water treatment and pipe systems and finally, they can improve in operational methods such as pressure reduction of flow restrictions (Hunt et al., 2008; Surendran & Wheatley, 1998). Unfortunately, these solutions will have extremely high direct and indirect costs or can threat the environment (construction of dams and desalination and seawater). The second approach will be by optimizing the existing water supply system (reducing leakage), by reducing the demand and losses by installing water-saving devices or changing public behavior, by water re-use and recycling or by looking for alternative 2 © 2018 Tous droits réservés.. lilliad.univ-lille.fr.
(16) Thèse de Bouchra Halwani, Université de Lille, 2018. sustainable local sources of water (rainwater harvesting and greywater recycling) (Hunt et al., 2008). In many countries, the reduction in water consumption alone is not enough as the water sources are already stressed even with sustainable water consumption. The mounting need of this limited resource has inspired creative technics for freshwater management. Usually, municipal wastewater is reused following different types of treatment at large-scale plants. This kind of reuse/recycling was quickly spread in both developing and developed countries. However, a new water management alternative has started to emerge in an effort to minimize the effects of water scarcity using low-cost solution: reuse of greywater. Greywater reuse is one strategy that can be considered useful to satisfy non-potable water needs. To summarize, population growth and economic prosperity coupled with climate change are triggering water scarcity. With water resources worsen every single day we have to take action to save our world and to sustain this vital source for our next generation. Thence, reusing and recycling blackwater is not the only solution; greywater can also be a part of overarching urban water management plan. Not only numerous pipes mix between blackwater and greywater, also some of us do not understand the difference between them. Simply and without any complexity, greywater combines water flowing from sources such as showers, washing machines, bathroom sinks, dishwashers and kitchen sinks. These sources together with toilet wastewater form what we call blackwater. Greywater represents approximatively 60 to 80% of household wastewater. This continually and consistently produced water can be considered a readily available and reliable source that can be easily reused. Unfortunately, most conductive pipes mix black and grey water together; otherwise, by excluding toilet water, greywater is less polluted (Almeida et al., 1999). By reusing/recycling this available source, freshwater demand can be reduced; consequently, we can rescue the water levels in countries from dropping, prices of rising and introduce the knowledge of conserving water in our communities. Generally, to reuse or recycle blackwater, well equipped wastewater plants are constructed and millions of dollars are spent on equipment’s and maintenance. For greywater, many studies and technologies were placed to remove pollutants, but if we want to implement this concept in every facility, we should take into consideration the ration of cost/efficiency. Although irrigation takes over 70% of freshwater consumption (FAO, 2008), plants maybe the solution for water treatments. With different studies done by using plants for the remediation, the term of phytoremediation began to grow in every part of the world.. 3 © 2018 Tous droits réservés.. lilliad.univ-lille.fr.
(17) Thèse de Bouchra Halwani, Université de Lille, 2018. 1.2.. Aim and Objectives of this study. This thesis aims to identify greywater treatment systems and highlight the most efficient and easiest method to implement it in different type of facilities. In addition, this work will investigate different types of plants and see their behavior towards greywater. The global objective is to provide a new efficient concept for greywater reuse. Toward this objective, a pilot study was conducted to try to eliminate the major pollutants of greywater with low cost equipment’s and maintenance.. 1.3.. Outline of the thesis. According to the following objectives, we will try to find a proper functioning small-scale, lowcost greywater reuse and disposal systems for urban areas. This is an important part in future waste management plans and a step along the path to alleviating scarce water problems. This thesis will begin with a general introduction about greywater characteristic and chemical, physical composition then will illustrates the most popular technics used for treating greywater, guidelines and finally reuse possibilities. In this chapter, a review was submitted and accepted in Desalination and Water Treatment (DESWATER) journal. Chapter 2 will cover the first technical content of our thesis. This chapter first goes through basic knowledge of adsorption and adsorbent characteristics then investigates the ability of different types of adsorbent (residual bricks, activated carbon and sand) to eliminate pollutants found in greywater. Two articles concerning residual bricks and activated carbon are intended for submission in Water treatment scientific journal. Chapter 4 explores the pilot that we have constructed and shows how we chose the dimensions, what plants we decide to use and base on what analysis must be followed. Plus in this chapter we studied different aspects of our pilot like social acceptance and financial approach. The Final chapter draws a conclusion with suggestions for further work and what were the limitations in our work.. 4 © 2018 Tous droits réservés.. lilliad.univ-lille.fr.
(18) Thèse de Bouchra Halwani, Université de Lille, 2018. 1.4.. References. Almeida, M., Butler, D., & Friedler, E. (1999). At-source domestic wastewater quality. Urban water, 1(1), 49-55. Dubois, O. (2011). The state of the world's land and water resources for food and agriculture: managing systems at risk: Earthscan. FAO. (2008). Food and agriculture organisation of the United Nations. Retrieved on, 15. Hunt, D. V., Lombardi, D. R., Rogers, C. D., & Jefferson, I. (2008). Application of sustainability indicators in decision-making processes for urban regeneration projects. Paper presented at the PROCEEDINGS-INSTITUTION OF CIVIL ENGINEERS ENGINEERING SUSTAINABILITY. Surendran, S., & Wheatley, A. (1998). Grey‐water reclamation for non‐potable re‐use. Water and Environment Journal, 12(6), 406-413. WHO. (2006). Guidelines for the safe use of wastewater, excreta and greywater (Vol. 1): World Health Organization. Xercavins, J. (1999). Carrying Capacity In East Sub-Saharan Africa: A multilevel integrated assessment and a sustainable development approach: Universitat Politècnica de Catalunya.. 5 © 2018 Tous droits réservés.. lilliad.univ-lille.fr.
(19) Thèse de Bouchra Halwani, Université de Lille, 2018. Chapter 1 – Literature review. 6 © 2018 Tous droits réservés.. lilliad.univ-lille.fr.
(20) Thèse de Bouchra Halwani, Université de Lille, 2018. 1.1. Introduction On August 1989, Santa Barbara was the first district in the United States that legalized greywater. As a response to a letter from the water district conservation office, Santa Barbara Board of supervisors approves residential use of greywater. As a result, greywater and blackwater were separated. Appendix 1, is a copy of the Title 24, Part 5, of the California Administrative Code “greywater systems for single family dwellings”, commonly called the California Greywater Standards. After two year, on spring 1991, the first edition of “Create an Oasis with Greywater” was published and in the same year, five other cities adopted the concept of greywater. In 1992 California was part of the State plumbing code making it legal to use greywater everywhere in California. As years went by, the concept of greywater was growing and spreading in every part of the world. This new resource seemed to be the answer to water scarcity, whereas countries were concerned for their huge water consumption. Australia followed the United States, and conducted studies that concluded later on that significant water savings could be made from the responsible reuse of greywater (Anda et al., 1997). In addition, Australia developed guidelines for greywater reuse “Australian Guidelines for Water Recycling: Managing Health and Environmental Risks” .Cyprus then initiated a program for households in order to reuse greywater for domestic landscaping and toilet flushing. Cyprus as well as Korea and Japan had incentive programs for installation of greywater systems (Soroczan, 2008). For example in Tokyo, greywater systems are obligatory for buildings with an area of over 30,000 square meters (Hanson, 1997). Studies were published from two agencies in the United Kingdom (Environment Agency (Agency, 2008) and CIRIA (Leggett et al., 2001)) concerning greywater treatment and reuse. Due to the high quality water available in Germany from rainwater collection, the use of greywater recycling systems has been limited. Several municipalities in Spain and Catalonia, have passed regulations to promote greywater reuse in buildings (Domènech & Saurí, 2010). As for Norway and Sweden greywater reuse systems were implemented in some student dormitories and apartment buildings (Jenssen, 2002).. Concerning the Middle East and North Africa (MENA) region, 5% of the world’s population inhabits this region with 1% of accessible water resources. The Gulf States has no surface water that can be taken into consideration and are relying principally on desalination or groundwater. 7 © 2018 Tous droits réservés.. lilliad.univ-lille.fr.
(21) Thèse de Bouchra Halwani, Université de Lille, 2018. Saudi Arabia conducted studies in order to improve public awareness and greywater reuse system (Al-Jasser, 2012). Kuwait reuses a significant portion of treated ordinary domestic wastewater but the reuse of greywater is not common yet (Abusam, 2008). The United Arab Emirates, and especially Abu Dhabi, rely on reusing treated wastewater but still not familiar with reusing greywater. Yemen is the least advanced country regarding reusing any wastewater or greywater because of its predominantly rural setting, limited sewer connection and wastewater treatment plants which do not meet national quality requirement. Jordan, has a scarce resources with no major rivers and minimal rainfall. Therefore, Jordan is considered as an Arab leader in greywater studies. Although Lebanon has numerous amount of rivers, but with climate change everything is in danger. Therefore, some projects were conducted in Lebanon to enhance the idea of greywater reuse (El-Hajj, 2010), but unfortunately, the reuse has no high priority in the governmental action plans. In order to use and experiment on greywater, we should understand its composition, physical, chemical and microbial characteristics, what are the most systems used in greywater treatment and what are the guidelines and reuse options.. 1.2. Greywater Composition. Depending on personal hygiene habits, socio-economic status, cultural practices and lifestyle of each resident, products and chemicals used at home for bathing and laundry, frequency of cleaning, cooking habits and length of showers all these factors affect the composition and quality of greywater. For example, longer showers contributes to diluted, lighter greywater. Or, water softeners, reduce the hardness of incoming municipal water. Each human produces slightly different greywater composition, because of varying amount of dead skin cells, dirt, body oils and fecal coliforms in their intestines that vary according to age (Nolde, 2000), (Rose et al., 1991). Greywater represents 50 to 80% of total water uses (Al-Jayyousi, 2003; Christova-Boal et al., 1996). Because this water source come from washing hands, body, clothes, hair and other; greywater contains often high concentrations of oils, residues from soap, detergents, cleaning agents and low content of metals or organic pollutants depending on usage of substances like paints and other solvents (Ridderstolpe, 2004).. 8 © 2018 Tous droits réservés.. lilliad.univ-lille.fr.
(22) Thèse de Bouchra Halwani, Université de Lille, 2018. Greywater have different origins, therefore, each type has its own composition and characteristics. Water generating from bathrooms (hand washing and bathing) constitutes 5060% of greywater. It contains, soap, shampoo, hair dye, toothpaste and cleaning products; therefore, it is considered as the least contaminated type of greywater. Micro-organisms could also have their origin from urine and feces washed away during bathing and washing of hands and diapers. Kitchen greywater contributes 10% of the total greywater volume. Seriously polluted with food particles, oils, fats, other wastes, detergents and cleaning agents; this type is not suited for reuse in all greywater treatment systems. In addition, usually the temperature of kitchen greywater is higher than other types. The large amounts of organic matter present in kitchen greywater promotes the growth of microorganisms. The third type originates from washing machines, generates 25-35% and contain large amount of soap and detergent. The quality of this type of greywater varies from wash to wash, and can contain harmful substances such as paint, solvents, pesticides and herbicide due to clothes residues.. 1.3. Greywater Characteristics In the purpose of treating greywater, we should have more knowledge of the characteristics of raw water entering any treatment system. The acquaintance of chemical, physical and microbial characteristics will be our reference in the next several chapters to identify whether or not this system is efficient. We should note that the characteristics of greywater highly depend on the volumes produced. High strength greywater are produced, when little water are used and vice versa, when high water is consumed greywater becomes more diluted.. 1.3.1. Physical and Chemical greywater characteristics To monitor the efficiency of each system, chemical and physical characteristics of greywater should be known. Mostly, greywater is taken as any other regular water in testing and no further tests are imposed. As said earlier, most of the greywater, according to their type, can contain soap, shampoo, cleaning products and could contain some solvents; therefore we can find high chemical concentrations especially of sodium, phosphate, boron, surfactants, ammonia, chlorine and nitrogen as well as high suspended solids, turbidity and oxygen demand.. 9 © 2018 Tous droits réservés.. lilliad.univ-lille.fr.
(23) Thèse de Bouchra Halwani, Université de Lille, 2018. As basic water quality parameters, total suspended solids (TSS), biological oxygen demand (BOD), chemical oxygen demand (COD) and turbidity should be tested. Physical characteristics combine temperature, suspended solids. For the temperature of greywater, it is higher than water supply within 18 to 30oC, because of the use of warm water for personal hygiene and cooking water. This high temperature will enhance the growth of bacteria and decrease the solubility of CaCO3, which can produce precipitation in storage tanks and pipes. Suspended solids, foods, oils, hair, powdered detergents and soaps can cause turbidity in water, clogging of pipes, pumps and filters used. Containing a variety of solids and dissolved impurities, we test suspended solids to be able to quantify particles present in a certain water column. TSS can differ from study to study even though water is originates from the same type. For example, in greywater originated from bath, 76 mg/L of TSS has been determined in greywater of university residence (Surendran & Wheatley, 1998). While greywater of residential housing in urban area collected from 28 households, between 54 and 200 mg/L of TSS has been determined (Almeida et al., 1999). For turbidity, greywater contains much lower turbidity than sewage or potable water systems (Franklin, 1991). The pH indicated whether a liquid is acidic or basic or natural, because this indicator can affect soil and plants if reused water is used in irrigation. This indicator in greywater is dependent strongly on the pH of the original water supply. The pH of greywater range between 7 and 8 because of the alkalinity of soaps and detergents (Jefferson et al., 2004). As said earlier greywater contains salts (sodium, calcium, chlorine etc.), in this purpose electrical conductivity is measured to know salinity of this resource. The salinity of greywater is normally not problematic, but can become a hazard if used for irrigation since it could reduce yield potential. With the revolution in agricultural studies to overcome this problem, we could choose salt-tolerant plants. According to, (Surendran & Wheatley, 1998) and (Jefferson et al., 2004), greywater have low concentrations of nitrogen, phosphorus and potassium that rarely exceed 5 mg/L, because urine are excluded from greywater the only origine for these 2 componunt are products used. And to prove our saying that each greywater differs with used products and practices, residences that uses phosphate-free detergent will have low phosphate than other households. The phosphate-free detergents are important regarding the problems that they can indure such as the algae growth in receiving water; but, nitrogen and phosphorus are important for the plant growth also. In countries where phosphorous-containing detergents is not banned yet, the main sources for these compounds are the dishwasher and laundry detergents and could be found with a concentration ranging from 4 to 14 mg/L (Eriksson et al., 10 © 2018 Tous droits réservés.. lilliad.univ-lille.fr.
(24) Thèse de Bouchra Halwani, Université de Lille, 2018. 2007). A deficiency in nitrogen and phosphorus can be noted because these 2 compounds are excreted into toilet bowl, which is not included in greywater and this can be illustrated in the ratio of COD:N:P in previous studies. Between 100:20:1 of COD:N:P in (Franklin, 1991), 250:7:1 (Franta et al., 1994) and 100:10:1 (Beardsley & Coffey, 1985) these 3 studies prove that greywater has a significant lower concentration of inorganic nutrients. According to (Jefferson et al., 2000) this deficiency could limit biological treatment.. BOD refers to the amount of oxygen that would be consumed if all the organics in one liter of water were oxidized by bacteria and protozoa. Usually by using bacteria within a certain time span (5 days normally) BOD could be measured. In addition BOD can differ from study to study and type to type of greywater. For example, in greywater obtained from university residence, water coming from baths had 216 mg/L, hand washing 252 mg/L, kitchen sink 536 mg/L and washing machines had 472 mg/L of BOD (Surendran & Wheatley 1998). And COD refers to the measure the total quantity of oxygen required to oxidize all organic material into carbon dioxide and water. COD of greywater varied strongly depend on the type of source. For example, greywater from baths, hand wash, kitchen sink, washing machines and dishwashers contain 645, 95-386, 1340, 1339 and 1296 mg/L of COD respectively (Friedler, 2004). The Table 1.1 is a compilation of the value of principal parameters of greywater obtained from various studies. COD and BOD in greywater are higher than domestic sewage because of the poorly biodegradable materials such as soap and greases (Sayers, 1998). Discharging high BOD and COD into surface water can cause oxygen depletion, which later can affect the aquatic life. Although, greywater may be contaminated by chemical and physical pollutants, risks are minimal as those pollutants are typically human hygiene products in low concentrations (Beveridge et al., 2007). The main components in any household cleaning products are: Surfactants. These surfaceactive agents, consist of a hydrophilic head and a hydrophobic tail and by lowering the surface tension of water, they allow the cleaning solution to wet a surface more rapidly. Of course, laundry and automatic dishwashing detergents are the main source of surfactants in greywater, also personal cleansing products and household cleaners can be considered as a source. Depending on the type and quantity of detergents used, the amount of surfactants present in greywater can vary. The concentration of these surfactants can range from 1 to 60 mg/L (Friedler, 2004). Surfactants can endure one problem, because detergents are a main source of 11 © 2018 Tous droits réservés.. lilliad.univ-lille.fr.
(25) Thèse de Bouchra Halwani, Université de Lille, 2018. boron in greywater and although this compound is essential for plants but an excessive amounts become toxic.. 12 © 2018 Tous droits réservés.. lilliad.univ-lille.fr.
(26) Thèse de Bouchra Halwani, Université de Lille, 2018. PARAMETERS. HAND WASH. KITCHEN SINK. WASHING MACHINE. WC. BATH. 60-240(1). 92(2) 28-96(3) 49-69(4). 102(2). TOTAL SOLIDS (mg/L). 631(2) 777-1090(5) 250(6). 558(2) 835(5). 1272-2410(5) 2410(6). 350-2091(5) 410-1340(6). 45-2810(5) 1500(6). TOTAL VOLATILE SOLIDS (mg/L). 318(2) 533(5) 190(6). 240(2) 316(5). 661-720(5) 1710(6). 330(2) 125-765(5) 180-520(6). 30-1045(5) 870(6). 7.6(2) 6.7-7.4(4,5). 8.1(2) 7.0-8.1(5). 6.5(5) 6.3-7.4(8). 8.1(2) 7.5-10.0(5). 9.3-10.0(1). 645(5) 210-501(7) 100-633(9). 95-386(5) 298(7). 644-1340(5) 1079(7). 725(2) 1339(5) 1815(7). 1296(5). TURBIDITY (NTU). pH. CHEMICAL OXYGEN DEMAND (mg/L). 6.4-8.1 (1) 7.1(5). 210-230(5). DISHWASHER. 50-210(1) 108(2) 14-296(3). 13.
(27) Thèse de Bouchra Halwani, Université de Lille, 2018. BIOCHEMICAL OXYGEN DEMAND (mg/L). 216 170(6) 424(5). 252(2) 33-236(5). 536 530-1450(5) 1460(6). 48-290(1) 472(2) 280-470(5) 150-380(6) 282(10). 40(2) 119(5). 582(5) 880(6). 381(5) 100-280(6). 234(5) 600(6). 15.4-42.5(8). 1-40(1) 6-21(6). 40(6). 0.06-42(1). 68(6). (2). (5). 173. TOTAL ORGANIC CARBON (mg/L). 91(5). 104(2) 30-120(5) 100(6). TOTAL NITROGEN. 4.6(1). 5-10(9). TOTAL PHOSPHORUS. 0.11-1.8(1). 2.0(6). (2). 390-699(5). Table 1. 1. Values for physical-chemical parameters and nutrients in greywater (1) Christova-Boal et al. (1996); (2) Surendran& Wheatley (1998); (3) Rose et al. (1991); (4) Burrows et al. (1991); (5) Friedler (2004); (6) Siegrist et al. (1976); (7) Almeida et al. (1999); (8) Shin et al. (1998); (9) Nolde (1999).. 14.
(28) Thèse de Bouchra Halwani, Université de Lille, 2018. 1.3.2. Microbial Characteristics. Through inhalation, ingestion or simple contact with reused water anyone can be infected with a variety of bacterial, protozoan and viral pathogens. Although some will find that toilet flushing has no effect and can easily be reused even without treatment, Gerba et al., (1995) showed that it could produce aerosols (bacteria and viruses) that can settle and spread up to 83 cm from the toilet seat (Barker & Jones, 2005). Not only toilet flushing, all aerosol-producing activities such as car washing or spray irrigation could cause risk of infection by inhalation or typical contact of Pseudomonas aeruginosa (Evans et al., 2006), Staphylococcus aureus (Wertheim et al., 2005), Legionella pneumophilia (Atlas, 1999) and more. If we mistreated water used in these activities, consequences could range from respiratory tract infection to skin infections especially for elderly, very young and immunocompromised members of society. Greywater can be divided into two groups, light and dark greywater. Generally dark greywater is considered more polluted then light greywater from a chemical and microbial point of view because it includes kitchen water (Friedler, 2004). Dark greywater can cause more human illness if not treated correctly because of the high organic matter and high temperature present in these waters that favors the growth of microbes (Denis, 2007). When treating greywater, our aim is to eliminate all kind of pollution and none desirable compounds. Consequently, the chemical composition and microbes present in greywater that could affect the quality of our output should be determined. The primary concern for any user of a reused water is risks of pathogens especially fecal transmitted bacteria, viruses and protozoa. The concentration of organisms is affected the most by the source of greywater. Also family members especially small children and adults can affect the total and fecal coliforms found in greywater (Rose et al., 1991). Total coliforms in greywater can range from 1.7 log10.100mL-1 (Rose et al., 1991) up to 8.8 log10.100mL-1 (Gerba et al., 1995). Fecal coliforms, E.coli and Enterococci have a concentration of 4.2, 3.3 and 2.8 log10.100mL-1, respectively. Total coliforms group both fecal coliforms (example: Escherichia) and non-fecal coliforms (example: Enterobacter). This type of bacteria is rod-shaped, gram-negative can be found in soil, water and the digestive system of animals and humans. Some of these bacteria are pathogenic and can cause typhoid fever and cholera (Jefferson et al., 2004). Generally to be. 15 © 2018 Tous droits réservés.. lilliad.univ-lille.fr.
(29) Thèse de Bouchra Halwani, Université de Lille, 2018. able to test the microbial quality of water, we use indicator organisms to have a rapid test and in many cases we use coliform bacteria.. Fecal contamination of greywater is not an occasional occurrence. Fecal coliforms, E.coli and Enterococci are reported in several studies and enteric pathogens may be present. Enteric pathogens could be present throw washing of raw meat or vegetables which can also contain Campylobacter and Salmonella (Cogan et al., 1999), (Rose et al., 2001). E.coli can be found in large numbers in the intestine of humans and warm-blooded animals and can live longer than enteric pathogens therefore it is used also as an indicator of water quality. Fecal coliform is also used as an indicator because it indicates the presence of other pathogenic bacteria like Salmonella, Shigella and Vibrio (Cogan et al., 1999). The presence of such type can cause typhoid fever, hepatitis and gastroenteritis. A pathogen is defined as an organism which benefits from the suffering of another organism, and the most concerned pathogens include Cryptosporidium and Pseudomonas sp. (Craun et al., 2005).. P.aeruginosa and Staphylococcus aureus were found in 20 greywater samples from a single household. High number of Staphylococcus aureus ranging from 7.0 – 7.7 log10.100mL-1 have been found in shower greywater from military camp. P.aeruginosa and Staphylococcus aureus can be found in mouth, nose and throat of humans (Eriksson et al., 2007). Legionella pneumophilia is a bacteria that grow in high water temperature. Water originating from baths usually have high temperature, therefore it was important to discover whether or not there was any trace of Legionella pneumophilia in previous studies. Only one study focusing on greywater collected from a military camp has reported their present with the concentrations between 2.2 and 2.9 log10.100mL-1 (Birks et al., 2004). And the same study has reported the concentration of Cryptosporidium at 8.3 log10.100L-1.. Greywater storage can increase the concentration of pathogens, excluding Salmonella sp., Shigella sp., and Campylobacter sp.; therefore it is more likely to store these water until 24 maximum 48 hours (Rose et al., 2001). More details about each bacteria will be illustrated in Table 1.2.. 16 © 2018 Tous droits réservés.. lilliad.univ-lille.fr.
(30) Thèse de Bouchra Halwani, Université de Lille, 2018. GREYWATER SOURCE. TOTAL COLIFORMS. FECAL COLIFORMS. -1. -1. (LOG10.100 mL ). (LOG10.100 ML ). ESCHERICHIA COLI -1. (LOG10.100ML ). ENTEROCOCCI/ FECAL STREPTOCOCCI. REFERENCES. (LOG10.100 ML-1) Birks et al. (2004);. WASH BASIN. 4.7-5.8. 1.5-3.5. 3.8. >2.3. Friedler (2004) ; Surendran and Wheatley (1998). Rose et al. (1991); Nolde (2000); Friedler (2004) ; Jefferson et al. (2004). SHOWER. 3.0-5.0. 1.0-6.6. 2.8-3.2. 1.5-3.3. BATH. 1.7-4.4. 6.6. 1.9-4.3. 1.0-1.6. Dixon et al. (2000); Friedler (2004) ; Jefferson et al. (2004). 1.4-3.4. Rose et al. (1991);Christova-Boal et al. (1996); Surendran and Wheatley (1998); Dixon et al. (2000); Friedler (2004). LAUNDRY. 1.7-5.8. 1.4-6.6. No Data. Table 1. 2. Indicator bacteria in different greywater types. 17.
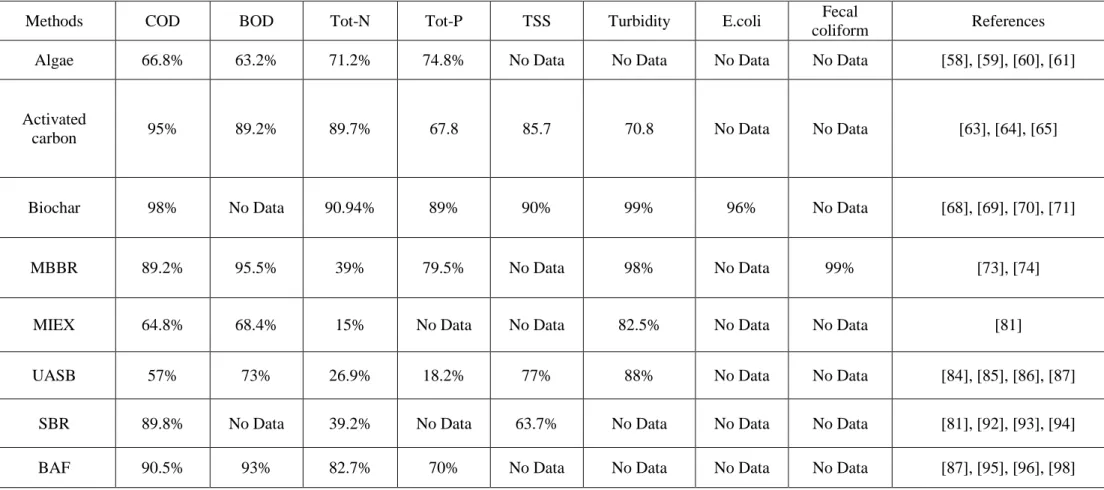
(31) Thèse de Bouchra Halwani, Université de Lille, 2018. 1.4. The most popular systems used in treating greywater (Published in Desalination and Water treatment (DESWATER) journal) 1.4.1. Abstract. With the scientific evidence of climate change is occurring, water conservation is extremely import, thus every drop of water counts, whereas 61% of the domestic wastewater stream a byproduct of households, municipal wastewater from communities (also called sewage system) and or industrial wastewater from industrial activities. Known as greywater, can be easily recycled but is discarded. Countries, municipalities, and communities realized the importance of graywater recycling and reuse. Studies and practices were started to remove and or eliminate major pollutants so that the recycled water can be used for irrigation, toilet flushing, and many other uses. The use of different types of filtration systems such as slow sand filtration, rapid sand filtration, slanted soil, and others common l systems techniques like sequencing batch reactor, upflow anaerobic sludge blanket reactor used in wetlands . This review aims to discuss the most efficient systems for the treatment of greywater, by comparing more than 20 systems for their biological, chemical and physical removal of pollutants. Keywords: constructed wetlands, filtration, greywater treatment, slanted soil and technics. 1.4.2. Introduction The reuse of wastewater is becoming more and more a necessity around the world, this is due to the growing concern over the shortage of available freshwater supply. Low amounts of rainfall, drought conditions, high evaporation, and large demands for freshwater, growing population, higher standards of living, and economic considerations. These issues are forcing countries to search for alternative solutions as a substitute to freshwater consumption and resources. Reusing and recycling greywater is receiving increasing attention as a key to overcome high urban water demand. Recycling Greywater (GW) studies has increased from 38 studies in 2008 to 110 studies in 2017, and continuing. GW is domestic wastewater excluding toilet waste and can be classified as either low-load GW (excluding water from kitchen) or high-load GW (including water from kitchen) and constitutes 61% of the total domestic wastewater stream[1]. Hence, we can conclude that this source have different origins: bathroom that constitutes 50 to 60% of greywater, kitchen greywater with 10% and washing machines with 25-35%. Greywater can be reused for toilet flushing, irrigation of lawns, athletic fields, 18 © 2018 Tous droits réservés.. lilliad.univ-lille.fr.
(32) Thèse de Bouchra Halwani, Université de Lille, 2018. cemeteries, parks, golf courses and domestic garden, washing of vehicles and windows, concrete production, and groundwater recharge [2]. Different studies were conducted to address challenges of different type of greywater, taken into considerations the personal hygiene habits, socio-economic status, cultural practices, the lifestyle of residents, the products and chemicals used at homes for bathing and laundry, the frequency of cleaning, cooking habits, and length of showers. All of these factors affect the quantity, composition, and the quality of greywater generated. This is critical to select the best appropriate treatment method of greywater when dealing with chemicals, solid, and microbial characteristics of greywater. High concentration of sodium, phosphate, boron, surfactants, ammonia, chlorine, nitrogen as well as high suspended solids and oxygen demand; originated from soap, shampoo and cleaning products could be found in greywater. Nitrogen and phosphorus concentration can change from user to user, because some countries ban the use of these two components in detergents and other do not. From study to study and from type to type; physical, chemical and microbial characteristics of greywater can vary. Factors effecting such variations of water sources are temperature from hand basin, kitchen sinks, and bathtubs. Other factors are, user’s age, microbial characteristics, human with of dead skin cells, dirt, body oils and fecal coliforms. In this review we will list and compare several popular methods that are used to treat greywater that’s can deliver high efficiency based on the input, the type of wastewater and the quality of greywater. Because of the numerous studies made in this subject, only studies that provide results for at least one chemical, physical or microbial parameters were mentioned.. 19 © 2018 Tous droits réservés.. lilliad.univ-lille.fr.
(33) Thèse de Bouchra Halwani, Université de Lille, 2018. 20.
(34) Thèse de Bouchra Halwani, Université de Lille, 2018. 1.4.3. Treatment systems. As discussed earlier, greywater is divided into 2 main categories, low load and high load, and it will be more suited to differ between treatment methods that can overcome each type. Below will discuss the most popular methods used for treating low greywater load, then high greywater load. 1.4.3.1. Low load greywater treatment systems. Slow sand filtration (SSF) is the most studied method, because it’s well suited for rural communities since it does not require a high degree of operator skill or attention. This technic that has been used for hundred years is simple to use, reduce protozoa, operate for up to 10 years and the materials are available [1]. But slow sand requires large surface, maintenance and is not effective on viruses. Plus the major problem that slow sand face is clogging and that it cannot be used on high turbid water. This filter consists of layer of sand supported on a layer of graded gravel [3].Previous studies [4,5,6,7] reported the efficiency of SSF in water treatment, in which the average of COD, BOD, DOC, Tot-N, turbidity, OM, TOC, E.coli, total coliform and fecal coliform removal. Zipf et al, (2016) [4], took the water in this study from lavatory sinks in a university campus and had 35.8 ± 45.1 NTU for turbidity, 7.7 pH, 56.0 ± 15.9 mg/L for BOD, 145.8 ± 79.1 for COD, 8.3 ± 3.5 mg/L of surfactants and1.8 x 105 ± 4.4 x 10⁵ NMP/100 mL of total coliforms. By using slow sand filtration, the average removal efficiency was 61%, 56%, 56% 70% and 61% for turbidity, BOD, COD, surfactants and total coliforms respectively. Li et al. (2010) [5] used landscape water to prove if slow sand filtration could eliminate pollutants. In this study, raw water had 3±11.4 NTU for turbidity, 22±50 mg/L for COD, 2.4±9.9 mg/L for BOD and 1.1±3.9 for total nitrogen (Tot-N). After 46 days of test, the average removal of turbidity, BOD, COD and Tot-N of 86%, 67%,34% and 59%. The third study [6] founded the typical removal efficiencies for slow sand filter when operating in Colombia. Raw water was monitored for over 2 years and then a mean of each parameter was calculated. The mean of turbidity was 64 NTU, fecal coliforms was 63.3 CFU/100ml,DOC had 18 mg/L. Working with a filtration rates between 0.04 and 0.2 m/h; the removal efficiency of turbidity, coliforms, DOC and BOD were 99%, 90 to 99%, 5 to 40%, 46 to 75% respectively. The forth study monitored [7] COD, turbidity and total bacterial counts for more than one year using slow sand filtration and had 43.9% removal of COD, 89.5% for turbidity and 73.5% for total bacterial count. One study done by Kader Yettefti et al, (2013)[8], reported higher 21.
Figure


+7


Documents relatifs
Peut faire un exposé simple et direct, préparé, sur un sujet familier dans son domaine, assez clair pour être suivi sans difficulté la plupart du temps et dans lequel les
Dr Parr is a rural family physician practising in Mount Brydges, Ont, and is an Assistant Professor in the Department of Family Medicine at the University of Western Ontario
That is why, for instance, the Rashad languages, spoken almost exclusively by muslim people, were less studied 6 than the Heiban languages, whose speakers were still largely
Web server on 54.246.205.67: Here is what you requested; if you really want to see the content in full, you should also load all these scripts and images on the same site, as well
Web server on 54.246.205.67: Here is what you requested; if you really want to see the content in full, you should also load all these scripts and images on the same site, as well
Type ‘‘ my first program ’’ (get into the habit of giving descriptive names to projects and other files) in the Target name box. Use the browse button to find the
In this paper we will explain why conceptualization plays an important role within argumentation and why argumentation support tools, especially if they use Natural
Task Five : Use the verbs in the shapes to write sentences about the pictures below : brush your teeth. brush
