O
pen
A
rchive
T
OULOUSE
A
rchive
O
uverte (
OATAO
)
OATAO is an open access repository that collects the work of Toulouse researchers andmakes it freely available over the web where possible.
This is an author-deposited version published in : http://oatao.univ-toulouse.fr/ Eprints ID : 5211
To link to this article : DOI : 10.1016/j.watres.2011.04.029 URL : http://dx.doi.org/10.1016/j.watres.2011.04.029
To cite this version :
Vialle, Claire and Sablayrolles, Caroline and Lovera, Maurin and Jacob, Séverine and Huau, Marie-Christine and Montrejaud-Vignoles, Mireille Monitoring of water quality from roof runoff: Interpretation using multivariate analysis. (2011) Water Research, vol. 45 (n° 12). pp. 3765-3775. ISSN 0043-1354
Monitoring of water quality from roof runoff: Interpretation
using multivariate analysis
C. Viallea,b,*, C. Sablayrollesa,b, M. Loverac, S. Jacobd, M.-C. Huaue, M. Montrejaud-Vignolesa,b
a
Université de Toulouse; INP; LCA (Laboratoire de Chimie Agro-Industrielle); ENSIACET, 4 Allées Emile Monso, F-31030 Toulouse, France
b
INRA; LCA (Laboratoire de Chimie Agro-Industrielle), F-31029 Toulouse, France
c
Veolia Water North America, Technical Direction Group, 101, W Washington Street, Suite 1440 East, IN-46204 Indianapolis, USA
d
Veolia Eau, Direction Technique, Immeuble Giovanni Battista B, 1, rue Giovanni Battista Pirelli, F-94410 Saint-Maurice, France
e
Veolia Eau, Direction des collectivités publiques, 36-38 avenue Kleber, F-75016 Paris, France
*Corresponding author. Postal adress : ENSIACET - LCA, 4 Allée Emile Monso, BP 44362, F-31030 Toulouse, France - Phone : 32-35-51 - Fax : +335-34-32-35-97
E-mail adress: claire.vialle@ensiacet.fr (Claire Vialle) Abstract
The quality of harvested rainwater used for toilet flushing in a private house in the south-west of France was assessed over a one-year period. Temperature, pH, conductivity, colour, turbidity, anions, cations, alkalinity, total hardness and total organic carbon were screened using standard analytical techniques. Total flora at 22°C and 36°C, total coliforms, Escherichia coli and enterococci were analysed. Overall, the collected rainwater had good physicochemical quality but did not meet the requirements for drinking water. The stored rainwater is characterised by low conductivity, hardness and alkalinity compared to mains water. Three widely used bacterial indicators - total coliforms, E. coli and enterococci - were detected in the majority of samples, indicating microbiological contamination of the water. To elucidate factors affecting the rainwater composition, principal component analysis and cluster analysis were applied to the complete data set of 50 observations. Chemical and microbiological parameters fluctuated during the course of the study, with the highest levels of microbiological contamination observed in roof runoffs collected during the summer. Escherichia coli and enterococci occurred simultaneously, and their presence was linked to precipitation. Runoff quality is also unpredictable because it is sensitive to the weather. Cluster analysis differentiated three clusters: ionic composition, parameters linked with the microbiological load and indicators of faecal contamination. In future surveys, parameters from these three groups will be simultaneously monitored to more accurately characterise roof collected rainwater.
Keywords: rainwater harvesting system, physicochemical quality, microbiological quality, principal component analysis, cluster analysis
1. Introduction
Currently, the availability of fresh water is one of the major issues facing the human population. A number of complex factors are driving this issue, including population growth, urbanisation, land use transformation, and pollution. Insufficient availability to drinking water could lead to devastating consequences, such as increasing health problems or social upheaval.
Although many solutions have been proposed, there is much interest in the use of roof-collected rainwater. This practice has been used in many countries for thousands of years ((Pinfold and al. (1993) ; Simmons and al. (2001)). Although this solution is attractive from an ecological point of view, it is necessary to measure the quality of harvested rainwater due to the potential for health risks as a result of chemical and microbiological contaminants. Recently, studies in numerous countries, including Thailand, USA, Nigeria, New-Zealand, India, Zambia, Brazil, Canada, Australia, Jordan, New Guinea and South Korea, have investigated the quality of harvested rainwater ((Pinfold and al. (1993) ; Crabtree and al. (1996) ; Uba and Aghogho (2000) ; Simmons and al. (2001) ; Handia and al. (2003) ; Kulshrestha and al. (2003) ; May and Prado (2006) ; Al-Khashman (2009) ; Despins and al. (2009) ; Evans and al. (2009) ; Horak and al. (2010) ; Lee and al. (2010)). In Europe, rainwater quality assessment was studied by Förster (1998), Förster (1999), Albrechtsen (2002), Polowska and al. (2002), Fewtrell and Kay (2007), Melidis and al. (2007), Oesterholt and al. (2007), Sazakli and al. (2007), Schriewer and al. (2008), Tsadovski and al. (2010). Although a number of studies have found collected rainwater to be non-potable, showing unacceptable levels of microbiological contamination and poor physicochemical qualities, “a clear consensus on the quality and health risk associated with roof-collected rain-water has not been reached” ((Evans and al. (2006)). This lack of consensus is likely due to the fact that the qualities of harvested and stored rainwater are dependent on a number of factors, including geographical location, catchment area, storage time, handling and management of the water ((Vazquez and al. (2003) ; Chang and al. (2004) ; Zhu and al. (2004) ; Evans and al. (2007) ; Huston and al. (2009) ; Lye (2009)).
Like most countries, France must spare its water resources and, for several years, has taken an interest in harvesting rainwater for domestic use. Despite reluctance from authorities (C.S.H.P.F, 2006), the increasing demand from private customers has prompted authorization of the use of rainwater for certain applications. Currently, French law prohibits the use of harvested rainwater for drinking, showering or bathing, or washing clothes (Decree of August 21, 2008).
In recent years, the application of multivariate analysis to complex data sets has enjoying a high level of scientific interest. One of the main advantages of these techniques, such as principal component analysis (PCA) and cluster analysis (CA), is the ability to analyse large datasets containing many variables and experimental units. PCA and CA identify groups and sets of variables with similar properties and may allow us to simplify our description of observations by finding the structure or patterns in chaotic or confusing datasets. Additionally, these techniques allow the analysis of data from non-homogeneous variables. Thus, multivariate methods are now used in a variety of scientific disciplines. In the field of rainwater, they have been applied to the study of precipitations composition mainly in ions and sometimes in metals (Zhang and al. (1992) ; Hu and al. (2003) ; Simeonov and al. (2003) ; Vazquez and al. (2003) ; Zunckel and al. (2003) ; Astel and al. (2004) ; Khare and al. (2004) ; Baez and al. (2007)) or to the study of rainwater monitoring network (Mantovan and al. (1995) ; Ouyang (2005)). By contrast, our study concerned the characterization of
stored roof-collected rainwater and the simultaneous analysis of chemical, physical and microbiological parameters.
The purpose of the present study is to monitor physicochemical and microbiological parameters of collected rainwater and to use PCA and CA to further characterise associations present in the complete data set. Rainwater was collected over a one-year period using a commercially available system installed in south-western France. 2. Material and methods
2.1. Sampling site
2.1.1. Rainwater harvesting system
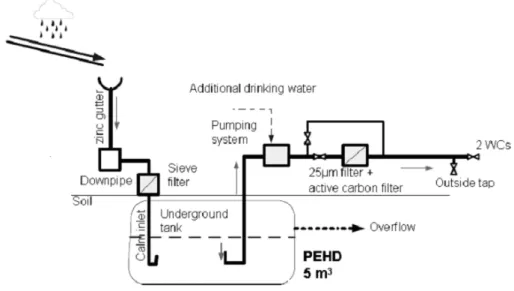
A commercially available domestic rainwater collection system (Sotralentz Habitat) was installed in a rural village in south-western France. The house was occupied by a family consisting of two parents and two children. The average rainfall in this region is 760 mm, and the average temperatures range from 7.9 - 18.3 °C. In the system installed, rainwater is first collected from a 204 m2 surface area of tiled roof and then channelled via open zinc gutters through pipes to an underground PEHD storage tank with a 5 m3 capacity. Prior to entering the tank, the water is passed through a mesh. In the event of an overflow, excess water is fed into a nearby canal. A submerged intake with an inlet filter attached to a float is used to pump water inside the house. Prior to use, collected rainwater is treated by being passed through a physical filter (25µm) and an activated carbon filter. When insufficient water is available in the tank, a probe activates a valve to allow pumping from a backup drinking water tank. The collected rainwater could be used for toilet flushing and watering gardens; it supplied water for two WCs and an outside tap. A schematic of the rainwater collection system is shown in Figure 1.
Figure 1. Schematic of the rainwater harvesting system installed in south-western France.
2.1.2. Sample collection
Sampling was carried out weekly from January 2009 to January 2010. To monitor water quality, grab samples were taken from the surface water in the tank each week. The sampling was performed using a sampling rod and a beaker. Prior to sampling, the beaker was disinfected with ethanol, rinsed once with ultra high quality water and
then rinsed twice with tank water. Samples were stored in polyethylene bottles for chemical analysis or individual sterile bottles for microbiological analysis. Temperature, pH and conductivity were measured in situ, and the sample was stored in a chilled cold-box during transportation to the laboratory, where samples were stored at 4°C. Microbiological analyses were conducted within 24 h. Samples collected to assess chemical parameters were frozen for later analysis.
2.2. Analytical determinations 2.2.1 Chemical analysis
Samples were measured for pH, conductivity, colour, turbidity, total organic carbon (TOC), ionic composition (Cl-, SO42-, NO3-, PO43-,Mg2+, Ca2+, Na+, K+, NH4+), total
hardness, simple alkalimetric title (AT), complete alkalimetric title (CAT). Samples were analysed in accordance with norms shown in Table 1. Ionic composition was analysed with ion chromatography (Dionex, AG/AS 18, ICS 2000 for anions and CG/CS 12, ICS 3000 for cations).
Table1. Physico-chemical parameters analysed
2.2.2. Microbiological analysis
All samples were examined for the three widely used bacterial indicators using the relevant ISO (International Organization for Standardization) standards: ISO 9308-1 for total coliforms and Escherichia coli, and ISO 7899-2 for enterococci, as well as ISO 6222 for total flora at 22°C and 36°C.
2.3. Multivariate data analysis
In this study, multivariate chemometric techniques were performed using the commercial software XL stat.
2.3.1 Principal component analysis
Principal Component Analysis (PCA) is one of the most applied approaches in the environmetrics to study data structures. It is aimed at finding and interpreting hidden complex and casually determined relationships between dataset features. This is accomplished by studying the data structure in a reduced dimension while retaining the maximum amount of variability present in the data. To do this, it is necessary to estimate the number of significant components present in the data. More precisely, a matrix of pairwise correlations among parameters is decomposed into eigenvectors, which, in turn, are sorted in descending order of their corresponding eigenvalues. At this point, the raw data are generally unsuitable for statistical analyses due to differences in the sizes of the variables.
Mathematically, PCA normally involves three major steps: 1) the standardisation of measurements to ensure that they have equal weights in the analysis by autoscaling
Parameter Norm pH NF T 90-008 Conductivity NF EN 27888 Turbidity NF EN ISO 7027 Cl-, SO42-, NO3-, PO43- NF EN ISO 10304-1 Mg2+, Ca2+, Na+, K+, NH4+ NF EN ISO 14911 Colour NF EN ISO 7887
Total organic carbon (TOC) NF EN 1484
Total hardness NF EN ISO 14911
the data to produce new variables, where the mean is equal to zero and the standard deviation is equal to the unit; 2) calculation of the covariance matrix by identifying the eigenvalues and their corresponding eigenvectors; and 3) the elimination of components that account only for a small proportion of the variation in data sets. 2.3.2. Cluster analysis (CA)
Cluster Analysis (CA) nicely complements PCA. It was used to search for natural groupings among objects and discover latent structures present in the data. Analysed parameters were sorted into groups, or clusters, so that the degree of association is strong between members of different clusters. Prior to CA, the descriptor variables were block standardised by range to avoid effects of scale or units on the distance measurements. Hierarchical agglomerative CA was performed on the normalised data set with the Ward’s method, using Euclidean distances as a measure of similarity. 3. Results and discussion
3.1. Descriptive statistics
Prior to multivariate analysis, univariate descriptive statistics were used to compare the measured variables with French drinking water guidelines (Decree of January 11, 2007). Indeed as it was impossible to present the complete data set which corresponds to 23 parameters for 55 samplings, minimum, maximum, mean, median and standard deviation were used to describe it (Table 2). Values less than the quantification limit were considered to be zero for statistical calculations.
The pH range of collected water was 5.6 - 10.4. Extreme alkaline values were observed after strong weather events. For example, the highest pH of 10.4 was recorded after a violent storm and remained elevated for five weeks before returning to a slightly acidic condition (Figure 2). Outside of these weather-related spikes, the pH range was 5.6 - 6.9. By comparison, the literature for Europe has reported the following pH ranges for runoff water: 6.0 - 8.2 (Villarreal and Dixon (2005)), 7.6 – 8.8 (Sazakli and al. (2007)) and 5.8 - 8.4 (Schriewer and al. (2008)). Half of the samples collected in this study exceed the drinking water limits for colour (15 mg Pt/L) and turbidity (2 NTU). Ion concentrations were low, with 89 % of conductivity values being below 100 µS.cm-1. This finding indicates that harvested rainwater had a low level of mineralisation. Concentrations in ion comply with the drinking water guidelines available, except for ammonia, which was often detected at unacceptably high levels.
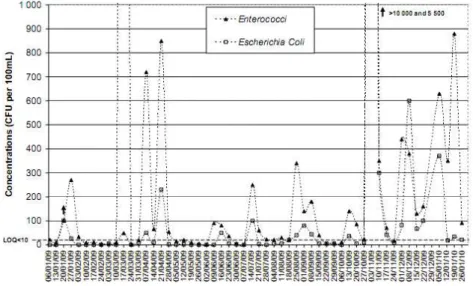
The microbiological composition of the tank water varied over the course of the year. Total flora is a measure of the total bacterial load. At 22 °C, bacterial counts ranged from 10 to 6.32x10⁵ organisms per mL. Almost all samples were contaminated with coliform bacteria (i.e., they exceeded zero organisms per 100 mL of water). Two faecal indicators were also monitored and showed varying degrees of contamination. Roof-collected rainwater often showed high levels of contamination with enterococci, as can be seen from the fact that the maximum value exceeded 10,000 CFU per 100 mL of water. The majority of samples (79 %) tested positive for E. coli, an indicator of faecal contamination. E. coli and enterococci were simultaneously present in samples, always with enterococci having the higher concentrations (Figure 3). Although these bacteria are unable to reproduce in water, enterococci has a better survival ability in water than E. coli.
Three widely used bacterial indicators, total coliform, E. coli and enterococci, were detected in the majority of samples. In concordance with previous studies (Simmons
and al. (2001) ; Albrechtsen (2002) ; Blangis and Legube (2007) ; Nolde (2007) ; Sazakli and al. (2007)), our results show that roof rainwater runoff is not suitable for human consumption due to the high levels of microbiological contamination within it. Whereas roof-collected rainwater, in general, meets the classical parameters for drinking water in terms of physico-chemistry, the bacterial contamination resent in the collected samples was above acceptable limits. As a result, it must be recommended to use a system equipped of disinfection. In addition, it must be highlighted that no first-flush diversion was used in this study. Now such a system could permit to decrease concentrations of some of the tested water quality parameters (Mendez et al., 2011).
Table 2. Descriptive statistics for the dataset
Variables Units
Obser-vations Minimum Maximum Mean Median
Standard deviation French Drinking Water Guidelines pH - 55 5.6 10.4 6.5 6.2 1.1 6.5 to 9 Temperature °C 55 7.8 22.4 14.9 13.5 4.8 25 Conductivity µS.cm-1 55 13.5 235.0 56.2 38.2 45.5 180 to 1000 Colour mg Pt.L-1 55 <5 39 18 19 10 2 Turbidity NTU 53 0.50 6.1 2.4 2.0 1.4 15 TOC mg.L-1 55 0.50 5.1 2.3 2.2 1.0 hardness mmol.L-1 55 <0.01 0.58 0.16 0.11 0.13 AT mmol.L-1 55 <0.20 0.9 0.10 <0.20 0.20 CAT mmol.L-1 55 <0.40 1.1 0.30 0.30 0.30 Cl- mg.L-1 54 0.55 4.0 1.9 1.7 0.98 250 SO4 2-mg.L-1 54 0.50 6.6 1.9 1.8 0.92 250 NO3- mg.L-1 54 0.54 7.8 2.8 2.4 1.6 50 PO43- mg.L-1 54 <0.10 0.54 0.17 0.19 0.14 Mg2+ mg.L-1 54 <0.10 0.71 0.27 0.24 0.15 Ca2+ mg.L-1 54 1.0 19 4.4 2.9 4.0 Na+ mg.L-1 54 0.30 2.9 1.1 0.93 0.59 200 K+ mg.L-1 54 0.15 4.9 1.2 0.78 1.1 NH4+ mg.L-1 54 <0.10 1.7 0.58 0.32 0.57 0.10 Total coliforms ufc per 100mL 40 <10 >10 000 656 40 2 189 Escherichia Coli ufc per 100mL 53 <10 5 500 148 2 757
Enterococci ufc per
100mL 54 <10 >10 000 322 45 1 359 Total flora at 22°C ufc per mL 52 10 632 000 45 486 9 700 108 954 Total flora at 36°C ufc per mL 51 25 368 000 26 651 4 500 67 906
Figure 2. pH values observed during the sampling period (January 2009 - January 2010). - The highest pH of 10.4 was recorded In January after a violent storm and remained elevated for five weeks before returning to a slightly acidic condition
Figure 3. Concentrations of E. coli and enterococci observed during the sampling period (January 2009 - January 2010). - E. coli and enterococci were simultaneously
present in samples, always with enterococci having the higher concentrations
3.2. Multivariate methods
A starting data matrix, with columns representing the different samplings (observations) and rows corresponding to the measured parameters (variables), was constructed. The variability of total coliform load was excluded because at least thirteen results were unusable due to the presence of an interfering flora in the sample. It must be highlighted descriptive statistics of the dataset were already presented in table 2 but multivariate analysis were performed using primary dataset. A total of 50 complete observations (no missing values across the 22 variables) were thus selected for further analysis with Principal Component Analysis (PCA) and Cluster Analysis (CA).
These 50 observations were partitioned into the following groups: 8 observations in winter 2009, 12 observations in spring 2010, 12 observations in summer 2010, 14 observations in autumn 2010 and 4 observations in winter 2010.
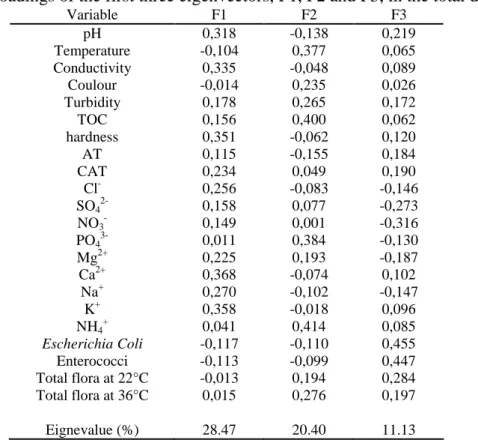
In PCA, the number of components is equal to the number of variables. A component, however, is comprised not only of a single variable but all of the variables used in the study. The PCA analysis showed that of the 22 components, the first component (F1) accounted for about 28.5 % of the total variance, the second component (F2) accounted for about 20.4 % of the total variance and the third component (F3) accounted for about 11.1 % of the total variance of the dataset. Table 3 gives the loadings for the three first components and square cosines are presented in Figure 4. A variable is increasingly well represented by a component as the corresponding value of the square cosine approaches the unit. Almost all variables are well represented by the first three components, F1, F2 or F3. Only total flora at 22°C, and AT could have been better represented by a different component. Our discussion, therefore, will focus principally on the three principal components that, collectively, explain 60.0 % of the total variance of the dataset. This reduced the dimensionality of the total data from 22 to 3 (an 86.3 % reduction) and resulted in a 40.0 % loss of information contained in the dimensions.
The variables that primarily contributed to the first eigenvector were pH, conductivity, hardness, calcium and potassium. Thus, the first principal component can be interpreted as an ionic component. The second eigenvector was mainly related to organic load, with the most significant variables being temperature, total organic carbon, and ammonium and phosphate values. The third eigenvector represented faecal contamination by enterococci and E. coli (Figure 4).
Table 3. Loadings of the first three eigenvectors, F1, F2 and F3, in the total data set.
Variable F1 F2 F3 pH 0,318 -0,138 0,219 Temperature -0,104 0,377 0,065 Conductivity 0,335 -0,048 0,089 Coulour -0,014 0,235 0,026 Turbidity 0,178 0,265 0,172 TOC 0,156 0,400 0,062 hardness 0,351 -0,062 0,120 AT 0,115 -0,155 0,184 CAT 0,234 0,049 0,190 Cl- 0,256 -0,083 -0,146 SO42- 0,158 0,077 -0,273 NO3- 0,149 0,001 -0,316 PO43- 0,011 0,384 -0,130 Mg2+ 0,225 0,193 -0,187 Ca2+ 0,368 -0,074 0,102 Na+ 0,270 -0,102 -0,147 K+ 0,358 -0,018 0,096 NH4+ 0,041 0,414 0,085 Escherichia Coli -0,117 -0,110 0,455 Enterococci -0,113 -0,099 0,447 Total flora at 22°C -0,013 0,194 0,284 Total flora at 36°C 0,015 0,276 0,197 Eignevalue (%) 28.47 20.40 11.13
Figure 4. The square cosines for all variables in a) components F1 and F2 and b) components F1 and F3. - A variable is increasingly well represented by a component
as the corresponding value of the square cosine approaches the unit. Almost all variables are well represented by the first three components.
A variable is increasingly well represented by a component as the corresponding square cosine nears the unit. Graphically, this is represented as the variable nearing the edge of the circle.
To confirm the associations between the variables in the total dataset, CA was performed on the measured chemical variables. The search for natural groupings among variables was a complementary way to study the latent structure of the data and permitted the comparison of CA results to those provided by the PCA.
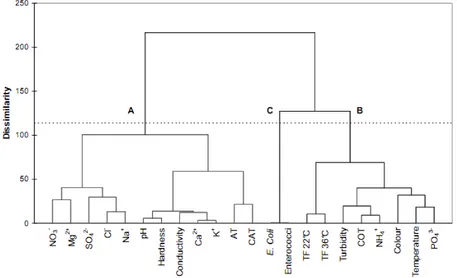
When CA was applied, the dendrogram (figure 5) showed three different clusters identified as A, B and C.
Cluster A is the ionic component previously described as the first eigenvector in PCA. The level of dissimilarity detected between cluster B and C justified that their association appeared separately in the second and third eigenvectors in PCA. There was adequate agreement between results obtained by unsupervised PCA and CA to confirm the conclusions made over the complete dataset.
Figure 5. A dendrogram obtained by application of the Ward’s method. – Three clusters were identified corresponding to the three principal components identified
with PCA.
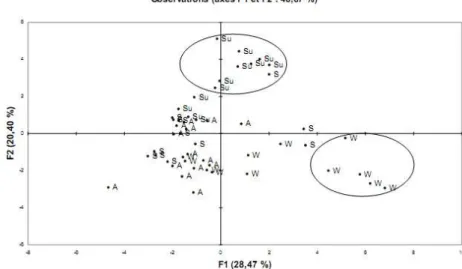
To elucidate the influence of collection date on stored rainwater composition, different observations were represented in the planes F1 through F2 (Figure 6). Sample points corresponding to the January 2009 storm event were differentiated from the central scatter plot (27/01/09, 10/02/09, 17/02/09, 24/02/09). These points are high on F1, the ionic component. In fact, the January 2009 storm strongly affected the collected water parameters, particularly in terms of pH. Samplings that occurred in summer showed high F2 values, corresponding to the bacterial load. Summer months have higher temperatures and less runoff water to refill the tank, thus, explaining the higher levels of biological contamination. Selection of three eigenvectors also permitted direct data evaluation via a three-dimensional plot (Figure 7). This representation illustrates the variability observed throughout the one year period that the roof runoff was collected.
Figure 6. A two-dimensional plot of the 50 observations in F1 and F2. - Su=Summer; A=Autumn, W=Winter, S=Spring - Observations corresponding to the storm event of January 2009 and summer collection months can be differentiated from the central
scatter plot.
Figure 7. A three-dimensional plot of the 50 observations in F1, F2 and F3. - Su=Summer; A=Autumn, W=Winter, S=Spring - Observations corresponding to the storm event of January 2009 and summer collection months can be differentiated from
the central scatter plot.
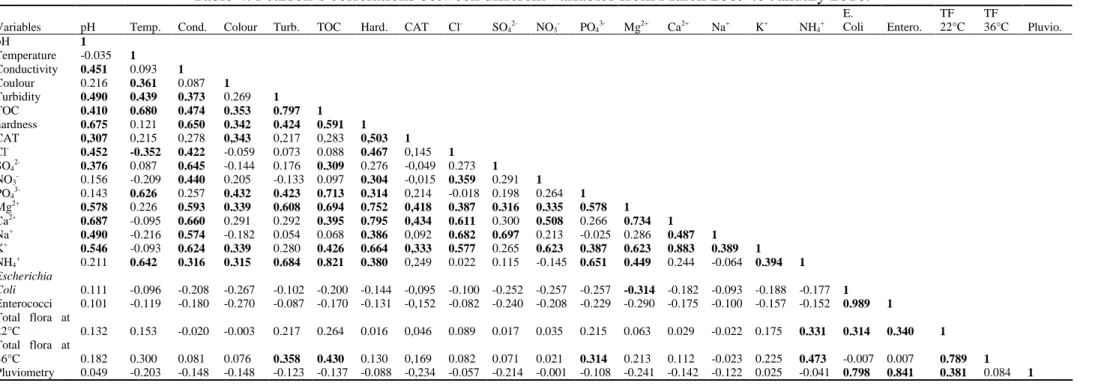
On planes F1 through F3, E. coli and enterococci were well represented and appeared to be positively correlated (Figure 4). In order to investigate this correlation and to elucidate the origin of these two faecal indicators, an additional ACP was realised using daily pluviometry as extra parameter which was only available beginning in March 2009. Sample points corresponding to the January 2009 storm event were thus excluded. The AT was also removed from analysis because it was generally below the limit of quantification. Thus, the new autoscaled matrix was comprised of 22 parameters and 43 observations.
The presence of E. coli and enterococci were significantly correlated with each other. The Pearson’s coefficient was equal to 0.989, with a corresponding regression coefficient (R2) of 0.979. In addition, the results show these two faecal indicators were significantly correlated with pluviometry. The linear Pearson’s coefficient (linear regression coefficient) was 0.798 (R2=0.637) for E. coli and 0.841(R2=0.707)
for enterococci. It should be noted that these correlations were strongly influenced by a weather event on March 11th, 2009, during which 39 mm of rain fell in one day. At this time, the bacterial loads were 33,000 CFU per 100 mL for E. coli and 30,000 CFU per 100mL for enterococci (Figure 8). As illustrated in the dendrogram, these results were confirmed in the cluster analysis (Figure 9).
Table 4. Pearson’s correlations between different variables from March 2009 to January 2010.
Variables pH Temp. Cond. Colour Turb. TOC Hard. CAT Cl- SO
42- NO3- PO43- Mg2+ Ca2+ Na+ K+ NH4+ E. Coli Entero. TF 22°C TF 36°C Pluvio. pH 1 Temperature -0.035 1 Conductivity 0.451 0.093 1 Coulour 0.216 0.361 0.087 1 Turbidity 0.490 0.439 0.373 0.269 1 TOC 0.410 0.680 0.474 0.353 0.797 1 hardness 0.675 0.121 0.650 0.342 0.424 0.591 1 CAT 0,307 0,215 0,278 0,343 0,217 0,283 0,503 1 Cl- 0.452 -0.352 0.422 -0.059 0.073 0.088 0.467 0,145 1 SO42- 0.376 0.087 0.645 -0.144 0.176 0.309 0.276 -0,049 0.273 1 NO3- 0.156 -0.209 0.440 0.205 -0.133 0.097 0.304 -0,015 0.359 0.291 1 PO43- 0.143 0.626 0.257 0.432 0.423 0.713 0.314 0,214 -0.018 0.198 0.264 1 Mg2+ 0.578 0.226 0.593 0.339 0.608 0.694 0.752 0,418 0.387 0.316 0.335 0.578 1 Ca2+ 0.687 -0.095 0.660 0.291 0.292 0.395 0.795 0,434 0.611 0.300 0.508 0.266 0.734 1 Na+ 0.490 -0.216 0.574 -0.182 0.054 0.068 0.386 0,092 0.682 0.697 0.213 -0.025 0.286 0.487 1 K+ 0.546 -0.093 0.624 0.339 0.280 0.426 0.664 0,333 0.577 0.265 0.623 0.387 0.623 0.883 0.389 1 NH4+ 0.211 0.642 0.316 0.315 0.684 0.821 0.380 0,249 0.022 0.115 -0.145 0.651 0.449 0.244 -0.064 0.394 1 Escherichia Coli 0.111 -0.096 -0.208 -0.267 -0.102 -0.200 -0.144 -0,095 -0.100 -0.252 -0.257 -0.257 -0.314 -0.182 -0.093 -0.188 -0.177 1 Enterococci 0.101 -0.119 -0.180 -0.270 -0.087 -0.170 -0.131 -0,152 -0.082 -0.240 -0.208 -0.229 -0.290 -0.175 -0.100 -0.157 -0.152 0.989 1 Total flora at 22°C 0.132 0.153 -0.020 -0.003 0.217 0.264 0.016 0,046 0.089 0.017 0.035 0.215 0.063 0.029 -0.022 0.175 0.331 0.314 0.340 1 Total flora at 36°C 0.182 0.300 0.081 0.076 0.358 0.430 0.130 0,169 0.082 0.071 0.021 0.314 0.213 0.112 -0.023 0.225 0.473 -0.007 0.007 0.789 1 Pluviometry 0.049 -0.203 -0.148 -0.148 -0.123 -0.137 -0.088 -0,234 -0.057 -0.214 -0.001 -0.108 -0.241 -0.142 -0.122 0.025 -0.041 0.798 0.841 0.381 0.084 1
Figure 8. Daily pluviometry and concentrations of E. coli and enterococci observed during the period from March 2009 through January 2010 – The two faecal indicators
were significantly correlated with pluviometry.
Figure 9. The dendrogram obtained applying the Ward’s method.- Daily pluviometry is included, and AT is excluded.
4. Conclusions
The present work presents results concerning the quality of stored roof runoff. For each sample, we measured pH, conductivity, colour, turbidity, total organic carbon, anions, cations, total hardness, AT, CAT, E. coli, enterococci, and total flora at both 22°C and 36°C. Univariate descriptive statistics for the observed variables were conducted for each sampling event. Several conclusions may be drawn from this study but it must be reminded it is based on a limited data set: the performance of a rainwater collection system was monitored weekly over a period of one year. Although harvested rainwater was found to be of good physicochemical quality, it did not meet drinking water standards. These findings are congruent with a number of other studies indicating that roof-collected rainwater makes poor quality drinking water due to high levels of bacterial contamination.
the multivariate analysis techniques. PCA and CA revealed some specific features of the data structure. Three principal components were identified which, collectively, accounted for 60.0% of the total variance; the first component was identified as the ionic component, the second component was linked with organic load and the third component represented faecal contamination. PCA results were confirmed with CA. Three clusters of variables were detected, corresponding to the three previously identified components. It is necessary to monitor at least one parameter of each of these three groups to correctly characterise roof-collected water.
The great variability of roof runoff quality over the course of the study was illustrated with a three-dimensional plot. We were able to distinguish samples that were influenced by a storm event primarily through the first component, whereas samplings obtained in summer months were discernable due to high levels of microbial contamination. It is known rainfall is characterised by its temporal and spatial distribution and its unpredictability. Most importantly, we found that the quality of roof runoff was also unpredictable over a year at the same location. This great variability is coherent with recommendation of a system equipped with a disinfection. At the same time, E. coli and enterococci were simultaneously present in collected water samples, and their presence was positively correlated with the daily pluviometry. These data suggest that runoff from the roof seeded the tank with faecal contaminants and that bacteriological quality degrades during storage. As a result a first-flush diversion could improve the quality of harvested rainwater.
Acknowledgement
The authors would like to thank Sotralentz Habitat for their provision of rainwater-harvesting equipment.
References
Al-Khashman, O.A. (2009). Chemical characteristics of rainwater collected at a western site of Jordan.
Atmospheric Research, 91(1), 53-61.
Albrechtsen, H.J. (2002). Microbiological investigations of rainwater and graywater collected for toilet flushing.
Water science and technology, 46(6-7), 311-316.
Astel, A., Mazerski, J., Polkowska, Z. and Namiesnik, J. (2004). Application of PCA and time series analysis in studies of precipitation in Tricity (Poland). Advances in Environmental Research, 8(3-4), 337-349.
Baez, A., Belmont, R., Garcia, R., Padilla, H. and Torres, M.C. (2007). Chemical composition of rainwater collected at a southwest site of Mexico City, Mexico. Atmospheric Research, 86 61-75.
Blangis, D. and Legube, B. (2007). Treatment of rain water by solar photocatalysis. European Journal of Water
Quality, 38(2), 121-130.
Chang, M., Mcbroom Matthew, W. and Scott Beasley, R. (2004). Roofing as a source of nonpoint water pollution.
Journal of environmental management, 73(4), 307-315.
Crabtree, K.D., Ruskin, R.H., Shaw, S.B. and Rose, J.B. (1996). The detection of cryptosporidium oocysts and Giardia cysts in cistern water in the U.S. Virgin Islands. Water Research, 30(1), 208-216.
C.S.H.P.F (2006). Position relating to sanitary stakes related to rainwater use for domestic uses, 05/09/06 (Conseil supérieur d’Hygiène Publique de France, position relative aux enjeux sanitaires liés à l’utilisation des eaux de pluie pour des usages domestiques).
Decree of January 11 (2007). relating to the limits and rough references of water quality and the water intended for human consumption, JO n°31, 06/02/07, (Arrêté du 11 janvier 2007 relatif aux limites et références de qualité des eaux brutes et des eaux destinées à la consommation humaine)
Decree of August 21 (2008). Relating to rainwater harvesting and their use at the interior and the outside of buildings, JO n°201, 29/08/08, (Arrêté du 21 août 2008 relatif à la récupération des eaux de pluie et à leur usage à l’intérieur et à l’extérieur des bâtiments),
Despins, C., Farahbakhsh, K. and Leidl, C. (2009). Assessment of rainwater quality from rainwater harvesting systems in Ontario, Canada. Journal of Water Supply Research and Technology-Aqua, 58(2), 117-134. Evans, C.A., Coombes, P.J. and Dunstan, R.H. (2006). Wind, rain and bacteria: the effect of weather on the
microbial composition of roof-harvested rainwater. Water Research, 40(1), 37-44.
Evans, C.A., Coombes, P.J., Dunstan, R.H. and Harrison, T. (2007). Identifying the major influences on the microbial composition of roof harvested rainwater and the implications for water quality. Water science and
Evans, C.A., Coombes, P.J., Dunstan, R.H. and Harrison, T. (2009). Extensive bacterial diversity indicates the potential operation of a dynamic micro-ecology within domestic rainwater storage systems. Science of the
Total Environment, 407(19), 5206-5215.
Handia, L., Tembo, J.M. and Carolinemwiindwa (2003). Potential of rainwater harvesting in urban Zambia.
Physics and Chemistry of the Earth, 28 893–896.
Horak, H.M., Chynoweth, J.S., Myers, W.P., Davis, J., Fendorf, S. and Boehm, A.B. (2010). Microbial and metal water quality in rain catchments compared with traditional drinking water sources in the East Sepik Province, Papua New Guinea. Journal of Water and Health, 8(1), 126-138.
Hu, G.P., Balasubramanian, R. and Wu, C.D. (2003). Chemical characterization of rainwater in Singapore.
Chemosphere, 51(8), 747-755.
Huston, R., Chan, Y.C., Gardner, T., Shaw, G. and Chapman, H. (2009). Characterisation of atmospheric deposition as a source of contaminants in urban rainwater tanks. Water Research, 43(6), 1630-1640.
Khare, O., Goel, A., Patel, D. and Behari, J. (2004). Chemical characterization of rainwater at a developing urban habitat of Northern India. Atmospheric Research, 69 135-145.
Kulshrestha, U.C., Kulshrestha, M.J., Sekar, R., Sastry, G.S.R. and Vairamani, M. (2003). Chemical characteristics of rainwater at an urban site of south-central India. Atmospheric Environment, 37 3019-3026.
Lee, J.Y., Yang, J.S., Han, M. and Choi, J. (2010). Comparison of the microbiological and chemical characterization of harvested rainwater and reservoir water as alternative water resources. Science of the Total
Environment, 408(4), 896-905.
Lye, D.J. (2009). Rooftop runoff as a source of contamination: A review. Science of the Total Environment, 407(21), 5429-5434.
Mantovan, P., Pastore, A., Szyrkowicz, L. and Zilio-Grandi, F. (1995). Characterization of rainwater quality from the Venice region network using multiway data analysis. The Science of the Total Environment, 164, 27-43. May, S. and Prado, R.T.A. (2006). Experimental evaluation of rainwater quality for non-potable applications in the
city of Sao Paulo, Brazil. Urban Water Journal, 3(3), 145-151.
Mendez, C.B., Klenzendorf, J.B., Afshar, B.R., Simmons, M.T., Barrett, M.E., Kinney, K.A., Kirisits, M.J. (2011). The effect of roofing material on the quality of harvested rainwater. Water Research, 45(5), 2049-2059. Nolde, E. (2007). Possibilities of rainwater utilisation in densely populated areas including precipitation runoffs
from traffic surfaces. Desalination, 215(1-3), 1-11.
Ouyang, Y. (2005). Evaluation of river water quality monitoring stations by principal component analysis. Water
Research, 39(12), 2621-2635.
Pinfold, J.V., Horan, N.J., Wirojanagud, W. and Mara, D. (1993). The bacteriological quality of rainjar water in rural northeast thailand. Water Research, 27(2), 297-302.
Sazakli, E., Alexopoulos, A. and Leotsinidis, M. (2007). Rainwater harvesting, quality assessment and utilization in Kefalonia Island, Greece. Water Research, 41(9), 2039-2047.
Schriewer, A., Horn, H. and Helmreich, B. (2008). Time focused measurements of roof runoff quality. Corrosion
Science, 50(2), 384-391.
Simeonov, V., Kalina, M., Tsakovski, S. and Puxboum, H. (2003). Multivariate statistical study of simultaneously monitored cloud water, aerosol and rainwater data from different elevation levels in an alpine valley ( Achenkirch, Tyrol, Austria). Talanta, 61 519-528.
Simmons, G., Hope, V., Lewis, G., Whitmore, J. and Gao, W. (2001). Contamination of potable roof-collected rainwater in Auckland, New Zealand. Water Research, 35(6), 1518-1524.
Uba, B.N. and Aghogho, O. (2000). Rainwater quality from different roof catchments in the Port Harcourt district, rivers state, Nigeria. Journal of Water Supply: Research and Technology - AQUA, 49(5), 281-288.
Vazquez, A., Costoya, M., Pena, R.M., Garcia, S. and Herrero, C. (2003). A rainwater quality monitoring network: a preliminary study of the composition of rainwater in Galicia (NW Spain). Chemosphere, 51(5), 375-386. Villarreal, E.L. and Dixon, A. (2005). Analysis of a rainwater collection system for domestic water supply in
Ringdansen, Norrköping, Sweden. Building and Environment, 40 1174-1184.
Zhang, P., Dudley, N., Ure, A.M. and Littlejohn, D. (1992). Application of principal component analysis to the interpretation of rainwater compositional data. Analytica Chimica Acta, 258 1-10.
Zhu, K., Zhang, L., Hart, W., Liu, M. and Chen, H. (2004). Quality issues harvested rainwater in arid and semi-arid Loess Plateau of nothern China. Journal of Arid Environments, 57 487-505.
Zunckel, M., Saizar, C. and Zarauz, J. (2003). Rainwater composition in northeast Uruguay. Atmospheric