ةرازو
ميلعتلا
يلاعلا
ثحبلاو
يملعلا
MINISTERE DE L’ENSEIGNEMENT SUPERIEURET DE LA RECHERCHE
SCIENTIFIQUE
ةعماج
تاحرف
سابع
فيطس
1
UNIVERSITE FERHAT ABBAS SETIF-1-
THESE
Présentée à la Faculté de Technologie
Pour l’Obtention du Diplôme de
DOCTORAT
Domaine : Sciences et Technologie
Filière : Electrotechnique
Option : Réseaux Electriques
Par
Khaled Ben Oualid MEDANI
Contribution à l’Optimisation du
Fonctionnement des Réseaux Electriques
Soutenue le: 10/04/2019 devant un jury composé de:
GHERBI Ahmed
Pr
Univ. Ferhat Abbas - Sétif 1
PrésidentSAYAH Samir
Pr
Univ. Ferhat Abbas - Sétif 1
DirecteurHAMOUDA Abdellatif
Pr
Univ. Ferhat Abbas - Sétif 1
ExaminateurDIB Djalel
Pr
Univ. L'Arbi Tbessi - Tébessa
ExaminateurI dedicate this thesis to my
Mother and my Father
To my Brother and my Sisters
To my colleagues and friends in my social and academic life
ii
Acknowledgement
Above all, I would like to thank The Almighty God ALLAH for the wisdom and perseverance that he has been bestowed upon me during this research work, and indeed, throughout my life.
It has been a pleasure for me to work on this thesis. I hope the reader will find it not only interesting and useful, but also comfortable to read.
First and foremost, I would like to express my sense of gratitude and indebtedness to my supervisor
Pr. SAYAH Samir for his inspiring guidance, encouragement, and untiring effort throughout the course
of this work. His timely help and painstaking efforts made it possible to present the work contained in this thesis. I consider myself fortunate to have worked under his guidance during four years (2014- 2018).
Also, I express my heartfelt thanks to Dr. BEKRAR Abdelghani for giving me a great opportunity to get an internship at LAMIH, UMR CNRS 8201, University of Valenciennes and Hainaut-Cambrésis, UVHC, Le Mont Houy, 59313 Valenciennes Cedex, France.
My deepest gratitude is also due to the members of the jury: Pr.
GHERBI Ahmed, Pr. DIB
Djalel Pr.
MESSALTI Sabir, Pr.HAMOUDA Abdellatif
Dr.BEKRAR Abdelghani
, for serving as my committee members and taking the time to revise my thesis. I am thankful that in the midst of all their activities, they accepted to be members of the reading committee.I am grateful to my parents for their prayers, guidance and support throughout my education. Their inspiration and encouragement has been invaluable.
My sincere thanks to my friends Faysal, oussama and all aftis familly for the patience, unconditional support and dedication they have shown.
iii
صخلم
:
عيزوت ربتعي ( لثملأا يلعا فتلا ةقاطلا OPRD ( لثملأا ةقاطلا قفدتل ةيعرف ةلكشم ) OPF ةقاطلا دراوم ةرادإ ىلإ ىعسي يذلا ) ( لثملأا يلعا فتلا ةردقلا عيزوت ةلكشم لحل ةبرا قم لمعلا اذه مدقي .حيحص لكشب ماظنلل ةيلعا فتلا ORPD ماظنلا ليغشت قايس يف ) ةعومجم يفو ةيداعلا فورظلا يف يئابرهكلا .ةئراطلا تلااحلا نم ( ةيلعا فتلا ةقاطلل لثملأا عيزوتلا ةلكشم لح مت ORPD مادختساب ) لاثمتسا لثم ،ةيئاوشع تايمزراوخ رصانع ( برسلا PSO و ، ةسدنهلا يف نيسحتلا لكاشم لح يف ةعئاشلا تاينقتلا نم ةدحاو يه و ، ) ا توحلا كولس دمتعت نيسحت ةيمزراوخ يهو ، ةثيدح ةينقت اضيا ديصلا يف بدحمل (WOA) . يحيحصت ماظن حارتقا مت كلذ ىلع ةولاع ةزهجا ساسأ ىلع مئا ق FACT يتلا تايمزراوخلا ةحص نم ققحتلا لجأ نم .ئراوطلا فورظ لظ يف ثدحت يتلا تاكاهتنلاا نم فيفختلل ماظن ىلع ةحرتقملا تاينقتلا رابتخاو صحف مت ،اهريوطت مت IEEE 14 و ةدقع 03 اظنو ةدقع يرئازجلا ةقاطلا ديوزت م 111 .ةدقع اريخأ رابتخا قيبطت مت ، ANOVA ةحرتقملا ةيمزراوخلا ءادأ نم ققحتلل . ةيحاتفملا تاملكلا اتيم ، ةيلعا فتلا ةردقلل لثملأا عيزوتلا : ھ نيابتلا ليلحت ، ئراوط ةلاح ، كيتسوري .WOA,PSO,ANOVA
Abstract:
The optimal reactive power dispatch (OPRD) is a sub-problem of the optimal power flow (OPF) that Seeks to properly manage the reactive power resources of the system. This work presents an approach which aims to solve the problem of optimal reactive power dispatch (ORPD) in power system operation under normal and under a set of contingency conditions. The optimal reactive power dispatch (ORPD) problem was solved using a population meta-heuristic methods such as Partical Swarm Optimization (PSO) which is one of the popular techniques, and a recent technique namely Wale Optimization Algorithm WOA. Corrective action scheme based on FACT devises was proposed to mitigate the violations caused in contingency conditions. In order to validate the elaborated algorithms for the various combinations, the proposed techniques were examined and tested on the IEEE 14-bus, 30-bus, and a practical equivalent Algerian electric 114-bus power system. Afterwards, an analysis of variance study (ANOVA) F-test has been applied in order to verify the performance of our proposed algorithm in solving the ORPD.
Keywords: Optimal reactive power dispatch, meta-heuristic techniques, Contingency
analysis, analysis of variance ANOVA F-test, PSO, WOA.
Résumé:
La répartition optimale de la puissance réactive (OPRD) est un sous-problème du transit optimal de puissance (OPF) dont l’objectif est de rationaliser des ressources de puissance réactive disponibles. Ce travail présente une approche visant à résoudre le problème de la répartition optimale de la puissance réactive (ORPD) dans le cadre du fonctionnement d’un réseau électrique dans des conditions normales et dans un ensemble de conditions d’urgence. Le problème de répartition optimale de la puissance réactive (ORPD) a été résolu à l'aide d'une méthode métaheuristique de population, telle que l'optimisation par essaims de particules (PSO), qui est une technique populaire, et une technique récente, à savoir l'algorithme d'optimisation des Baleines (WOA). Une stratégie de mesure corrective basée sur les dispositifs FACT a été proposée pour atténuer les violations causées dans des conditions d'urgence. Afin de valider les algorithmes élaborés pour les différentes combinaisons, les techniques proposées ont été examinées et testées sur le système IEEE à 14 nœuds, à 30 nœuds et dans le réseau de transport Algérien HT ayant 114 bus. Finalement, une analyse de variance par l’approche ANOVA été menée afin de vérifier les performances de notre algorithme proposé pour la résolution des problèmes traitées.
Mots-clés: Répartition optimale de la puissance réactive, Techniques métaheuristiques,
iv
Table of contents:
Dedication ... .I Acknowledgments ... .II صخلم–Abstract -Résumé- ... .III Table of Contents ... .IV List of Figures ... VIII List of Tables ... .X List of Abreviation ... .XI List of Acronymes ... .XIV
Chapter 0 General Introduction ... 01
0.1 General Introduction ... 02
0.2 Objectives and contributions ... .03
0.3 Organization of the Thesis ... .03
0.4Scientific production ... 04
0.4.2 Conference papers ... 04
0.4.3 Journal papers ... 05
0.5 References ... .05
Chapter 1 Reactive Power Compensation Technologies and FACT Devices… ... 06
1.1 Introduction ...07
1.2 Reactive power compensation ...07
1.3 Var generator technologies ...08
1.3.1 Traditional Var generators ...08
1.3.1.1. Capacitors ...08
1.3.1.2. Inductances ...08
1.3.1.3. Generators ...08
1.3.1.4. Synchronous compensators ...08
1.3.1.5. Static compensators ...09
1.3.2 FACT devices technology ...09
1.3.2.1. Definition ...09
1.3.2.2. Role of FACTS devices ...09
1.3.2.3. General classification of these FACTS devices ...10
A. Series Controllers ...10
B. Shunt controllers ...10
C. Combined Series-Series Controllers ...11
D. Combined Series-Shunt Controllers ...11
1.4 FACTS devices modeling ...11
1.4.1 Power injection at the ends of the line ...11
1.4.2 Creating a fictional bus ... 12
1.4.3 Modification of the admittance matrix ...13
1.4.4 Choice of devices ...14
v
1.4.5.1. Integration of the TCSC into the system ...15
1.4.5.2. SVC placed in the end of line (bus) ...15
1.4.5.3. SVC placed in the middle of the line ...16
1.4.6. Series compensation devices ...18
1.4.6.1. Model of the Thyristor series compensator ...19
1.4.6.2. Integration of the TCSC into the system ...19
1.5 Conclusion ...20
1.6 References ...20
Chapter 2 Comprehensive Review of Optimal Reactive Power Dispatch: Objectives, Constraints, and Metaheuristic Optimization Strategies. ... .22
2.1 Introduction...23
2.2 Objective function models on ORPD ...25
2.2.1 Minimize Real power loss ...25
2.2.2 Minimize load voltage deviation TVD ...25
2.2.3 Maximize voltage stability index ...26
2.2.4 Minimization VAR cost ...27
2.2.5Minimization of Fuel cost ...27
2.2.6Multi-objective function ...27
2.3 Constraintmodels on ORPD...29
2.3.1 Equality Constraints ...29
2.3.2 Inequality Constraints ...29
2.4 Meta-heuristic algorithms employed on ORPD problem ...31
2.4.1 Evolutionary-Based Algorithms ...31
2.4.1.1 Genetic algorithms (GA) ...31
2.4.1.2 Differential evolution (DE) ...32
2.4.1.3 Biogeography Based Optimization (BBO) ...33
2.4.2 Swarm Intelligence Algorithms ...33
2.4.2.1 Particle swarm optimization (PSO) ...33
2.4.2.2 Ant colony optimization (ACO) ...34
2.4.2.3 Artificial bee colony (ABC) ...34
2.4.2.4 Cuckoo search algorithm (CSA)...35
2.4.2.5 Gray wolf Optimizer (GWO) ...35
2.4.2.6 Whale optimization algorithm (WOA) ...36
2.4.3 Algorithms Based on Physical Phenomena ...36
2.4.3.1 Simulated annealing(SA) ...36
2.4.3.2 Gravitational search Algorithm (GSA) ...36
2.4.3.3 Water Cycle Algorithm (WCA) ...37
2.4.4 Human behavior based algorithms ...37
2.4.4.1 Harmony Search (HS) ...37
2.4.4.2 Imperialist competitive algorithm (ICA) ...38
2.4.4.3 Teaching LearningBased Optimization (TLBO) ...38
2.4.4.4 Artificial immune Algorithm (AIA) ...39
2.4.4.5 Bacterial Foraging Optimization algorithm (BFO) ... 39
2.5 Comparative study ...39
vi
2.7 References ... .42
Chapter 3 Application of Artificial Techniques to ORPD. ... .51
3.1 Introduction... ...52
3.2 Problem Formulation Of ORPD Problem ... .52
3.2.1 Objective function ... .52
3.2.2 Constraints ... .53
3.3 Metaheuristics Techniques Applied To ORPD ... .54
3.3.1 Particle Swarm Optimization ... .54
3.3.2 Particle Swarm Optimization With Time Varying Acceleration Coeifficient ... .56
3.3.3 Whale Optimization Algorithm ... .57
3.3.3.1 Brief review of Whale optimization Algorithm ... .57
3.3.3.2 Computational Procedure of Whale optimization Algorithm ... .59
3.3.3.3 Implementation of WOA for ORPD Problem ... .60
3.4 Simulation Results and Discussion ... .61
3.4.1 Case study for IEEE 14 bus... .63
3.4.2 Case study for IEEE 30 bus... .65
3.5 Statistical study ... .67
3.6 Conclusion ... .68
3.7 References ... .69
Chapter 4 ORPD Under Various Contingency Conditions. ... .71
4.1 Introduction... ...72
4.2 Contingency Analysis in power system ... .72
4.2.1 Preventive state ... 72
4.2.2 Emergency state ... 73
4.2.3Restorative state ... 73
4.3 Violations caused by a contingency ... .74
4.3.1 Preventive state ... 74
4.3.2 Emergency state ... 74
4.4 Corrective action scheme ... .75
4.5 Proposed approach ... .75
4.6 Application of ORPD under contingency conditions ... .76
4.6.1Contingencies and violations ... 76
4.6.2Corrective action scheme to mitigate problem caused by contingency ... 80
4.6.1 ORPD under contingency conditions considering SVC ... 81
4.6.2ORPD under contingency conditions considering TCSC ... 83
4.6.3ORPD under contingency conditions considering SVC & TCSC ... 85
4.7 Conclusion ... .88
4.8 References ... .89
Chapter 5 ORPD for Large Scale Power System in Normal and Under Contingency Conditions ... .89
5.1 Introduction...90
vii
5.3. ORPD in normal conditions ...91
5.3.1. Simulation results ...91
5.4.ORPD under contingency conditions ...94
5.4.1. Corrective action scheme to mitigate problems caused by contingency ...97
5.8. Conclusion………. ...100
5.9 References ...100
Chapter 6 General Conclusion and Future Works ... .101
6.1. General Conclusion ... 102
viii
List of Figures:
Figures of Chapter 1
Figure.1.1. Power injection modeling: a) line with FACTS, b) line with equivalent injections. ….12
Figure.1.2. Modeling with fictitious node: a) line with FACTS, b) equivalent representation. .... ….12
Figure.1.3. Integration of FACT device in transmission line.. ...……….13
Figure.1.4. Modeling of SVC: a) symbol, b) model. ... .15
Figure.1.5. Variation of the reactive power absorbed by a SVC versus the voltage at bus i…….. ..15
Figure.1.6. SVC placed at bus.. ... .16
Figure.1.7. SVC placed in the middle of the line. ... .16
Figure.1.8. Transformation into an equivalent line with a SVC in the middle. ... .17
Figure.1.9. Parameters of an equivalent line with SVC in the middle. ... .18
Figure.1.10. TCSC modeling: a) general model b) model.. ... .19
Figure.1.11. TCSC inserted in a line. ... ……… 19
Figures of Chapter 2 Figure.2.1. Classification of meta-heuristic algorithms. ... .24
Figure.2.2. Elements of a general mathematical optimization model related to ORPD. ... .30
Figures of Chapter 3 Figure.3.1. Flow Chart of the PSO Based Reactive Power Dispatch. ... .55
Figure.3.2. Flow Chart of the PSO-TVAC Based Reactive Power Dispatch.. ... .57
Figure.3.3. Bubble-net hunting behavior of humpback whale ... .58
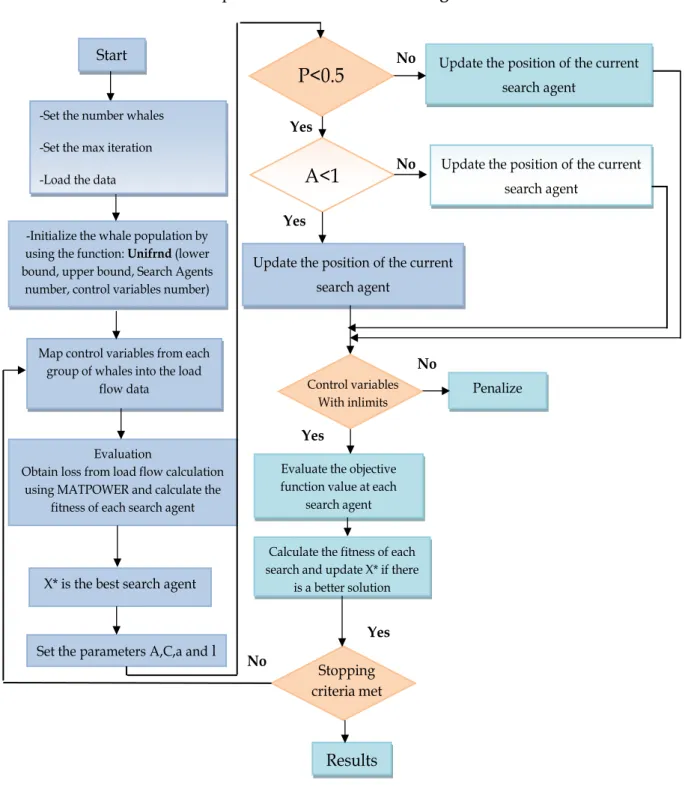
Figure.3.4. Flow chart of proposed WOA for solving ORPD... ... .61
Figure.3.5. Results of real power loss for different population size of whales, IEEE 14-bus ... .62
Figure.3.6. Results of real power loss for different population size of whales, IEEE 30-bus. ... .62
Figure.3.7. Performance characteristics of algorithms for IEEE 14-bustestsystem. ... .65
Figure.3.8. Performance characteristics of algorithms for IEEE 30-bustestsystem. ... .66
Figures of Chapter 4 Figure.4.1. Voltage profile for all cases obtained by WOA. ...79
Figure.4.2. Line transmission power for all cases obtained by WOA ... .79
Figure.4.3. Voltage profile for case 02 with and without SVC ... .82
Figure.4.4. Voltage profile for case 03 with and without SVC... ... .82
Figure.4.5. Voltage profile for case 04 with and without SVC ... .82
Figure.4.6. Line power transmission for case 02 with and without TCSC. ... .84
Figure.4.7. Voltage profile for case 02 with SVC and Both SVC-TCSC ... .85
Figure.4.8. Voltage profile for case 03 with SVC and Both SVC-TCSC.. ... .86
Figure.4.9. Voltage profile for case 04 with SVC and Both SVC-TCSC. ... .86
Figure.4.10. Line power transmission for case 02 with SVC, TCSC and both SVC-TCSC ... .86
Figure.4.11. Line power transmission for case 03 with SVC, TCSC and both SVC-TCSC ... 87
ix
Figures of Chapter 5
Figure.5.1. Algerian electric power system map. ... .90
Figure.5.2. Results of real power loss for different population size of whales, Algerian 114-bus ... .91
Figure.5.3. Performance characteristics of WOA algorithm for equivalent Algerian test system .... .93
Figure.5.4. Voltage profile after power flow ... .93
Figure.5.5. Voltage profile after optimal reactive power flow ... .93
Figure.5.6. Performance characteristics of WOA algorithm for Case 01 ... .96
Figure.5.7. Voltage profile for all cases obtained by WOA. ... .96
Figure.5.8. Voltage profile for case 01 with and without SVC-TCSC ... .99
Figure.5.9. Voltage profile for case 02 with and without SVC-TCSC ... .99
x
List of Tables:
Tables of Chapter 1
Table.1.1. FACTS types that can be modeled by creating a fictional node. ... .13
Tables of Chapter 2 Table.2.1. Classification objective function models applied to ORPD... ... .28
Table.2.2. Matrix of objectives, constraints and solution algorithms for ORPD. ... .40
Tables of Chapter 3 Table.3.1. Description of test systems. ... .63
Table.3.2. The limits of the control variables for IEEE 14-bus test system. ... .63
Table.3.3. Range, initial and obtained setting of generator active and reactive power output... ... .64
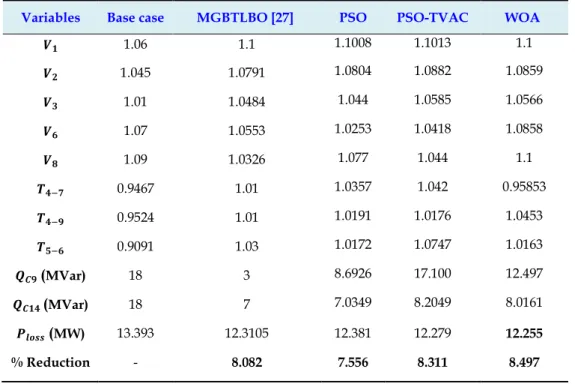
Table.3.4. Comparison of results for IEEE 14-bus system. ... .64
Table.3.5. Limits of various variables for IEEE 30-bus test system. ... .65
Table.3.6. Range, initial and optimal setting of generator active and reactive power output.. ... .66
Table.3.7. Comparison of results for IEEE 30-bus system. ... .67
Table.3.8. Analysis of variance for the results case IEEE 14-bus. ... .68
Table.3.9. Analysis of variance for the results case IEEE 30-bus. ... .68
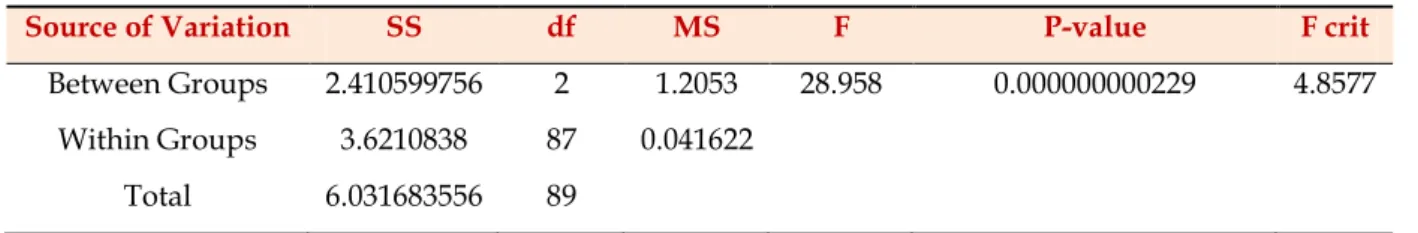
Table.3.10. One-way ANOVA test for the results obtained by PSO, PSO-TVAC and the proposed WOA method ... .68
Tables of Chapter 4 Table.4.1. Different case Studies.. ... .76
Table.4.2. Initial value of real power loss for every case study. ... .77
Table.4.3. Comparison of results for IEEE 30-bus system.... ... .77
Table.4.4. Range, initial and optimal setting of generator active and reactive power output.. ... .78
Table.4.5. Comparison of results for IEEE 30-bus system considering SVC ... .81
Table.4.6. Comparison of results for IEEE 30-bus system considering TCSC. ... .83
Table.4.7. Comparison of results for IEEE 30-bus system considering SVC & TCSC ... .85
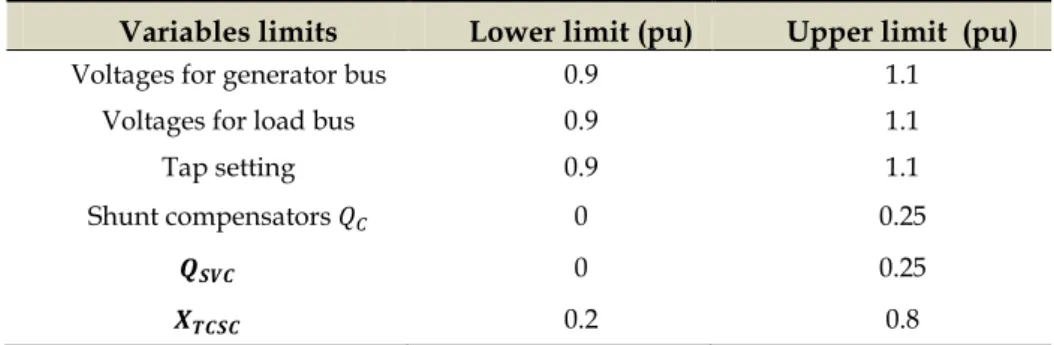
Tables of Chapter 5 Table.5.1. Limits of various variables for Algerian 114-bus test system.. ... .91
Table.5.2. Comparison of results for Algerian 114-bus system ... .92
Table.5.3. Different case Studies……….…..…….……...94
Table.5.4. Initial value of real power loss for every case study. ... .94
Table.5.5. optimal setting of control variables for all cases ... .95
xi
List of Abreviations:
AGA Adaptive genetic algorithmDE Differential evolution
PSO-w Particle swarm optimization with inertia weight
PSO-Cf Particle swarm optimization with constriction factor
CLPSO Comprehensive learning particle swarm optimizer
MOAIA Multi-objective adaptive immune algorithm
IGA Immune Genetic Algorithm
CMAES covariance matrix adopted evolutionary strategy
MNSGA-II Modified Non-Dominated Sorting Genetic Algorithm-II
NSGA-II Non-Dominated Sorting Genetic Algorithm-II
RGA Real coded Genetic Algorithm
EP Evolutionary Programming
SOA Seeker Optimization Algorithm
MASRL Multi-agent-Based Reinforcement Learning
MGA Multi-objective Genetic Algorithm
FSGA Fast synthetic Genetic Algorithm
Fuzzy-GA Fuzzy Genetic Algorithm
SQP: sequential quadratic programming
MODE Multi-objective Differential Evolution
SPEA2 Strength Pareto Evolutionary Algorithm 2
MTLA-DDE Modified teaching learning algorithm and double differential evolution algorithm
TLA Teaching learning algorithm.
DDE Double differential evolution algorithm.
EPSDE Ensemble of Mutation and Crossover Strategies and Parameters in Differential Evolution.
Sa-DE Self-adaptive Differential Evolution.
SF Superiority of feasible solutions.
SP Self-adaptive penalty
EC Ε-Constraint0
SR Stochastic Ranking.
ECHT Ensemble of Constraint Handling Techniques.
GPAC General Passive Congregation PSO.
LPAC Local Passive Congregation PSO.
CA Coordinated Aggregation.
IP-OPF interior point based OPF.
PSO-TVAC Particle Swarm Optimization with time varying acceleration coefficients.
MVO Multi verse Optimize.
QEA Quantum-inspired evolutionary algorithm.
2ArchMGWO Two-archive multi-objective grey wolf optimizer.
HTSSA Hybridized Tabu Search-Simulated Annealing.
SA Simulated Annealing.
TS Tabu Search.
OGSA opposition-based gravitational search algorithm.
OSAMGSA Novel Opposition-Based Self-Adaptive Modified Gravitational Search Algorithm.
NGBWCA Gaussian Bare-Bones Water Cycle Algorithm.
GBICA Gaussian Bare-bones multi-objective Imperialist Competitive Algorithm.
JGG Jumping Gene Genetic Algorithm.
NSGA-I Non-dominated Sorting GA-II.
OMOPSO Optimized PSO-based Multi-Objective Optimization algorithm.
VEPSO Vector Evaluated Particle Swarm Optimization.
MOPSO-CD algorithm with the use of Crowding Distance mechanism.
ITDEA Interactive Territory Defining Evolutionary Algorithm.
NEKA Neighborhood Knowledge-Based Evolutionary Algorithm.
GDE3 Generalized Differential Evolution 3 Algorithm.
MICA-IWO Hybrid Modified Imperialist Competitive Algorithm And Invasive Weed Optimization
xii
QOTLBO Quasi-Oppositional Teaching Learning Based Optimization.
GBTLBO Gaussian Bare-Bones Teaching Learning Based Optimization.
HA Harmony Search Algorithm.
BB-BC Big Bang-Big Crunch.
MOAIA Multi-Objective Adaptive Immune Algorithm.
xiii
List of Acronyms :
Objective function.Vector of equality constraints.
Sets of inequality constraints.
Active power loss.
, Voltage of and buses respectively.
, Generation and load bus voltage respectively.
Real generation of slack generator.
Active and reactive power of generator.
Active and reactive power of load bus.
Conductance, admittance and Phase difference of voltages between And Bus.
Tap-setting of transformer of branch k.
Apparent power flow through lth transmission line.
N Buses’ number.
NG Generators’ number.
NT Tap regulating transformers’ number.
NTL Transmission lines’ number.
NC Shunt VAR compensators’ number.
NPQ Number of PQ buses.
Penalty factor related to generators. Penalty factor related to generators reactive.
t Current iteration.
A, C Coefficient vector.
X* Position vectorof the best solution obtained.
X Position vector.
| | Absolute value.
. Element-by-element multiplication.
a Vector linearly decreased from 2 to 0.
r Random vector limited into [0, 1].
b Constant for defining the shape of the logarithmic spiral.
l Random number uniformly distributed in the range of [-1, 1].
p Probability for each encircling way.
X_rand Chosen randomly from whales in the current trial run.
Penalty factor related to generators. Penalty factor related to generators reactive.
t Current iteration.
A, C Coefficient vector.
X* Position vector of the best solution obtained.
X Position vector.
| | Absolute value.
. Element-by-element multiplication.
a Vector linearly decreased from 2 to 0.
r Random vector limited into [0, 1].
b Constant for defining the shape of the logarithmic spiral.
l Random number uniformly distributed in the range of [-1, 1].
p Probability for each encircling way.
Chapter 0
General Introduction
0.1 General introduction... 02
0.2 Objectives and contributions ... .03
0.3 Organization of the thesis ... .03
0.5 Scientific production ... 04
0.5.1 Conference papers ... 04
0.5.2 Journal papers ... 05
0.6 References ... .05
Abstract:
In this chapter, a brief general introduction based on analyzing and studying of the well-known optimal reactive power dispatch ORPD problem in normal and under contingency conditions is presented. There will also be some arguments that reflect the main proposed contributions in this manuscript. Then, the organization and structure of thesis takes a place in this chapter. Finally, the scientific contributions involving conference papers and journal papers that were published during this thesis are provided.
Page -2-
0.1 General introduction
Along with the development of the economic, the scale of the power grid also keeps growing. In some areas, however, the construction and upgrading of the power grid did not keep pace with the growth of the loads. Then a severe shortage of the reactive power would appear. For the purpose of minimizing the real power loss, utility companies can either change the structure of the power grid or replace the old wiring with lower impedance lines. However, both of these methods require investing large amounts of money. So, the simplest and most economical way remains the optimal allocation of reactive power dispatch and adapts the electrical power system to operate close to its permissible operating limits.
The advantage of this solution is the efficient operation of already installed electrical networks, however it requires the use of very sophisticated control means to ensure a healthy and secure conduct of charged electrical networks. FACTS technology is a means to fulfill this function. It is based on power electronics to control different power grid parameters, namely active power, reactive power, and voltage. Several types of FACTS exist in the industry and the choice of the appropriate device depends on the objectives.
In the early days, the starting point of reactive power dispatch is to improve the power factor at each end user by installing reactive power compensators. This approach, of course, can reduce the total power loss. But in order to get the maximum profit, electricity grid designers have to take a more holistic view and calculate the power flow.
In large power grids, efficient distribution of reactive power is required to maintain the voltage within acceptable operating limits and to control transmission losses. Reactive power is critical to the operation of the power networks on both safety aspects and economic aspects. Rational reactive power dispatch scheme can improve the power quality as well as reduce the real power loss. On the contrary, if the reactive power is unreasonably allocated, then it will bring great economic losses and might even threaten the security of the power grid.
One of the essential goals of reactive energy dispatch is to ensure the viability and continuity of operation of the electrical energy system in the many different states. Dy Liacco in [1] introduced the concept of the preventive (normal), emergency, and restorative operating states and their associated controls, which mean that power system, may be identified to be operating in a number of states.
While operating power system, it is necessary to consider a factor which relates to the system security and involves the design of the system to maintain the system security in
Page -3-
normal conditions and under various contingencies. In the modern days, the power system is becoming wide and complex. Contingency analysis of a power system is a major activity in power system planning and operation. In general, line outage, transformer outage and generator outage are most common type of outages; they may lead to over loads in other branches and/or sudden system voltage rise or drop [2]. So for this reason, optimal reactive power dispatch has to be studied in normal conditions and under contingencies.
The problem of reactive energy planning has already been tackled by several approaches, as the literature shows; based on conventional optimization methods as well as metaheuristic techniques. In recent years, and to overcome this problem, meta-heuristic techniques are more and more applied. These methods in general do not require the convexity of the objective function and have a high probability to converge towards the minimum global.
0.2 Objectives and contributions
This doctoral thesis focused on improving the performance of electrical networks through the optimal allocation of reactive power. The performance of the power grid is evaluated in terms of active losses and voltage profile regulation.
The core contributions of this thesis are as follow:
Original holistic review of several possible objective functions, constraints and meth heuristics applied to solve the optimal reactive power dispatch ORPD in the last 10 years.
A novel approach based on the Whale Optimization Algorithm (WOA) has been proposed for ORPD in normal and under contingency conditions in standard IEEE power systems with (14 and 30 buses) and the large scale Algerian 114-bus electric test system in order to evaluate the performance of the power grid in terms of voltage profile, and active power losses with satisfying the power system constraints.
Statistical analysis has been achieved in this study using One-way ANOVA test system,
to give a certain level of confidence to our study and evaluate which algorithms are most suitable in solving the ORPD problem.
0.3 Organization of the Thesis
After a general introduction to the undertaken work, the main body of the thesis is struc-tured as follows:
In the first chapter, reactive power compensation technologies are presented in the first part. Then, the second part is devoted to a general presentation and modeling of the FACTS technology. Models are proposed for stationary operating states.
Page -4-
The second chapter presents the general background, objective functions, constraints, and algorithm techniques of Optimal Reactive Power Dispatch (ORPD). Several mathematical models of ORPD in the literature are summarized. The mathematical formulation of the objective and performance functions commonly used in the (ORPD) was presented in this chapter, the proposed solution techniques were classified and some comparisons between methods were reported.
In the third chapter, problem formulation of (ORPD) is detailed. In addition, different metaheuristic algorithms namely, particle swarm optimization (PSO), particle swarm optimization with time varying acceleration coefficients (PSO-TVAC) and a recent metaheuristic technique namely, whale optimization algorithm (WOA) will be successfully applied to solve the optimal reactive power dispatch ORPD problem in normal conditions (without outages). The proposed methods have been examined and tested on the IEEE 14-bus system and IEEE 30-14-bus system. Furthermore, a comparison study of the cited algorithms has been made to show the potential of these optimization methods, and prove their robustness and effectiveness in solving the ORPD problem.
In the chapter 04, the ORPD under contingency conditions is discussed. The IEEE 30 bus test system is considered using WOA algorithm. Four different case studies are considered in this chapter to assess the ability of the proposed method for solving complex problems under contingency conditions. Moreover, an approach which is based on FACT devices is proposed as a corrective action scheme in order to withstand the violations caused by the different outages.
In the chapter 05, the ORPD for several scenarios presented previously in chapter 03 and 04, is carried out on a real and practical equivalent 114 bus Algerian power system to give a more practical aspect to our work.
Conclusions and future works are discussed in chapter 06.
0.4 Scientific production
0.4.1 Conference papers
MEDANI Khaled ben Oualid and SAYAH Samir, ''Using a particle swarm optimization for solving
reactive power dispatch problem'', The 9th international conference CEE 2016, Batna, ALGERIA.
MEDANI Khaled ben Oualid and SAYAH Samir, ''Optimal Reactive Power Dispatch using Particle
Swarm Optimization with time varying acceleration coefficients'', The 8th International Conference on
Page -5-
MEDANI Khaled ben Oualid and SAYAH Samir, '' Optimal VAR control under various contingency conditions using whale optimization algorithm, The 2th international conference
IC-AIRES 2018, Tipaza, ALGERIA.
0.4.2 Journal papers
MEDANI Khaled ben Oualid, SAYAH Samir, and Abdelghani Bekrar, "Whale optimization
algorithm based optimal reactive power dispatch: A case study of the Algerian power system", Electric Power Systems Research, Vol: 163, Part B, October 2018, Pages 696-705
0.5 References
[1] Dy Liacco et al., Dy Lia. ’The Adaptive Reliability Control System’’ IEEE Transactions on Power Apparatus and
Systems, PAS-86 (1967), pp. 517- 531.
[2] S.Sakthivel, et al “Optimal Location of SVC for Voltage Stability Enhancement under Contingency Condition
through PSO Algorithm”, International Journal of Computer Applications (0975 – 8887) Vol. 20–,No.1, April
Reactive Power Compensation
Technologies and FACT
Devices
1.1 Introduction ... .07
1.2 Reactive power compensation ... .07
1.3 Var generator technologies ... .08
1.3.1 Traditional Var generators ... .08
1.3.1.1. Capacitors ... .08
1.3.1.2. Inductances ... .08
1.3.1.3. Generators ... .08
1.3.1.4. Synchronous compensators ... .08
1.3.1.5. Static compensators ... .09
1.3.2 FACT devices technology... .09
1.3.2.1. Definition ... .09
1.3.2.2. Role of FACT devices ... .09
1.3.2.3. General classification of these FACT devices... .10
A. Series Controllers ... .10
B. Shunt controllers ... .10
C. Combined Series-Series Controllers ... .11
D. Combined Series-Shunt Controllers ... .11
1.4 FACT devices modeling ... .11
1.4.1 Power injection at the ends of the line ... .11
1.4.2 Creating a fictional bus ... 12
1.4.3 Modification of the admittance matrix ... .13
1.4.4 Choice of devices ... .14
1.4.5. Shunt FACT devices ... .14
1.4.5.1. Integration of the TCSC into the system ... .15
1.4.5.2. SVC placed in the end of line (bus) ... .15
1.4.5.3 SVC placed in the middle of the line ... .16
1.4.6. Series compensation devices ... .18
1.4.6.1. Model of the Thyristor series compensator ... .19
1.4.6.2. Integration of the TCSC into the system ... .19
1.5 Conclusion ... .20
1.6 References ... .20
Abstract:
A general introduction to the Var compensation technologies is presented in this chapter. There are two types of Var generators: traditional devices such as (capacitors, inductors, generators, synchronous compensators, and static compensators), and Flexible Alternating Current Transmission System (FACT) devices which are a combination of power electronics components with traditional power system components. Moreover, tow FACT devices (SVC and TCSC) that were used in this project have been modeled and detailed.
Page -7-
1.1 Introduction
Var compensation is defined as the management of reactive power to improve the performance of AC power systems. The concept of Var compensation embraces a wide and diverse field of both system and customer problems, especially related with power quality issues, since most power quality problems can be attenuated or solved with an adequate control of reactive power [1]. Reactive power compensation in transmission systems improves the stability of the AC systems by increasing the maximum active power that can be transmitted. It also helps to maintain a substantially flat voltage profile at all levels of power transmission, and can avoid disastrous blackouts [2].
Series and shunt Var compensation are used to modify the natural electrical characteristics of AC power systems, while shunt compensation changes the equivalent impedance of the load [1]. In both cases, the reactive power that flows through the system can be effectively controlled improving the performance of the overall ac power system.
Based on the use of reliable high-speed power electronics, powerful analytical tools, advanced control and microcomputer technologies, flexible AC transmission systems FACT have been developed which represent a new concept for the operation of power transmission systems [3]. In order to observe the impact of FACT devices in an electric power system, it is necessary to represent them by models. FACT modeling is carried out on the basis of the elements used in power flow calculations. They are more particularly: generators, loads, shunt elements as well as the lines and the transformers. FACT devices are considered ideal elements and their active losses are not taken into account.
In this chapter a general introduction to reactive power compensation technologies is presented and several models of FACT devices have been detailed.
1.2 Reactive power compensation
The analysis of the variations in the demand of reactive power shows that the problem of supply-demand adaptation has two aspects that require the use of devices whose characteristics are very different [4]:
The first is to follow the periodic fluctuations for loads to a large extent predictable. A large part of the adjustment can therefore be made to Var generators whose action is discontinuous and with a relatively long response time. This category includes capacitor banks and inductors installed on the grid.
Page -8-
The second is to manage with abrupt and random variations. This requires the implementation of Var generators whose response time is very short. This category includes production units, synchronous compensators, static compensators and flexible alternating current transmission systems FACT.
1.3 Var generator technologies
1.3.1. Traditional Var generators 1.3.1.1. Capacitors
Their role is to provide some of the reactive energy consumed by the loads in the network. There are two types:
Bank Capacitor connected to the high voltage load buses of the transmission substations. They are mainly intended to compensate reactive losses on the high voltage grid.
Bank Capacitor connected to medium voltage load buses of distribution substations. These batteries are used to offset the global call for reactive energy from distribution networks to transmission networks. They are localized and sized individually according to the voltage setting.
1.3.1.2. Inductances
They are used to compensate the reactive energy supplied in off-peak hours by very high voltage lines or cables. They are either directly connected to the grid or connected to the tertiaries of the transformers. Therefore, they allow a limitation of over voltages in the network.
1. 3.1.3. Generators
The generators are well located to meet the reactive energy needs. Their dynamic performance allows them to handle with sudden fluctuations in demand. On the other hand, they can only provide partial compensation for the reactive loads, because of the significant voltage drops that reactive energy transits create on the networks.
1. 3.1.4. Synchronous compensators
Synchronous compensators are rotating machines that provide no active power. Reactive power provided or absorbed depending on whether they are under or over excited.
1.3.1.5. Static compensators
They consist of the set of thyristors-controlled capacitors and inductors, mounted upside-down in each phase. Each of them thus being a driver for half a period. The reactive power
Page -9-
absorbed by the inductance varies by controlling the RMS value of the current flowing through it by action on the thyristor firing angle.
1.3.2. FACT devices technology
1.3.2.1. Definition
Flexible Alternating Current Transmission System (FACT) simply refers to a combination of power electronics components with traditional power system components. They are intended to improve power system reliability, power transfer capability, transient and dynamic stability improvements, and voltage regulation.
The important advantages of these FACT controllers include [5]: Improving power transfer capability
Confining power flow to designated routes Transient and dynamic stability improvement Damping of power system oscillations
Better voltage regulation
Flexible operation and control of the system
Secure loading of the transmission lines close to their thermal limits Prevention of cascading outages by contributing to emergency control
1.3.2.2. Role of FACT devices
Based on power electronics converters and digital control schemes, reactive power compensators implemented with self-commutated converters have been developed to compensate not only reactive power, but also voltage regulation, flicker, harmonics, real and reactive power, transmission line impedance, and phase-shift angle. It is important to note, that even though the final effect is to improve power system performance, the control variable in all cases is basically the reactive power.
In an electrical network, the FACT make it possible to perform functions in both steady-state and transient modes. They generally act by absorbing or supplying reactive power, controlling the impedance of the lines or changing the angles of the voltages. In permanent regimes, FACT devices are used primarily in two contexts:
Maintaining the voltage at an acceptable level by supplying reactive power when the load is high and the voltage is too low, however, they absorb it if the voltage is too high.
Page -10-
Control of the power transits so as to reduce or even eliminate the overloads in the lines or the transformers as well as to avoid looping flows in the network. They then act by controlling the reactance of the lines and adjusting the phase shifts.
1.3.2.3. General classification of these FACT devices
FACT devices are classified depending on the technology used in their implementation and the way they are connected to the power system (shunt or series).
They can be classified as follow [6]:
A. Series Controllers
Series controllers are being connected in series with the line as they are meant for injecting voltage in series with the line. These devices could be variable impedances like capacitor, reactor or power electronics based variable source of main frequency, sub synchronous or harmonic frequency, or can be a combination of these, to meet the requirements. If the injected voltage is in phase quadrature with the line current, then only supply or consumption of variable reactive power is possible. These types of controllers include:
SSSC: Static synchronous series compensator TCSC: Thyristor controlled series capacitor TCSR: Thyristor controlled series reactor TSSC: Thyristor switched series capacitor TSSR: Thyristor switched series reactor
B. Shunt controllers
Shunt controllers will be connected in shunt with the line so as to inject current into the system at the point of connection. They can also be variable impedance, variable source, or a combination of these.
If the injected line current is in quadrature with the line voltage, variable reactive power supply or consumption could be achieved. But any other phase relationship could involve real power handling as well. This category includes STATCOM (Static synchronous compensator) and SVC (Static Var compensator).
The common Static VAR compensators are: TCR: Thyristor controlled reactor
TSR: Thyristor switched reactor TSC: Thyristor switched capacitor
Page -11-
C. Combined Series-Series Controllers
This category comprises of separate series controllers controlled in a coordinated manner in the case of a multiline transmission system. It can be also unified controller in which the series controllers perform the reactive power compensation in each line independently whereas they facilitates real power exchange between the lines via the common DC link because, in unified series-series controllers like Interline Power Flow Controller (IPFC), the DC terminals of the controller converters are all connected together.
D. Combined Series-Shunt Controllers
It is a combination of separate series and shunt controllers, being operated in a coordinated manner. Hence, they are capable of injecting current into the line using the shunt part and injecting series voltage with the series part of the respective controller.
If they are unified, there can be real power exchange between the shunt and series controllers via the common DC power link, as in the case of Unified Power Flow Controllers (UPFC).
1.4 FACT devices modeling
FACT modeling consists of representing devices under certain assumptions and in a selected frequency domain. The developed models are then integrated into calculation programs so that they can simulate their effects throughout the system.
Different ways of modeling FACT devices have been developed for the study of stationary regimes. They are differentiated mainly by the method used to integrate the FACT in the calculation of the load flow. The three novelizations encountered most often in the literature are respectively based on the injection of equivalent power, the creation of a fictitious bus or the modification of the admittance matrix. These three techniques are presented in the following paragraphs.
1.4.1. Power injection at the ends of the line
One of the most common methods is to represent the devices FACT as power injections at the buses as shown in Figure.1.1.
The reactive power of FACT device will be injected on the line as shown by Fig1.1.a, and by injecting of power to both extremities Fig1.1.b. [7]. Active and reactive power Injections at bus i are given by:
Page -12-
Fig.1.1. Power injection modeling: a) line with FACT, b) line with equivalent injections.
(1.1)
(1.2)
Where : , are active and reactive power of FACT devices injected in bus i, are injected active and reactive power at bus i and are active and reactive power considering FACT in the line.
The variations of this modeling have been proposed in [8], the model of injecting of decomposed power is proposed. The effects of FACT on the power transits in the lines and those on the control of the voltages at the buses are treated separately.
1.4.2 Creating a fictional bus
FACT modeling based on the creation of a fictional node is presented in [9].The model of UPFC-type device, allowing the control of active and reactive power transits, is shown in
Fig.1.2.
Fig.1.2. Modeling with fictitious node: a) line with FACT, b) equivalent representation.
The set points of the devices are directly expressed in terms of power flow in the lines or injected at the buses Fig.1.2.a. To maintain the power balance, the power injected at bus j is subtracted from that injected at bus i as shown Fig.1.2.b. The new bus is taken into account
Page -13-
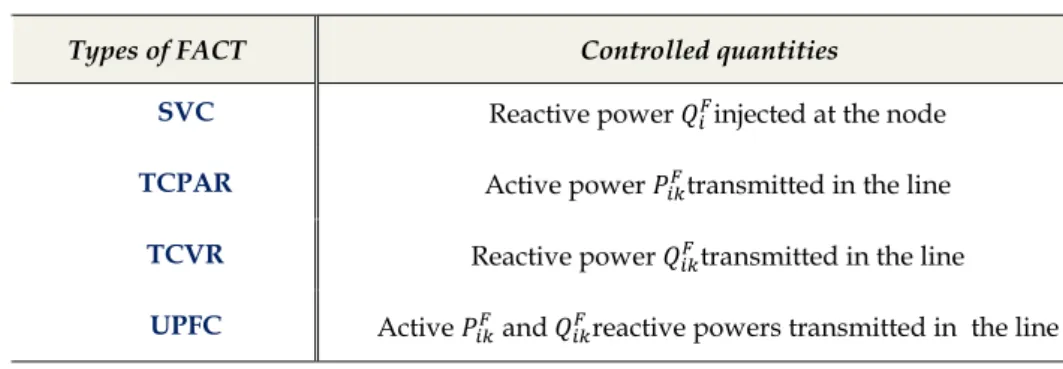
in the power distribution calculation by modifying the structure of the Jacobian matrix. The corresponding controlled quantities are summarized in Table 2.1.
Table 2.1. FACT types that can be modeled by creating a fictional node
Types of FACT Controlled quantities
SVC Reactive power injected at the node
TCPAR Active power transmitted in the line
TCVR Reactive power transmitted in the line
UPFC Active and reactive powers transmitted in the line
In [10], control of FACT devices is performed by the calculation of optimal power distribution. The FACT set points are calculated to optimize an objective function.
1.4.3 Modification of the admittance matrix
FACT devices are envisaged as elements that directly modify the nodal admittance matrix of the grid [11].They are inserted in the line according to the representation of Fig.1.3. Depending on the type of FACT model, the device can be placed in the middle or at the end of the line.
Fig.1.3. Integration of FACT device in transmission line.
The parameters of an equivalent transmission line including FACT devices are presented in (1.3) ( ) ( ) ( ) (1.3)
Where : is the admittance of line after compensation. is the admittance of line before adding FACT. is the admittance of line after adding FACT, is the admittance of FACT device. i and k are buses.
Page -14-
Depending on the type of FACT and its position in the line, only part of the parameters of the matrix Y gets modifications.
Different methods are possible to process the values of the devices. They can be used as input quantities in a conventional load flow or as variables to be optimized in an optimal power flow calculation [12].
1.4.4. Choice of devices
The FACT devices are chosen so that they can act on the three parameters governing the transits of powers in a network. In this perspective, the modeled FACT devices are as follows:
Reactive power compensator
Thyristor series compensators
The unified power transit controller
In general, FACT devices can be inserted either at the nodes of the network, or in series with the lines. In practice, devices whether shunt or series are often inserted at existing stations. Although sometimes this position is not the best, it is justifiable by reducing costs by avoiding the creation of a new position.
1.4.5 Shunt FACT devices
The modeled shunt FACT devices are static compensators of reactive power such as SVC and other derivatives (TCR, TSC). Although they perform lesser than the synchronous static compensator, they are hardly important in steady state.
1.4.5.1. Model of the reactive power static compensator
The static reactive power compensator is modeled by as shunt variable admittance
Fig.1.4.a. Since the power loss of SVC is assumed negligible, so the admittance is assumed
purely imaginary:
(1.4)
Where: is the admittance of the devices SVC. in the susceptance of SVC.
The susceptance may be capacitive or inductive in nature to provide, or to absorb the reactive power Fig.1.4.b. The SVC values are expressed as the reactive power absorbed at the nominal voltage is given by the equation:
Page -15-
Fig.1.4 Modeling of SVC: a) symbol, b) model.
The negative sign indicates that SVC provides reactive power to the system when it is capacitive, and consumes it, when it is inductive. The variation of the reactive power injected as a function of voltage is shown in Fig.1.5 for multiple compensation values.
Fig.1.5 Variation of the reactive power absorbed by a SVC versus the voltage at bus i.
As already mentioned, FACT facilities are generally located in already existing stations. However, both cases are taken into consideration; namely when the SVC is placed at the end of the line and when it is located in the middle of the line.
1.4.5.2. SVC placed at the end of line (bus)
When connected to buses in the grid, SVCs are typically placed where there are large or highly variable loads. They can also be positioned at buses where the generator fails to provide or absorb enough reactive power to maintain the desired voltage level. Fig.1.6 illustrates the case of a SVC placed at bus i.
Page -16- Fig.1.6 SVC placed at bus.
When SVC is present at the bus i, only the element Yii of the nodal admittance matrix is
modified, the admittance of the SVC is as follow:
′
(
2
2
)
(1.6)1.4.5.3 SVC placed in the middle of the line
When the static compensator is inserted in the middle of a line, the line is divided into two identical sections. The SVC is connected to the additional median bus m, as shown in
Fig1.7. In order to accommodate this new bus, an additional row and column should be
added to the nodal admittance matrix. To avoid having to change the number of buses of the grid and thus the size of the admittance matrix, a star-delta transformation makes it possible to reduce the system by removing the bus m and by calculating the parameters of an equivalent line. Fig1.8 illustrates the steps to obtain this equivalent line.
Fig.1.7 SVC placed in the middle of the line
/2
/2
/2
/2
Page -17-
Fig.1.8 Transformation into an equivalent line with a SVC in the middle
All elements of the admittance matrix of a line with an SVC in its middle are modified:
(
′
′
2
′
′
′
′
2 )
(1.7)The actual values of the elements of the equivalent line are obtained imposing:
2
(1.8)
It then comes for longitudinal impedance:
𝑧′
4
4
21
4
2𝑧
1
4
𝑧 22
(1.9)𝑟′
𝑟
1
2
𝑟
𝑥
2
(1.10)𝑥′
𝑥
1
4
𝑟 2 𝑥 2
2
(1.11)It then comes for longitudinal impedance:
′
2
4
2
4
4
2
2
1
2 𝑧
2
(1.12) /2 /2Page -18- ′ 2 1 2 𝑟 ( 2 ) 4 2 𝑥 ( 2 ) 14 𝑟 2 𝑥 2 ( 2 ) (1.13) ′ 2 4 2 ( 2 ) 12 𝑥 ( 2 ) 4 2 𝑥 ( 2 ) 14 𝑟 2 𝑥 2 ( 2 ) (1.14)
Fig1.9 illustrates the variation of the parameters of an equivalent line with an SVC in the
middle of line. It highlights that the shunt susceptance is the element that is most affected by the presence of the compensator. Its value, expressed in p.u, is practically equal to that of the SVC. In other words, a mid-line SVC has almost the same effect as two SVCs positioned at both ends of the line.
The value of ′ being very low, it can be negligible, and the model of the equivalent line is similar to that used for lines without SVC.
Fig.1.9. Parameters of an equivalent line with SVC in the middle
1.4.6. Series compensation devices
The modeled series compensation devices are Thyristor series compensators (TCSC, GCSC or TSSC). They modify the apparent impedance of the line by inserting reactive elements in series.
The SSSC has higher performance than the devices mentioned above. However, its representation does not seem possible with the methodology adopted to model the FACT devices. Indeed, the compensation achieved by this element is done by inserting a voltage in series in the line which is in quadrature with the current flowing there. It is therefore
Page -19-
necessary to know the value of the current to be able to adjust the phase of the voltage to be inserted. This requires an iterative process.
1.4.6.1. Model of the Thyristor series compensator
The Thyristor series compensators used may be capacitive or inductive in nature. They are therefore similar to TCSC devices type. They are modeled by variable impedances inserted in series with the line as shown in Fig.1.10.a. Since the devices are considered ideal, only the reactive part of the impedance is taken into account. The model is formed of two parallel branches formed respectively of an inductance and a variable capacitance. To avoid resonance phenomena, the branches are exclusively engaged by means of a switch as illustrated Fig1.10.b. The value of the reactance of the TCSC is therefore given by:
𝑥 𝑥 (1.15)
The maximum compensation degrees are 80% in capacitive mode and 20% in inductive mode [13]:
2 (1.16)
Fig.1.10 TCSC modeling: a) general model b) model.
1.4.6.2. Integration of the TCSC into the system
When a TCSC is placed in a line connecting the nodes i and k, it is directly integrated in the π diagram of the line according to the model of Fig.1.11.
Page -20-
The effective reactance of the line is:
𝑥′ 𝑥 𝑥 (1.17)
The matrix admittance of the line is modified as follows:
(
′
2
′
′
′
′
2 )
(1.18)1
𝑟
𝑥
𝑥
(1.19)Where:
𝑥 is the reactance of TCSC. 𝑥 is the reactance of line between buses i and k before adding the TCSC. 𝑥′ is the reactance of line between buses i and k after adding the TCSC.1.5 Conclusion
Reactive power compensation is very important to be tackled , it is a factor that limitates the power transited in the transmission lines. Equipment based on power electronics, including their appropriate controls, offer effective solutions to this problem.
FACT systems have the ability to improve transient stability by using an appropriate command. They can also control the transmittable power of the line using three methods: serie compensation, shunt compensation and hybrid compensation.
In this chapter, reactive energy compensation technologies in power grid has been presented as well as FACT systems. The two FACT devices (SVC and TCSC) that will be used in this project have been modeled and detailed
1.6 References
[1] T. J. Miller, Reactive Power Control in Electric Systems. New York: Wiley, 1982.
[2] C. W. Taylor, “Improving grid behavior,” IEEE Spectr., vol. 36, no. 6, pp. 40–45, Jun. 1999.
[3] R. Grünbaum, Å. Petersson, and B. Thorvaldsson, “FACT, improving the performance of electrical grids,”
ABB Rev., pp. 11–18,Mar. 2003.
[4] A. Edris, “FACT technology development: An update,” IEEE Power Eng. Rev., vol. 20, no. 3, pp. 4–9, Mar.
2000.
[5] N. Hingorani and L. Gyugyi, Understanding FACT, Concepts and Technology of Flexible ac Transmission
Systems. New York: IEEE Press, 2000.
[6] R. Grünbaum, M. Halonen, and S. Rudin, “Power factor, ABB static var compensator stabilizes Namibian
Page -21-
[7] S.N. Singh and A.K. David. Congestion Management by Optimizing FACT Devices Location. Conference on
Electric Utility Deregulation and Restructuring and Power Technologies, pp.23-28, April 4-7 2000.
[8] Y. Xiao, Y.H. Song, and Y.Z. Sun. Power Injection Method and Linear Programming for FACT Control.
Power Engineering Society Winter Meeting, 2, pp.877-884, 2000
[9] D.J. Gotham and G.T. Heydt. Power Flow Control and Power Flow Studies for Systems with FACT Deviees.
IEEE Trans. Power Systems, 13(1), pp.60-65, February 1998.
[10] B.T. Ooi, M. Kazerani, R. Marceau, Z. Wolanski, F.D. Galiana, D. McGillis, and G. Joos. Mid-Point Siting of
FACT Devices in Transmission Lines. IEEE Trans. Power Delivery, 12(4), pp.1717-1722, October 1997.
[11] P. Preedavichit and S.C. Srivastava. Optimal Reactive Power Dispatch Considering FACT Devices. Electric
Power System Research, 46(3), pp.251-257, September 1998.
[12] X. Duan, J. Chen, F. Peng, Y. Luo, and H.Huang. Power Flow Control with FACT Deviees. Power
Engineering Society Summer Meeting, 3, pp.1585-1589, 2000.
Comprehensive Review of ORPD:
Objectives, Constraints, and
Metaheuristic Optimization
Strategies
2.1 Introduction ... .23 2.2 Objective function models on ORPD ... .25
2.2.1 Minimize Real power loss ... .25 2.2.2 Minimize load voltage deviation TVD ... .25 2.2.3 Maximize voltage stability index ... .26 2.2.4Minimize VAR cost ... 27 2.2.5Minimization of Fuel cost ... 27 2.2.6Multi-objective function ... 27
2.3 Constraintmodels on ORPD ... .29
2.3.1 Equality Constraints ... .29 2.3.2 Inequality Constraints ... .29
2.4 Metaheuristic algorithms employed for ORPD problem ... .31
2.4.1 Evolutionary-Based Algorithms... .31 2.4.2 Swarm Intelligence Algorithms ... .33 2.4.3 Algorithms Based on Physical Phenomena ... .36 2.4.4 Human behavior based algorithms ... .37
2.5 Comparative study ... .39 2.6 Conclusion ... .41 2.7 References ... .42
Abstract:
The motto of studying the optimal reactive power dispatch (ORPD) is the streamline of the management of additional reactive power sources that should be installed in the network. This chapter will firstly provide a comprehensive review of several possible objective functions used to solve the ORPD. The objective functions may be considered for a security aspect which can be implemented as a minimization of real power loss, minimization of voltage deviation and maximization of voltage stability index. On the other hand, it can be taken into account as a cost functions, which are generally implemented as VAR or/and fuel cost, or even a combination of different objectives as a multi-objective model. Secondly, a review of different constraints in ORPD is detailed in this part, where equality and inequality constraints as well as penalty constraints considerations handled by different research studies are reported. Thirdly, a comprehensive review on application of meta-heuristic optimization algorithms for the solution of ORPD problem is provided, taking into account the objective functions and different constraint models. The literature review is based on papers published in several journals. The meta-heuristic optimization-based models were categorized into four main categories: evolution-based, swarm-based, physics-based, and human behavior-based methods. For each category, the most popular optimization techniques are discussed. Finally, it was found that advanced meta-heuristic methods as well as combinational hybrid methods are most suitable and successful to solve ORPD problems.