O
pen
A
rchive
T
OULOUSE
A
rchive
O
uverte (
OATAO
)
OATAO is an open access repository that collects the work of Toulouse researchers and
makes it freely available over the web where possible.
This is an author-deposited version published in :
http://oatao.univ-toulouse.fr/
Eprints ID : 13057
To link to this article : DOI :10.7551/978-0-262-32621-6-ch087
URL :
http://dx.doi.org/10.7551/978-0-262-32621-6-ch087
To cite this version : Disset, Jean and Cussat-Blanc, Sylvain and
Duthen, Yves
Self-organization of Symbiotic Multicellular Structures
.
(2014) In: the Fourteenth International Conference on the Synthesis
and Simulation of Living Systems - ALIFE 2014, 30 July 2014 - 2
August 2014 (New York, United States).
Any correspondance concerning this service should be sent to the repository
administrator:
[email protected]
Self-organization of Symbiotic Multicellular Structures
Jean Disset
1, Sylvain Cussat-Blanc
1and Yves Duthen
11University of Toulouse, IRIT - CNRS UMR 5505, 2 rue du Doyen Gabriel Marty, 31042 Toulouse, France
Abstract
This paper presents a new model for the development of artifi-cial creatures from a single cell. The model aims at providing a more biologically plausible abstraction of the morphogen-esis and the specialization process, which the organogene-sis follows. It is built upon three main elements: a cellular physics system that simulates division and intercellular ad-hesion dynamics, a simplified cell cycle offering to the cells the possibility to select actions such as division, quiescence, differentiation or apoptosis and, finally, a cell specialization mechanism quantifying the ability to perform different func-tions. An evolved artificial gene regulatory network is em-ployed as a cell controller. As a proof-of-concept, we present two experiments where the morphology of a multicellular or-ganism is guided by cell weaknesses and efficiency at per-forming different functions under environmental stress.
Introduction
In nature, the cellular specialization (or differentiation) pro-cess allowing a single celled organism to grow organs of various shapes and functions is a key mechanism in the de-velopment of complex morphologies, behaviors and opmental strategies. Over the past few years, many devel-opmental models have been designed to simulate the growth of virtual multicellular organisms. They have been dealing with different levels of biological realism that directly im-pact on the complexity and the computational cost of the model. From the cellular automata in the 1960s (Von Neu-mann et al., 1966) and its offspring (Gardner, 1970; De Garis et al., 1999; Chavoya and Duthen, 2008) to today’s mod-els (Hotz, 2004; Joachimczak and Wr´obel, 2008; Doursat, 2009; Cussat-Blanc et al., 2012a), this field of research evolved by getting closer to the biological reality. How-ever, though cell differentiation was frequently explored (e.g. French flag problem), the models used evolutionary algorithms guided by an exogenous engineered fitness func-tion describing a predefined morphology.
In the last decades, some cell development models also explored the creation of multicellular organisms which would be evaluated not directly in regard with their morphol-ogy but in terms of capability to fulfill a certain function.
Co-evolution of morphology and control system showed in-teresting results, using global control methods such as neu-ral networks in order to, for example, push a block (Bon-gard and Pfeifer, 2003), or using an artificial gene regula-tory network to locally contract cells and swim, such as what Joachimczak et al. did, using a two phase development and explicitly forcing animats to stop growing through fitness function (Joachimczak and Wrobel, 2012) or such as what Schramm did with, however, a subobjective of the evolution being an explicit shape description (Schramm et al., 2011).
The work presented in this paper offers to investigate the emergence of morphologies, developmental capabilities and behaviors of a multicellular simulation. Contrary to many other models (previously cited), this system does not rely on any global controller nor has to enforce any particular differ-entiation pattern or morphology through a fitness function, but has to find developmental strategies to adapt to and to compose with a hostile environment as well as a more bio-logically plausible specialization process.
We present a developmental model (named SOMAS, for Self-Organizing Multicellular Artificial Systems) in which cells embed a simplified simulation of a cell cycle regu-lated by an artificial gene regulatory network. Thus, cells are given the possibility to divide, to specialize, to stay in a quiescent state or to commit apoptosis. Moreover, a mass-spring-damper system simulates the cell mechanics with in-tercellular collisions and adhesions, and a simplified artifi-cial chemistry is used for both nutrient transformation into energy and morphogen diffusion. The organisms develop from one stem cell and an evolutionary algorithm is used in order to select the ones that succeed in developing in a hostile environment. One of the main goals of the model is to present a simple but efficient way to bring biologi-cal plausibility to the specialization process. Our work is based on the idea that the specialization process of biolog-ical cells selects characteristics to develop while other do-mains are abandoned. The interesting side effect of such process is the need for cellular cooperation through the cre-ation of interdependent functional organs. In our model, we quantify specialization states in terms of weaknesses and
ef-ficiency in realizing simple tasks (to transform nutrients into energy, to store energy, to resist to environmental stresses). We thus try to avoid the creation of omnipotent specializa-tion states and instead create a ”meaningful” differentiaspecializa-tion process which abstracts the underlying physical realities of in-vivo cell specialization. This, with the conjunction of a very simple fitness function which only takes the time of survival into account, could make for the emergence of de-velopmental strategies that are not explicitly described but instead result from the intrinsic strengths and weaknesses of specialization states (which can be dictated by the physical realities of the considered cellular units) together with envi-ronmental constraints.
The paper is organized as follows: next section details our model through the morphogens, nutrients and energy management, the cells capacities, physics and controller and the genetic algorithm used to optimize the gene regulatory network of the cells. Third section presents two proof-of-concept experiments that shows the capacity of the model to come with different strategies by only using the surviving duration of the organism as fitness function. Finally, the pa-per concludes on possible extensions and future expa-periments that our model is expected to tackle.
Model
SOMAS is designed to provide some bio-inspired capabili-ties to the cells. In particular, we focused on the following three main components: an artificial chemistry providing the cells with the ability to interact and to produce energy, a
cell physicsmodel that simulates the collision and adhesion mechanisms and a cell cycle abstraction with the possibil-ity to specialize into different cellular states, controlled by a
gene regulatory network.
Artificial chemistry
The chemistry is here aimed toward two main goals. First, the diffusion of morphogens in the environment is used by the cells in order to communicate and gain, for example, positional informations. Secondly, it provides the cells with the basics for energy management. Both aspects are detailed in the following paragraphs.
Morphogens Morphogens are signaling molecules pro-duced by cells. They play an essential role in embryoge-nesis. Often produced from a localized source, the mor-phogen concentration gradient helps cells to localize them-selves and trigger cell specialization. We use a simplified morphogen diffusion system based on a grid in which cells inject and sense morphogens concentrations level. An arti-ficial gene regulatory network described hereafter and em-bedded in each cell governs the morphogen production rate. A morphogen is characterized by its attenuation speed (from which can be deduced its range) and its evaporation rate. At each time step, morphogen levels are updated on the
morphogen grid: their concentration are first decreased ac-cording to their evaporation rate, before being diffused to the neighboring grid cells. When a grid’s cell diffuses its con-centration to its surrounding, the neighbors receive its mor-phogen concentration multiplied by the attenuation speed of the morphogen. The morphogen concentration Cireceived
by a grid cell i from a neighboring source of morphogen with a concentration of CSis thus equals to:
Ci= CS∗ (1 − Rm∗ d(i, S))
with Rm∈ [0, 1] the attenuation speed of morphogen m and
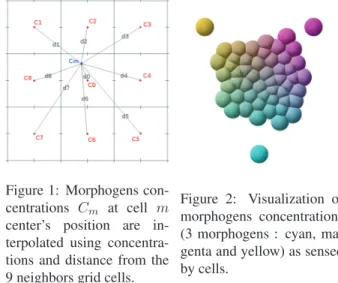
d(i, S) the distance between the centers of cells i and S. A morphogen grid cell concentration always keeps the maximum concentration value offered (which either directly comes from a cell placed on it or from the diffusion of its neighbors grid cells). When a cell senses the morphogen concentration for its position, the morphogen grid computes and returns the average concentration of the 9 nearest grid’s cells centers weighted by their distance to said position. The same interpolation process is used when the cell diffuses its morphogens into the grid cells. With grid cells in the same order of size as the cells, this system allows for “smooth enough” morphogens gradient (as can be seen in figure 3) formation without the algorithmic complexity of a purely continuous model. Morphogen concentration Cm at
posi-tion m is thus equals to:
Cm= P8 i=0 Ci di P8 i=0d(i,m)1
with Ci the morphogen concentration in grid cell i and
d(i, m) the distance between m and cell i center’s position. Figure 1 depicts this morphogen concentration computation. In figures 2 and 3, three morphogens are produced by dif-ferent cells. Their concentrations are mapped to the cyan,
Figure 1: Morphogens con-centrations Cm at cell m
center’s position are in-terpolated using concentra-tions and distance from the 9 neighbors grid cells.
Figure 2: Visualization of morphogens concentrations (3 morphogens : cyan, ma-genta and yellow) as sensed by cells.
magenta and yellow colors. Figure 2 shows a visualization of the morphogen concentrations inside each cell (only the outer three cells are producing morphogens) and the figure 3 shows the morphogen concentrations on the grid. Note that the morphogen concentration levels are not cumulative: if two cells produce the same amount of a same morphogen in the same place, the morphogen concentration level will be as high as if there was only one cell. This non-cumulative dif-fusion system presents similarities with Doursat’s (Doursat, 2009). It has been proven to be efficient and precise enough for virtual embryogenesis.
Nutrients, ambrosia and energy Cell consume energy to perform different actions: division, apoptosis, quiescence or specialization. Division is, for example, a very costly operation whereas quiescence is a sleeping state where the cell consumes less energy. The energy level is coded as a floating-point number between 0 and 1 in each cell. When a cell’s energy level reaches 0, it dies. The average energy consumption per time step being in the order of magnitude of 0.1, pure energy storage is not efficient and, in order to survive, cells must produce energy at a steady pace. How-ever, this energy cannot be shared nor stored.
Therefore, another form of energy is introduced:
am-brosia. It is a special “molecule” which can be stored and diffused. Ambrosia can be turned into pure usable energy without loss. This molecule is thus to be compared with glucose or lipid in its energy storage purpose. Ambrosia dif-fusion is done from one cell to its direct neighbors (cells that have direct adhesive contact) with a certain efficiency, defined by the diffusing cell’s specialization state.
Again, this ambrosia cannot be produced out of nothing, and this is where nutrients are needed. They are the raw components at the root of the energy chain. Cells can trans-form nutrients into ambrosia and their efficiency in doing so, which is crucial to them, is also described in the cell’s
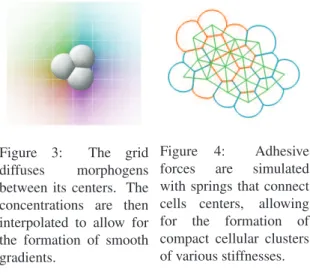
spe-Figure 3: The grid diffuses morphogens between its centers. The concentrations are then interpolated to allow for the formation of smooth gradients.
Figure 4: Adhesive forces are simulated with springs that connect cells centers, allowing for the formation of compact cellular clusters of various stiffnesses.
cialization state. Nutrients are available in the environment and their concentrations are encoded on a grid. The resolu-tion of this grid, as well as the nutrients level and nutrient regeneration rate can be changed in order to produce differ-ent energy related constraints. These constraints, under the use of genetic algorithm, will add various selective pressure to the competing virtual organisms. They are thus different according to the experiment the model will be used for.
Cell physics
Using a precise mechanical engine (close to biological real-ity) that simulates soft bodies physics allows us to increase the capabilities of the organisms. However, the computa-tional cost needs to remain acceptable. Therefore, the cells physics are based on a mass-spring-damper system. A cell is represented by its mass, radius, stiffness and center posi-tion. Contrary to most of existing models (Doursat, 2009; Joachimczak and Wr´obel, 2008), cells are not necessarily clustered in one multicellular organism: the mass-spring-damper system is only used to keep the organism consistent by handling the collisions and the inter-cell adhesions. Collisions The simulated world in which the cells act al-lows them to move freely, rotating, colliding and bouncing off each other. When two cells are penetrating each other - the distance between their two centers is smaller than the sum of their radii - a collision spring is created between their centers. Its length is equal to the sum of the two cells’ radii and its stiffness is defined as the cells’ mean stiffness. Col-lision springs are destroyed when their length is greater than the sum of the two cells radii they are connected to. Adhesions Cellular adhesion is crucial for the cohesion of tissues. When two cells get close enough from each other - this activation threshold distance is defined by the spe-cialization state - an adhesion spring is created between the two cell’s centers. Its length is defined as being the mean radius of the two cells and its stiffness is the mean adhe-sion strength, also defined by the specialization state of both cells. Figure 4 shows the adhesive forces that allow for the formation of a compact cluster of cells.
Cell actions
Cells are able to perform four main actions, designed after the possible actions and transformations a real living cell can undergo: division, apoptosis, quiescence and specialization. The division is a cellular action of prime importance, as it is the main mechanism behind organ growth. If the ex-act replication of the mitosis process is not necessary, it is however important to be able to reproduce the external man-ifestations of division. In this model, a cell can only begin division if it has enough energy and if the membrane pres-sure is not too high. The cell then grows to double its size (the collision-spring triggering distance increases). The di-vision axis is chosen according to the compression forces the
cell experiences: it will divide perpendicularly to the most compressed axis. When actual division occurs, a clone cell of initial size is created, and energy and nutrients are split in two equal parts.
The apoptosis is the programmed “clean” death of a cell. All of its nutrients are diffused to the neighbors and the cell is deleted from the environment.
When a cell enters quiescence, it cannot choose to begin another cellular action for a certain number of decision steps and its energy consumption is reduced.
Cell specializationis one of the key mechanisms behind the formation of organs in living organisms and is also at the heart of this work. Specializing cells progressively mod-ify their properties in order to better fulfill certain functions, thus becoming differentiated cells. This specialization pro-cess is here represented by the walk through a tree structure in which every node contains a set of values to be assigned to the cell’s properties. Once a cell reaches a certain node, which we call specialization state, it cannot go back to a pre-vious state and the cell’s attributes values are replaced with the ones described by the new specialization state. Such a state contains information about three main aspects: (1) the
physical properties(biomass, size, global stifness and adhe-sion) of the cell; (2) the controller (the subpart of the artifi-cial gene regulatory network to be used, this mechanism be-ing meant to mimic the way a differentiated cell would only express a subpart of its genome); (3) the skill values of the cells that describe its efficiency in performing various tasks, such as using a certain type of nutrients to produce energy or being able to withstand the impact of harmful particles from the environment. This final concept is crucial to the exper-iments presented hereafter and will be described with more details later on.
As in nature, these actions, among other internal regula-tions, are regulated according to an artificial gene regulatory network.
Specialization tree
At the heart of the experiments presented in the next section is the concept of “skills design”, or the quantification of effi-ciency for cells from different specialization states to fulfill certain functions. The general idea, inspired by the observa-tion of living multicellular organisms, is that cells cannot be omnipotent, i.e. they cannot do everything with “full” effi-ciency. Cell specialization is thus always a matter of getting better at doing something and letting other important func-tions aside. To survive in a complex environment, the cells then have to cooperate and organize so that they optimally use their capacities.
In our model, we implemented this idea with the reparti-tion of a fixed number of skill “points” to distribute between various functions. In the particular case of the experiment presented in the paper, they are the ambrosia production, which is the ability to retrieve nutrients from the
environ-ment and turn them into ambrosia, the diffusion efficiency, which quantifies the ability to diffuse ambrosia to nearby cells, the energy efficiency (the more developed this compe-tence, the less energy the cell consumes at each time step), the ambrosia capacity, which quantifies the ability to store a large amount of ambrosia and the stress resistance, which is the ability to withstand aggression from the environment (in the experiments presented hereafter, environmental aggres-sions are represented by particles of various intensities).
Specialization states are thus crafted by distributing skill points into characteristics. Once the balance in the influence of those skill points is carefully established, specialization trees can be described in both their topology and in the skill points distribution for each of their specialization state. In this work, the trees are hand-crafted but they are ultimately meant to be part of the virtual creature’s DNA, subjected to evolution.
Gene regulation
In nature, a gene regulatory network is a network of pro-teins. The cascading interactions between these proteins control genome expression by the use of external signals collected from protein sensors localized on the membrane (Davidson, 2006). These signals activate or inhibit the tran-scription of the genes, which then determines the cell’s be-havior. Here, we use an artificial gene regulatory network which is a simplified computational model inspired by its bi-ological counterpart. This kind of controller has been used in many developmental models of the literature (Bongard and Pfeifer, 2003; Hotz, 2004; Flann et al., 2005; Knabe et al., 2008; Joachimczak and Wr´obel, 2008; Doursat, 2009; Cussat-Blanc et al., 2012a) and to control virtual and real robots (Nicolau et al., 2010; Joachimczak and Wr´obel, 2010; Cussat-Blanc et al., 2012b).
Dynamics The artificial Gene Regulatory Network (GRN) used in this model is based on Cussat-Blanc’s model (Cussat-Blanc et al., 2012b). It is however modified in or-der to allow for a better precision by using continuous tags. Moreover, all the protein concentrations are clamped be-tween 0 and 1, allowing their absolute concentration values to be directly used without need of comparing them to each other. A gene regulatory network is therefore defined as a set of interacting proteins defined by three tags, coded as floating-point numbers between 0 and 1, and a type. The
protein tagdescribes the proteins themselves. The enhancer
tagis compared to the protein tags of other proteins to com-pute the enhancing matching factor between two proteins. The inhibitor tag is used as the enhancer tag to calculate the inhibiting matching factor between two proteins. Finally, the protein type determines if the protein is an input pro-tein, whose concentration is given by the environment of the GRN and which regulates other proteins but is not regulated, an output protein, whose concentration is used as an output
of the network and which is regulated but does not regulate other proteins, or a regulatory protein, an internal protein that regulates and is regulated by other proteins.
The dynamics of the GRN are calculated as follows. First, the affinity of a protein a with another protein b is given by the enhancing factor u+ab = |enha− idb| and the inhibiting
u−
ab= |inha− idb| (where idxis the protein tag, enhxis the
enhancer tag and inhxis the inhibitor tag of protein x).
Then, the proteins are compared two by two using the en-hancing and the inhibiting matching factors. For each pro-tein of the network, the global enhancing and inhibiting val-ues are given by the following equations:
gi= 1 N N X j cjeβ(u + ij−u+max) ; h i= 1 N N X j cjeβ(u − ij−u−max) (1) where gi(resp. hi) is the enhancing (resp. inhibiting) value
for a protein i, N is the number of proteins in the network, cjis the concentration of protein j and u+max(resp. u−max) is
the maximum enhancing (resp. inhibiting) matching factor observed. β is a control parameter that set up the “usable” distance between the proteins.
The final modification of protein i’s concentration is given by the following differential equation:
dci
dt = δ(gi− hi) (2) Where δ sets up the speed of reaction of the regulatory net-work: the higher, the more sudden the transitions in the GRN; the lower, the smoother the transitions.
Cell behavior regulation The inputs proteins are con-nected to both the surrounding of the cell and its internal state. In order to allow behavior to change according to the specialization state, each of these inputs are duplicated for each possible state but only one set per differentiation state is activated at a time, the GRN thus being fed with the same input data but from different input proteins. These data are the concentration in each morphogen, the membrane
pres-sure, the energy level of the cell, the ambrosia quantity di-vided by the maximum ambrosia storage capacity of the cell and the nutrients concentration in the environment.
The outputs of the GRN are the following: one protein per cell action (quiescence, apoptosis, division or specializa-tion): the action with the highest output protein concentra-tion is chosen and, in case of specializaconcentra-tion, the protein with the highest concentration among all the “specialization” out-put proteins will determine the state the cell must specialize into; one protein for each morphogen, which concentration level directly gives the cells morphogen production; one pro-tein to decide the proportion of ambrosia to be transformed into energy, and therefore allows the cell to choose between storing ambrosia or refilling its energy level; one protein that gives the proportion of ambrosia to be diffused to nearby
cells; another protein giving the amount of nutrients a cell should transform into ambrosia, relatively to the maximum consumption capabilities of the cell (defined by its current type) and limited by the environment resources.
When an action is triggered, the GRN powered decision system is locked until the end of the action (e.g. cells can-not trigger apoptosis while they are dividing). However, all other systems (morphogen production, ambrosia trans-formation and diffusion, etc.) are maintained and the GRN still controls the corresponding outputs.
Genetic algorithm
This model is meant to be optimized by a genetic algorithm. A standard genetic algorithm is used with a crossover that crosses two GRN protein sets and a mutation operator that can equiprobably randomly modify a tag, add a new regula-tory protein or delete a regularegula-tory protein.
As we stated in the introduction of this paper, the aim of this work is also to avoid designing a fitness function that would directly guide the organogenesis process. We want morphological complexity to emerge from the differences in specialization states and the need for cells to survive as long as possible in a hostile environment. Each growing organ-ism is thus only evaluated by its survival time, in simulation steps, the longer the better.
Experiments
As a proof-of-concept and as a first step toward more com-plex experiments on organogenesis, we developed two envi-ronments with two different kinds of constraints. The aim is to show the capacity of the model to produce organized developmental strategies without explicit morphology spec-ification hard-coded in the fitness function. The first exper-iment presented in this paper consists in studying the spe-cialization and auto-organization capacity of cells attacked by harmful particles. The second one adds complexity by constraining the energy of the environment.
First experiment: surviving aggressions
The first of these two experiments takes place in a hostile en-vironment where dangerous particles are aimed toward the center, which is where the first cell appears. We can draw an analogy between this scenario and radiations that would destroy unprepared cells. In a more general way, these par-ticles are a metaphor of any punctual stress that living mul-ticellular organisms need to face while developing.
Initial conditions For this first experiment, we manually set up a specialization tree with only two states: the
nutri-tive stateand the defensive state. Specialization can only occur from the nutritive state to the defensive state and the first cell of the organism is nutritive. The nutritive state is characterized by its ability to produce energy and ambrosia together with a lack of defense against particles. In direct
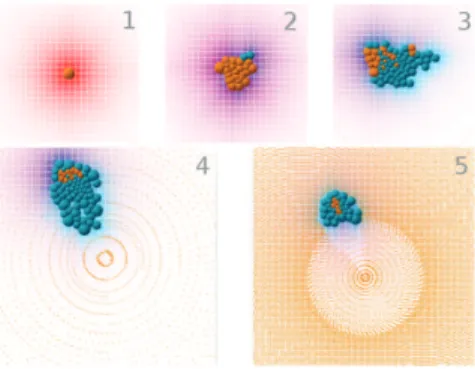
Figure 5: Screen capture of the organism toward the evo-lutionary process. After 20 generations, the organism orga-nizes nutritive cells (in orange) into a cluster and constantly renews a few defensive cells (in blue) which position are not yet optimal. At generation 20, the organism produces mul-tiple highly organized clusters with a central nutritive cell protected by a field of defensive ones. The energy repartition (showed on the right-hand side, the greener the higher) is re-markably efficient with this strategy. Finally, the best strat-egy, emerging around generation 40, is movement. Cells organize themselves into a bigger cluster that asymetrically renews cells in order to escape from the center of the envi-ronment, where the particles are concentrated, while keep-ing a heart of nutritive cells surrounded by a shield of defen-sive ones. The cells use morphogens to position themselves in the colony and drive it in a specific direction.
opposition (and thus complementarity) to the nutritive state is the defensive state, which offers a good defense against particles but a very low nutritive efficiency. Table 1 shows skill points distributions for the relevant skills set.
Property N D Description
Ambrosia Production
3 0 Nutrients units a cell can turn into ambrosia at each time step Ambrosia
Storage
10 3 Maximum amount of ambrosia that can be stored
Resistance 0 10 Amount of energy that can be absorbed from particles before the cell dies (here, a particle has 1 energy)
Table 1: Skill points repartition for the two specialization states N (nutritive) and D (defensive).
Results The results show a global increase in the crea-tures’ life time (the fitness function, expressed in number of frame) over the generations. By observing the best individ-uals and by looking at the evolution of the selected genome, generations after generations, we can identify three key de-velopmental strategy elements (depicted on figure 5):
1. Clusters: After a few generations, cells start to organize themselves in fuzzy clusters where a few nutritive cells are surrounded by protective cells. This strategy seems to be an effective way to use the specialization states: energy providing cells, which are vulnerable, stay protected from the particles by feeding a shell of protective cells. More notably, the formation of these clusters relies extensively on the use of apoptosis, and thus present interesting simi-larities with the expermimental evolution of multicellular “snowflakes clusters” with yeast (Ratcliff et al., 2012). 2. Constant renewing: later in the evolution, cells inside the
clusters tend to constantly divide and specialize into de-fensive cells. This makes up for the dede-fensive cells dying because of the aggression of the particles but also because they receive less ambrosia when they are far from the nu-tritive cells. It is also to be noted that cellular clusters tend to be stable, maintaining an average number of cells throughout their life.
3. Shifting from the center. We observe that, over the dozen different evolution runs we made, a special behavior tends to emerge near the “end” of the evolution runs: movement (at cluster level). Organisms tend to avoid the center of the environment which is way more dangerous than the outskirts because of the concentric pattern formed by the particles. They do so by using an unbalanced division ratio and apoptosis: division rate is more intensive on one side of the cluster than on the other side. We verified that this behavior was not just a consequence of the particles being denser in the middle of the environment: the same organisms put in a particle free environment demonstrated the same behavior (depicted by figure 6).
Figure 6: Successive steps of the development of one of the best individuals. Nutritive cells (in orange) surround them-selves with a shield of protective cells (in blue) which they feed. Movement toward the outside of the environment can also be noticed (in the direction of the magenta morphogen gradient). Particles become intentionally denser and denser until no organism can possibly survive. This allows for a constant constraint increase throughout the simulation.
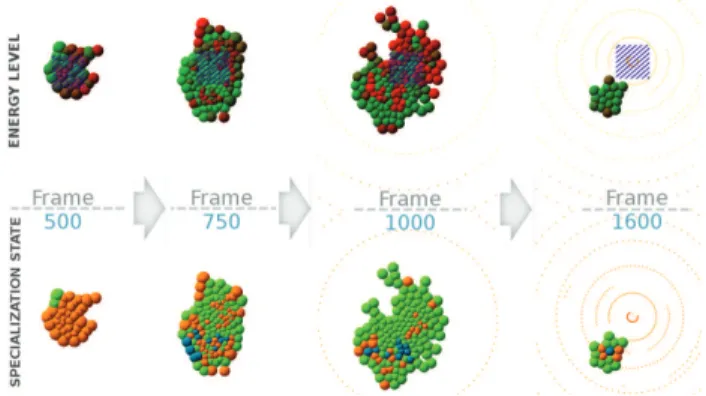
Figure 7: Development of the best organism for the second experiment, showing a 4-steps developmental strategy. Nu-tritive cells are orange, defensives are green and storage ones are blue. Striped area indicates where nutrients appear. The greener the cells, the higher their energy.
Second experiment: adding an energy constraint
For this second experiment, the cells have to survive under harder constraints. They now not only have to survive ag-gression from harmful particles, but they also have to com-pose with a stronger energy constraint. Nutrients are indeed placed on a square centered in the environment where parti-cle density is maximum. Moreover, they are cyclically ap-pearing and disapap-pearing, with an increasing amount of time between every two appearences. Therefore, the organism will have to face episodes of starvation. Moving too soon toward the exterior of the circle in order to escape highly dense particles might thus not be a viable option anymore.
In addition to this constraint, nutritive cells can no longer store large amount of ambrosia. In order for an organism to be able to store it, a third specialization type is introduced: the storage state. The analogy could be made with lipid cells which are storing energetic molecules in living beings. The characteristics of this new specialization state are almost no
resistance to particles(0.1 points), no nutrients extraction
capabilities(ambrosia production rate is null), a high
am-brosia storage capacity(10 points) and a perfect ambrosia
diffusion efficiency.The other two specialization states (nu-tritive and defensive) are kept identical to experiment 1, ex-cept for their ambrosia storage capacity which is now set to 0.5. The first cell is nutritive and can specialize into either defensive or storage.
Results The results show a strong convergence in the de-velopment strategies over the 6 evolutionary runs (120 gen-erations of 400 individuals each) launched for this experi-ment. Figure 7 shows a timelapse of one of the best individ-uals. The best strategy seems to be the following scheme. First, lots of nutritive cells are created from the initial cell (they can easily survive as the nutrients only disappear for short periods of time at the beginning of the simulation and
Figure 8: Cell population through time. Grey background indicates nutrients availability. The four steps of the devel-opment can be seen: proliferation (frame 0 to 550); shell cre-ation (when particles arrive) and beginning of storage place-ment (550 to 900); as nutrients are getting rare, creation of a small energy storage cluster, still surrounded with defensive cells linking to the core where nutrients still appear (900 to 1100) and 4) stabilization in a small size cluster (the center of the environment gets abandoned) with a few storage cells spreading all of their ambrosia to the defensives ones.
particles are still far away). Secondly, a shield of protec-tive cells starts to appear. At this stage of the simulation, nutrients are still abundant and the main concern for the or-ganism is to protect them against particles. The oror-ganisms that fail in this task in the early generations try to compen-sate with quick proliferation but eventually die quite early in the simulation due to the particle damages. Then, as nutri-ent availability starts to become a problem, most organisms start specializing some of their nutritive cells into storage ones. Here, the only difference between organisms that end up with an average fitness and the ones that have the best fitnesses is the localization of these storage cells. The best organisms place the storage cells away from the center of the circle of particles, but with still a network of nutritive cells surrounded by defensives near the center, where nutrients still appear. We can see this behavior between frame 750 and 1000 of figure 7: nutritive cells that were waiting on the extremity of the organism specialize into storage cells in an-ticipation of starvation. Finally, with the simulation moving forward, appearences of nutrients become extremely rare, and the organisms shrink to a tiny cluster composed of a few storage cells diffusing the ambrosia they collected to a shield of defensive cells. Figure 8 gives an overview of these steps by showing the cell population through time.
The organism was able to find a strategy to adapt to peri-odical starvation by using the storage state in a suitable way. This illustrates the capacity of the model to step up in com-plexity in order to manage a new specialization state and harder environmental constraints, as well as how the model can give birth to interesting development strategies.
Conclusion and discussion
This article detailed a model (SOMAS) which aims to pro-vide a base for the organogenesis of virtual organisms. The focus of SOMAS has been made on three main layers: the cellular physics, the simplified cell cycle and the specializa-tion mechanism. The experiments gave encouraging initial results as cells successfully specialized into different avail-able types to better fulfill certain function and adopted a par-ticular morphology and cooperation-based strategy, demon-strating the ability for the model to produce complex devel-opmental plans without any complex fitness design. Mor-phology and strategy emerged from both the environmental constraints and the intrinsic weaknesses and efficiency the cells had to compose with. The first results showed the for-mation of clusters and collection of cells that could easily be compared to some of the early living multicellular organ-isms, which were often barely more than aggregated clusters of specialized monocellular organisms living in symbiosis.
This model aims to bring tools to the artificial life re-searches for a better abstraction of the consequences and manifestations of living cell specialization. It avoids the de-sign of an omnipotent multipurpose cell as well as the use of complex fitness functions which would explicitly enforce the desired phenotype of the creatures. Our model tries to abstract the underlying complex realities of the cellular spe-cialization process by capturing some of its essential observ-able implications. One of the idea behind this model is there-fore that organogenesis, and thus complexity and diversity in the shape and functions of multicellular organisms, is a direct consequence of the incapacity for a cellular type at being efficient on every front at the same time.
A certain number of enhancements will be at the heart of our future work. First, we presented here experiments where specialization types were manually designed. The next step is to integrate this design directly into the creature’s DNA. Optimum cell specialization trees structure as well as skill points distribution will have to be found through an evolu-tionary process. This means a meticulous balancing work has to be done. We also want to increase the number of at-tributes specialization states can be formed with.
Another important research path we want to explore is co-evolution. Here, we presented experiments where the fitness was kept as simple as possible: it just is the amount of time organisms can survive. Therefore, the model seems well suited for a coevolution approach where all organisms could, for example, compete for their survival in a limited nutrient environment. Using the potentiality of the physical engine by adding physical constraints would also be another way to encourage organisms in finding innovating morphologies.
References
Bongard, J. and Pfeifer, R. (2003). Evolving complete agents using artificial ontogeny. Morpho-functional machines: The new
species (designing embodied intelligence), pages 237–258.
Chavoya, A. and Duthen, Y. (2008). A cell pattern generation model based on an extended artificial regulatory network.
Biosystems, 94(1):95–101.
Cussat-Blanc, S., Pascalie, J., Mazac, S., Luga, H., and Duthen, Y. (2012a). A synthesis of the cell2organ developmental model. In Morphogenetic Engineering, pages 353–381. Springer. Cussat-Blanc, S., Sanchez, S., and Duthen, Y. (2012b). Controlling
cooperative and conflicting continuous actions with a gene regulatory network. In Conference on Computational
Intelli-gence in Games (CIG’12). IEEE.
Davidson, E. H. (2006). The regulatory genome: gene regulatory networks in development and evolution. Academic Press. De Garis, H. et al. (1999). Artificial embryology and cellular
differ-entiation. Evolutionary design by computers, pages 281–295. Doursat, R. (2009). Facilitating evolutionary innovation by devel-opmental modularity and variability. In Proceedings of the
11th Annual conference on Genetic and evolutionary compu-tation, pages 683–690. ACM.
Flann, N., Hu, J., Bansal, M., Patel, V., and Podgorski, G. (2005). Biological development of cell patterns: characterizing the space of cell chemistry genetic regulatory networks. Lecture
notes in computer science, 3630:57.
Gardner, M. (1970). Mathematical games: The fantastic combi-nations of john conway’s new solitaire game life. Scientific
American, 223(4):120–123.
Hotz, P. E. (2004). Asymmetric cell division and its integration with other developmental processes for artificial evolutionary systems. In Proceedings of the 9th International Conference
on Artificial Life IX, pages 387–392.
Joachimczak, M. and Wr´obel, B. (2008). Evo-devo in silico-a model of a gene network regulating multicellular develop-ment in 3d space with artificial physics. In ALIFE, pages 297–304.
Joachimczak, M. and Wr´obel, B. (2010). Evolving Gene Regula-tory Networks for Real Time Control of Foraging Behaviours. In Proceedings of the 12th International Conference on
Arti-ficial Life.
Joachimczak, M. and Wrobel, B. (2012). Co-evolution of morphol-ogy and control of soft-bodied multicellular animats. Knabe, J., Schilstra, M., and Nehaniv, C. (2008). Evolution and
morphogenesis of differentiated multicellular organisms: au-tonomously generated diffusion gradients for positional in-formation. Artificial Life XI.
Nicolau, M., Schoenauer, M., and Banzhaf, W. (2010). Evolving genes to balance a pole. Genetic Programming, pages 196– 207.
Ratcliff, W. C., Denisona, R. F., Borrelloa, M., and Travisanoa, M. (2012). Experimental evolution of multicellularity.
Proceed-ings of the National Academy of Sciences 109.5.
Schramm, L., Jin, Y., and Sendhoff, B. (2011). Emerged coupling of motor control and morphological development in evolution of multi-cellular animats. 5777:27–34.
Von Neumann, J., Burks, A. W., et al. (1966). Theory of self-reproducing automata.