HAL Id: halshs-02949595
https://halshs.archives-ouvertes.fr/halshs-02949595
Submitted on 25 Sep 2020
HAL is a multi-disciplinary open access archive for the deposit and dissemination of sci-entific research documents, whether they are pub-lished or not. The documents may come from teaching and research institutions in France or abroad, or from public or private research centers.
L’archive ouverte pluridisciplinaire HAL, est destinée au dépôt et à la diffusion de documents scientifiques de niveau recherche, publiés ou non, émanant des établissements d’enseignement et de recherche français ou étrangers, des laboratoires publics ou privés.
Frailty transitions and health care use in Europe
Jonathan Sicsic, Thomas Rapp
To cite this version:
Jonathan Sicsic, Thomas Rapp. Frailty transitions and health care use in Europe. Health Services Research, Wiley, 2019, 54 (6), pp.1305-1315. �10.1111/1475-6773.13208�. �halshs-02949595�
Frailty transitions and healthcare use in Europe
1Jonathan Sicsic1* and Thomas Rapp1
Abstract
Objective. There is relative consensus that chronic conditions, disability and time-to-death are key drivers of age-related health care expenditures. In this paper, we analyse the specific impact of frailty transitions on a wide range of health care outcomes comprising hospital, ambulatory care, and dental care use.
Data source. Five regular waves of the SHARE survey collected between 2004 and 2015. Study design. We estimate dynamic panel data models on the balanced panel (N=6,078; NT= 30,390 observations). Our models account for various sources of selection into frailty, i.e. observed and unobserved time-varying and time-invariant characteristics.
Principal Findings. We confirm previous evidence showing that frailty transitions have a statistically significant and positive impact on hospital use. We find new evidence on ambulatory and dental care use. Becoming frail has greater impact on specialist compared to GP visit, and frail elderly are less likely to access dental care.
Conclusions. By preventing transitions towards frailty policy planners could prevent hospital and ambulatory care uses. Further research is needed to investigate the relationship between frailty and dental care by controlling for reverse causation.
1
LIRAES (EA 4470), University Paris Descartes, Sorbonne Paris Cité, Centre Universitaire des Saints-Pères, 45 rue des Saints-Pères, 75006 Paris, France
Correspondance: jonathan.sicsic@u-paris.fr
This article uses data from SHARE Waves 1, 2, 3 (SHARELIFE), 4, 5 and 6 (DOIs: 10.6103/SHARE.w1.610, 10.6103/SHARE.w2.610, 10.6103/SHARE.w3.610, 10.6103/SHARE.w4.610, 10.6103/SHARE.w5.610, 10.6103/SHARE.w6.610). The SHARE data collection has been primarily funded by the European Commission through FP5 (QLK6-CT-2001-00360), FP6 (SHARE-I3: RII-CT-2006-062193, COMPARE: CIT5-CT-2005-028857, SHARELIFE: CIT4-CT-2006-028812) and FP7 (SHARE-PREP: N°211909, SHARE-LEAP: N°227822, SHARE M4: N°261982). Additional funding from the German Ministry of Education and Research, the Max Planck Society for the Advancement of Science, the U.S. National Institute on Aging is gratefully acknowledged (see www.share-project.org). We would like to thank Nicolas Sirven, Eric Delattre, Julien Bergeot, and all participants to the MODAPA seminar (PSE, April 2018) for useful comments on previous versions of the paper. We also thank Charlotte de Bruyn for administrative support. The research leading to these results has received support from the SPRINTT project of the Innovative Medicines Initiative Joint Undertaking under grant Agreement number 115,621, resources of which are composed of financial contribution from the European Union’s Seventh Framework Program (FP7/2007–2013) and EFPIA companies’ “in kind contribution”.
INTRODUCTION
The growth of population aging in developed countries has raised interest in its associated costs. Understanding the drivers of medical care utilization and spending is crucial for the efficient organization (and allocation) of health care services (and resources). However, the relationship between ageing and health care expenditures has been the subject of much debate in the literature.1–3 Initially, Zweifel et al (1999) showed that age per se did not have a significant impact on health expenditures after controlling for proximity to death.2 Then, it has been suggested that comorbidities, chronic diseases and mental health issues, whose prevalence increases with age, actually mediate the relationship between age and increased health care expenditures.4–8 In Canada, it has been shown that differences in pre-existing chronic conditions contribute to health differences in health care expenditures.6 Furthermore, comorbidities, impairments, and proximity to death were found to be key mediators of age-related expenditures in the UK.7 Other results from cross-sectional data in Germany found that multimorbidity and mental health were consistently associated with total, inpatient, outpatient, and nursing costs.8
Recently, it has been advocated that frailty could be a key variable to consider when exploring the relationship between ageing and increase in health care expenditures.9 Frailty has been a well established concept in the medical literature.10–12 It is considered as a distinct health dimension besides disability, chronic diseases, and functional limitations.13 Frailty is defined as a “clinically recognizable state of increased vulnerability resulting from
aging-associated decline in reserve and function across multiple physiologic systems”.12 Frailty is associated with loss of muscle mass and muscle quality referred to as sarcopenia, resulting from anatomic and biochemical changes in aging muscle.14 As such, it is highly correlated with ageing. The estimated prevalence of frailty in Europe in 2004 was 4.1% among individuals aged 50-64 years and 17.0% among 65 years and older subjects.15 The specific contribution of frailty to ambulatory care expenditures was calculated using French administrative data, peaking at about €1,500 for frail individuals.9
From an economic point of view, the theoretical model underpinning the analysis of frailty in relation with health care utilization is the health deficit accumulation model.16,17 This model posits that ageing is associated with a loss of physical functions (e.g. depreciation of health capital), and ability to cope with stressing factors. This should increase the demand for healthcare when people become frail, a prediction that is consistent with Grossman healthcare
demand model.18 A growing body of the empirical literature has explored the specific impact of frailty on health care utilization.19–21 Using cross-sectional data in Belgium, it has been shown that frail and prefrail individuals were more likely than robust elders to contact a GP, a specialist, or an emergency department.19 Using panel data in 10 European countries, two studies showed that frailty was significantly associated with hospital and ambulatory care use, after controlling for both socioeconomic and health status.20,21 However, less is known about the correlation between frailty and dental care. Previous research underlined the importance of considering dental care access issues among the frail elderly population,22–25 but the evidence on the impact of (pre-) frailty on dental care use is scarce. The subject is important because by failing to consult for dental problems, pre-frail individuals may increase their chances to loose weight and become frail because of lower nutritional intake.24,26
Our aim in this paper is to provide new and more robust evidence on the impact of frailty transitions on health care use. Our contribution to the literature is threefold. First, we use more recent and exhaustive data from the five regular waves of the Survey of Health, Ageing, and Retirement in Europe (SHARE) thus providing more insights for the analysis of frailty transitions and more robust conclusions. Second, we analyse the impact of frailty on a wider range of health care use outcomes, namely probability of hospital admission, probability of ambulatory care visits (by distinguishing GP and specialist visits), and for the first time exploring its correlation with dental care use in a longitudinal setting. Third, from a methodological point of view, we estimate empirical models that are less prone to endogeneity as they account for various sources of selection into frailty: (a) unobserved time-invariant characteristics through inclusion of individual fixed effects, (b) time-varying observed variables and (c) time-varying unobserved shocks through the specification of a dynamic model with lagged dependent variable.27 Specifically, we formalize and discuss for the first time the conditions under which our estimates can be considered as causal.
DATA
Source and sample
We used data from the five regular waves of the Survey of Health, Ageing, and Retirement in Europe (SHARE) collected at different time points in 2004/05 (wave 1), 2006/07 (wave 2), 2011/12 (wave 41), 2013 (wave 5) and 2015 (wave 6). In these waves, SHARE provides
information on socioeconomics, health and health-care use variables from representative samples of non-institutionalised individuals over the age of 50 in eleven countries.28 The countries represent northern Europe (Denmark and Sweden), central Europe (Austria, France, Germany, Switzerland, Belgium, the Netherlands), and southern Europe (Spain, Italy and Greece). We restricted the sample to the nine countries participating in all regular waves (thus excluding Greece and the Netherlands) and to individuals who participated in the first wave of the panel.
Dependent variables
Three types of health care utilization indicators were used as dependent variables in our models: (1) hospital admission, (2) ambulatory care use, and (3) dental care use. Hospital admission was included as a dichotomous variable measuring whether, during the last 12 months, the respondent had been in a hospital overnight (HOSP = 1/0). We used three indicators of ambulatory care use. First, having 1+ visit to a medical doctor (including emergency room or outpatient clinic visits) in the last 12 months (DOC = 1/0). In the first three regular waves of SHARE, it was also possible to distinguish between GP visit (GP = 1/0) and specialist visit (SPE = 1/0). Finally, we used an indicator of whether the respondent had at least one visit with a dentist in the last 12 months (DENT = 1/0). Note that this information was not collected in wave 4.
Independent variables
Our explanatory variable of interest was Fried’s frailty scale, which defines frailty according to five dimensions:10,13 low energy, slowed walking speed, diminished appetite, low grip strength, and low physical activity. We followed prior work to compute the frailty scale: 15,20,21
one point was allocated for each fulfilled criterion and a frailty score was computed by summing each criterion which contributed equally to the score (theoretical bounds: 0-5). We set cut-off points in order to define three profiles: 0 for robust, 1-2 for pre-frail, and 3-5 for frail.12,20
We controlled for several socioeconomics and health status indicators identified as predictors of health care demand in previous work 4,29 and / or as potential correlates of frailty.20 Predisposing or enabling factors (according to Andersen’ behavioural model)29 included age, gender, education, living with a spouse or having a partner, and a dichotomous
measure of income adequacy based on a 4-point scale indicating whether the household was able to make ends meet: with great difficulty / with difficulty (coded 1) versus fairly easily / easily (coded 0). This subjective indicator of economic deprivation that has been found to be well correlated with material deprivation items in SHARE data 30. In addition, we used a dichotomous variable of self-rated health being fair or poor (poor SRH), having two or more chronic diseases (chronic 2+), having two or more limitations in activities of daily living (ADL 2+), having two or more limitations in instrumental activities of daily living (IADL 2+), and having three or more depressive symptoms according to the Euro-D measure.31
Sample attrition
Similarly to most panels focusing on elderly people, SHARE is characterized by an important attrition. In our sample, 52% of interviewees who participated in the first wave participated in all waves. In this situation, an important question arises, namely whether to use the balanced (i.e. with no missing data) or the unbalanced dataset. Fixed effects (FE) estimates on the unbalanced panel are consistent only in the presence of exogenous attrition, i.e. only if the determinants of attrition are uncorrelated with the time-varying regressors.32 However, since individuals remaining in the panel are often healthier than attriters, sample selection is unlikely to be exogenous.
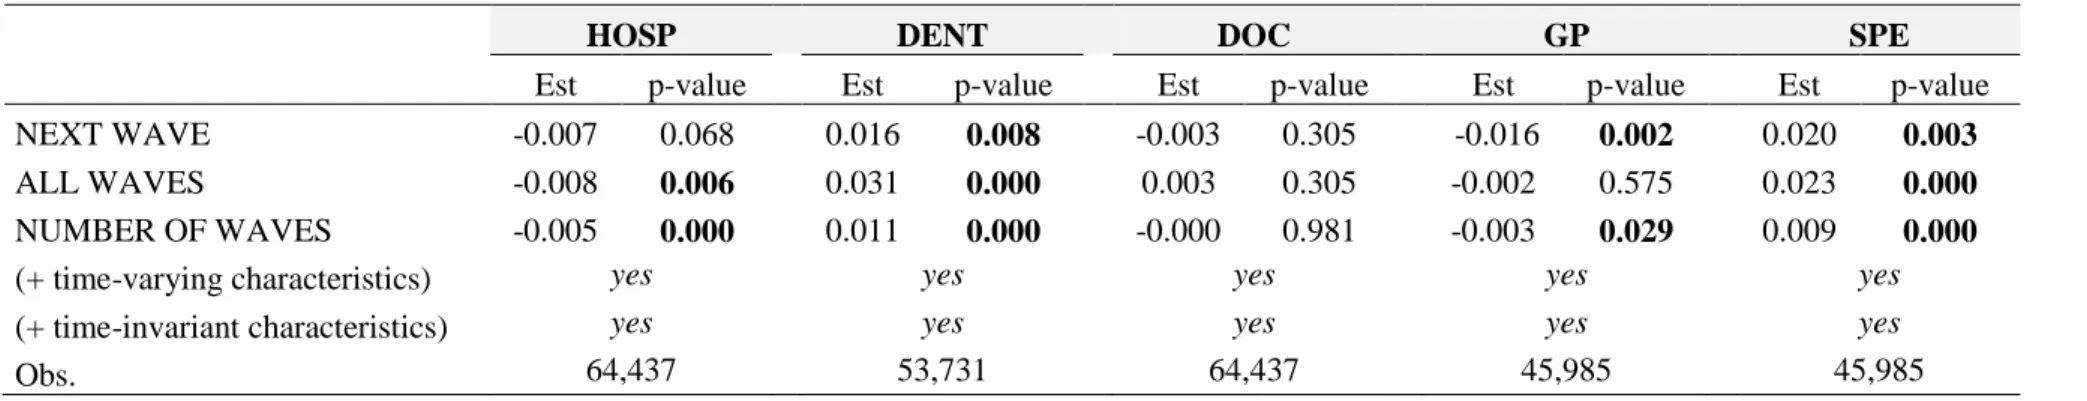
An overview of sample size, dropouts, and attrition rate by wave and according to respondents’ characteristics is presented in Appendix A (Table A.1). Individuals with poor health and in particular, frail elders are more likely to be attriters. These results are confirmed by running Nijman and Verbeek’ (1992) variable addition tests in order to test for exogenous attrition.33,34 Rejection of one of the tests was interpreted as indicating non-exogenous selection, which was the case for nearly all models (see Table A.2). To be consistent, we estimated our FE models using the balanced sample, comprising 6,078 individuals and 30,390 person-wave observations. Results of models estimated on the unbalanced sample are provided in supplementary Tables A.4 and A.5 (Appendix A).
ECONOMETRIC MODELS
General specification
Let denote a binary indicator of health care use for outcome k (k= HOSP, DENT, DOC, GP, SPE), individual i (i=1,...,N) at time t (t=1,...,T). Let
denote a vector of dummy indicators of Frieds’ frailty score being strictly higher than 0 (pre-frail) or strictly higher than 2 ((pre-frail), denote the full rank matrix of time-varying control variables, represents an unobserved individual specific term (capturing time-invariant unobserved factors affecting health care use) and represents the idiosyncratic error term (capturing time-varying unobserved shocks). The general model to be estimated is written as follows:
Fixed effects (FE) specification
FE estimation of Eq (1) is obtained by OLS estimation on the within-transformed data (thus identification relies completely on within-group variations), which has two consequences. First, it allows interpreting the coefficients in Eq (1) as the impact of frailty
transitions on health care use. Second, it allows netting out the impact of unobserved
time-invariant factors (e.g., genomic characteristics) that could be correlated with both frailty and health care use. Additional information regarding identification are provided in technical Appendix B.
However, estimates from the FE model could be biased because of two types of endogeneity issues, namely omitted variable bias and reverse causality. First, in the case of hospital and ambulatory care use, time-varying unobserved shocks that are included in (e.g. accident, fall) may simultaneously affect frailty transitions and health care use. Second, in the case of dental care use, there could be reverse causality, i.e. by failing to consult for dental problems, robust / pre-frail individuals may increase their chances to loose weight and become frail because of lower nutritional intake. Indeed, it can be shown that, ceteris paribus, lack of dental care use is a significant predictor of frailty (see Table A.6, Appendix A). These two endogeneity issues cannot be completely removed in the absence of a well-specified
instrument. However, the source of bias can be partly reduced by using a correct dynamic specification of Eq (1).
Dynamic correlated random effects (CRE) model
A generalization of the static FE model to the dynamic case is presented in Eq (2):
In the CRE specification, is treated as a random effect, and is replaced by its linear projection onto the means of the time-varying regressors (see technical Appendix B for additional information). As shown in the seminal work of Mundlak (1978)35, results of FE and CRE models estimated on a balanced panel collapse (see Table A.3 for empirical comparison using Hausman test). In the dynamic CRE model in Eq (2), is an autoregressive one-period lag of the dependent variable k and denotes the associated coefficient, which reflects persistence or state-dependence in health care utilization36. In addition, captures all time-varying unobserved shocks that may simultaneously affect frailty and health care use, thus reducing the correlation between frailty and residual unobserved heterogeneity. Following previous research,21 we used information contained in the third retrospective wave of SHARE - namely an indicator variable of whether individuals had health problems in adult life - as the initial value of the dependent variable. 37 The models were estimated by feasible generalized least square (GLS) with standard errors accounting for clustering at the individual level.
Dealing with the endogeneity of time-varying controls
Our model accounts for all time-invariant and some time-varying characteristics that could be associated with both frailty and health care use. Two types of time-varying characteristics are included in : (1) exogenous variables (i.e., age and wave dummies) and (2) potentially endogenous variables (e.g., living with partner, chronic diseases, ADL / IADL limitations) for which it is theoretically not possible to assert whether they are causes or consequences of frailty. On the one hand, including endogenous control variables that are consequences of frailty may block the causal pathway and lead to biased estimates of both the total and direct effect of frailty.38 In particular, if these endogenous variables are positively correlated with frailty, they will capture part of the correlation between frailty and health care use such that controlling for these variables is likely bias downward the effect of frailty (assumption 1). On the other hand, if these variables are exogenous and exert a causal impact
on frailty, then excluding them from the model would lead to an omitted variable bias, which likely will bias upward the effect of frailty (assumption 2). As it is not possible to determine with certainty which scenario is most plausible (most likely, there is a dynamic relationship between frailty and the included time-varying endogenous variables) two models have been considered: (1) excluding and (2) including these variables. Results of model (1) are interpreted as the total effect of frailty, and results of model (2) are interpreted as the partial
effect of frailty.
Robustness analyses
We test the robustness of our main analyses by comparing the results of models (1) and (2) across different model specifications and estimation strategies: fixed effects OLS, conditional maximum likelihood (fixed effects logit) and random effects GLS, in the balanced and unbalanced samples. We also replicate FE analyses using SHARE weights designed to obtain a representative population of each country. These weights are calibrated to precisely reflect each country’s age and gender proportions.39
All results are provided in Tables A.4 to A.7 .
RESULTS
Descriptive statistics
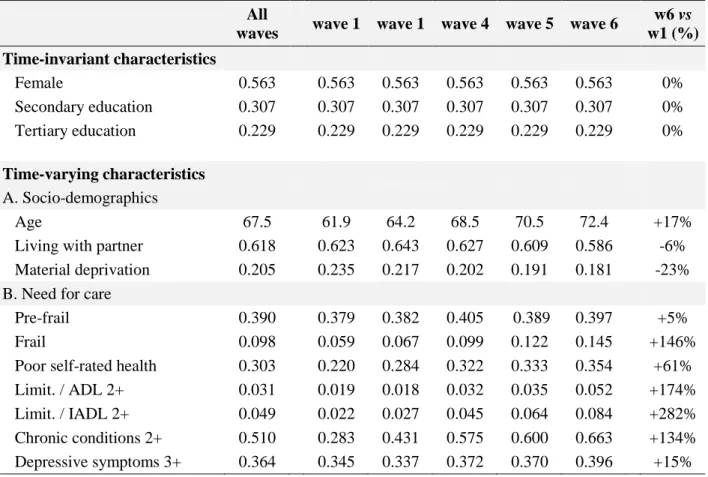
Table 1 provides an overview of the distribution of the independent variables at different points in time in the balanced sample. Not surprisingly, the proportion of frail individuals is increasing in time as a result of ageing of the population (+ 146% increase between wave 1 and wave 6). There is a similar increase over time in the levels of functional limitations (e.g., +174% increase in prevalence of 2+ ADL limitations), chronic conditions (+134% increase) and to a lesser extent, depressive symptoms (+15% increase). The socio-economic indicators are stable over time.
[insert Table 1]
Age and sex-standardized rates of health care use according to the frailty status are provided in Table 2. There is a strong positive correlation between frailty and hospital admission: 30.1% of frail individuals had at least one hospitalization in the past 12 months
versus 9.7% among robust elders (of similar age and sex). Similarly, there is a strong positive correlation between frailty and ambulatory care: 97.5% of frail individuals had at least one doctor visit in the past 12 months versus 87.9% among robust elders. These differences seem to be more important concerning access to specialist versus primary care practitioner: there is a 20.9 percentage points difference in the probability of specialist visit among frail (versus robust) elders, as compared to a 14.0 percentage points difference in the probability of GP visit. On the contrary, there is a negative correlation between frailty and dental care use: 41.4% of frail elders had at least one visit to the dentist in the past 12 months versus 63.6% among robust elders.
[insert Table 2]
Results of econometric models
The results of the static FE and dynamic CRE models of health care use estimated on the balanced sample are presented in Table 3 (hospital admission and ambulatory care), Table 4 (GP and specialist visit) and Table 5 (dentist visit). In all models except dental care, the sign and statistical significance of frailty are stable across the two econometric specifications. For parsimony, we only detail the estimates of the dynamic CRE models.
In the model of hospital use, becoming frail is associated with a total effect of 14.4 percentage point (pp., hereafter) increase in the probability of hospital use, and a 9.7 pp. increase once the effect of potentially endogenous controls has been netted out (partial effect displayed in model 2). As expected, in model 2, poor self-rated health, having 2+ ADL / IADL limitations and 2+ chronic diseases is further associated with increased hospital admission, but the marginal impact is lower compared to frailty. We find evidence of persistence in hospital admission. As expected, the initial conditions have a positive and statistically significant impact on contemporaneous hospitalization. Among the time-invariant socio-economic characteristics, only gender is significantly associated with hospital use: in model 2, being a female is associated with a 2.1 pp. decrease in the probability of hospital admission.
[insert Table 3]
The magnitude and statistical significance of the impact of frailty transitions on
covariates. Becoming pre-frail is associated with a significant increase in ambulatory care use (total effect = 1.8 pp. increase and partial effect = 1.2 pp. increase). Becoming frail is associated with a significant effect on ambulatory care use only in model 1, with a total effect of 2.1 pp. increase (see Table 3). We find evidence of persistence in ambulatory care use.
Table 4 reports the results of the analyses according to the type of medical practitioner (i.e., GP or specialist). The impact of frailty transitions on care use is stronger for specialist compared to GP. Becoming pre-frail or frail are significantly associated with an increased probability of GP visit, though with limited magnitude (2.1 pp. and 2.9 pp. increase, respectively) and only in model 1 (not controlling for potentially endogenous covariates). However, becoming frail is associated with a total effect of 7.7 pp. increase – and a partial effect of 5.7 pp. increase – in the probability of specialist visit.
Among the time-varying health controls variables, poor self-rated health and 2+ chronic conditions are associated with increased ambulatory care use (either GP or specialist). Moreover, transition into material deprivation (within-subject variability) is associated with higher likelihood of GP visit but no specialist visit. On the contrary, between-subject variability in socio-economic characteristics are significantly associated with specialist visit: having a tertiary education is associated with a 10.5 pp. increase in the probability of specialist visit, and material deprivation is associated with a 6.9 pp. decrease in the probability of specialist visit.
[insert Table 4]
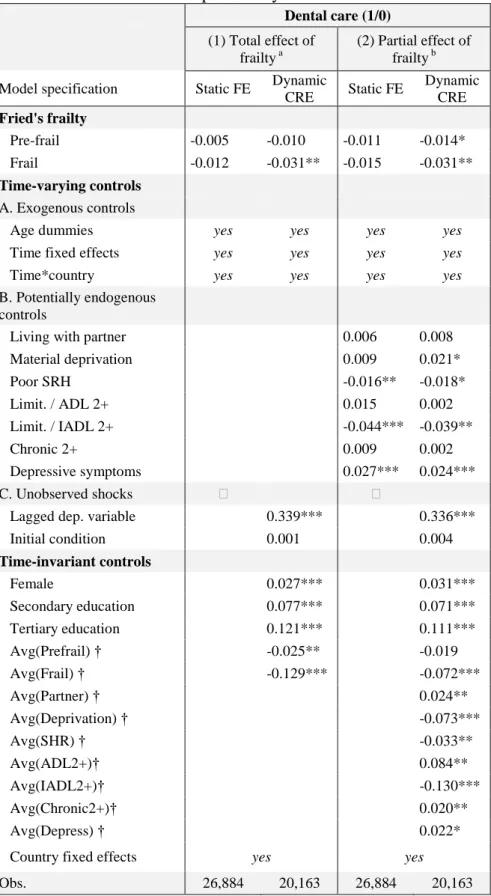
The results of the models of dental care use are displayed in Table 5. Compared to previous results, the marginal impact of frailty transitions on dental care use (i) is negative, (ii) differ in the static FE versus dynamic CRE model, and (iii) is less impacted by the introduction of potentially endogeneous variables. First, pre-frailty transition is not significantly associated with dental care use in any of the models (at the 5% level). Second, becoming frail is significantly associated with lower dental care use only in the dynamic CRE specification. Third, the total and partial effect of frailty is of the same magnitude: frailty transition is associated with a 3.1 pp. decrease in the probability of dental care use in model 1 and model 2. Among the potentially endogenous time-varying characteristics included in model 2, having 2+ IADL limitations is negatively associated with dental care use, whereas depressive symptoms are positively correlated with dental care use. Moreover, there is
significant persistence in dental care use: in model 2, past use increases the probability of contemporaneous use by 33.6 pp. Concerning the impact of the socio-demographic time-invariant characteristics, being a female, having secondary or tertiary education, and living with a partner are all significantly associated with higher dental care use. On the contrary, material deprivation is negatively associated with dental care use, reflecting problems in access to dental care among economically less well-off populations.
[insert Table 5]
Results of robustness analyses
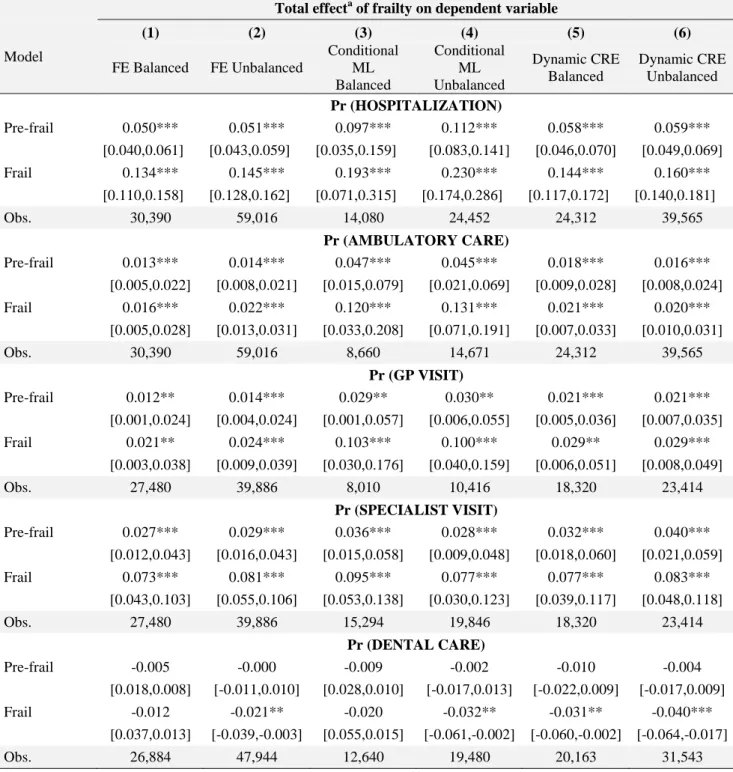
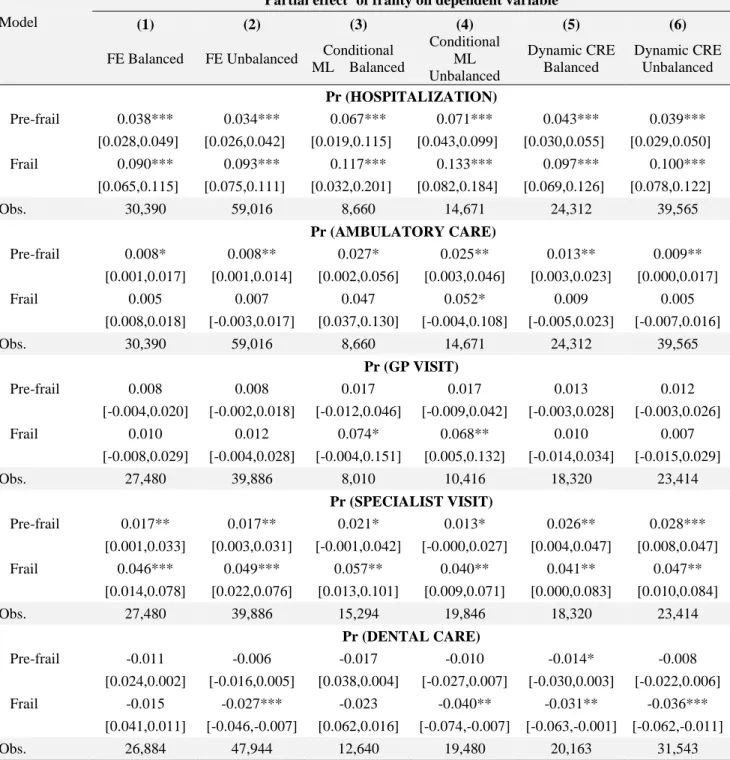
Our results are robust to competing econometric specifications: (i) estimations on the unbalanced panel, (ii) use of logit link function in a conditional maximum likelihood estimation framework, and (iii) and weighted FE estimation using SHARE sampling weights to ensure representativeness of the surveyed population.39 Interestingly, the estimates are higher in absolute terms in alternative specifications (i) and (ii) (see Tables A.4 and A.5 for model comparisons). For instance, becoming frail is associated with a 23.0 pp. increase (total effect) in the probability of hospitalization in the conditional logit model on the unbalanced panel (versus a 14.4 pp. increase in the dynamic CRE on the balanced panel). This shows the results of our main analyses on the balanced panel may be conservative.
DISCUSSION
This study provides an empirical and methodological contribution to the literature on the determinants of health care utilization among older people. To our knowledge, this study is the first to have used the five regular waves of the SHARE survey to analyse the effect of frailty transitions on a wide range healthcare indicators using econometric specifications that account for various sources of selection into frailty and thus are less prone to endogeneity bias. In additions, we compare the results across different specifications, (1) excluding or (2) including potentially endogenous (health) controls, the results of which are interpreted respectively as (1) the total effect or (2) the partial effect of frailty. However, care is needed in interpreting these results, as both estimates may be biased: upward for the ‘total effect’ (because of omitted variable bias), downward for the ‘partial effect’ (because of endogenous controls capturing part of the relationship between frailty and the outcome). It is thus
informative to present the results of both specifications, as they are likely to provide upper and lower bounds of the effect of frailty transitions on health care use. According to our preferred - though potentially conservative - estimates, transitions into frailty are associated with a marginal increase in the probability of hospitalization by about 9.7 to 14.4 percentage points. Concerning ambulatory care use, the impact of frailty transition is economically un-significant for GP visit, but is associated with a 5.7 to 7.7 percentage points increase in the probability of specialist visit. On the contrary, becoming frail is associated with a 3.1 percentage point decrease in the probability of dental care visit. In all models, poor health, limitations in (instrumental) activities of daily living or chronic diseases were significant predictors of health care use.
The results on the impact of frailty on hospitalization and ambulatory care use confirm previous findings. Using the first three waves of SHARE, it was shown that progression by one point on the frailty scale [0;5] was associated with an additional risk of hospitalization of about 2.1 percentage point.21 In our study, frailty was defined as scoring three or more on the frailty scale, i.e. corresponding to an increase in three points (or more) on the frailty scale. Using static models estimated from the first three waves of SHARE, it was found that frailty was significantly associated with doctor and GP visits.20 Using a dynamic specification controlling for time-invariant unobserved characteristics allowed us to provide more robust conclusions.
To our knowledge, our study is the first to assess the relationship between frailty and dental care use in a longitudinal setting. Previous work has underlined the importance of this subject, since frail elders suffer more from untreated dental issues than robust elders.22,25 Nevertheless, our results should be interpreted with caution due to the problem of reverse causality, i.e. people may become frail precisely because they do not consult a dentist and are thus more exposed to malnutrition.24 In our model, the negative estimate of the impact of frailty on dental care use may capture both the ‘pure’ (causal) negative effect of frailty and also the negative ‘selection effect’ into frailty (i.e., the negative correlation between dentist care and frailty, see Table A.6). Yet, in the absence of a plausible instrument, we cannot disentangle the two effects and our results should not be interpreted in a causal way. Still, controlling for past dental care in the dynamic specification is an important contribution to the literature, as it should theoretically allow capturing some of the sources of reverse causality. Despite this limitation, our results are consistent with the literature, showing for instance that functional limitations and poor oral health were associated with a lower probability of dental
care among French institutionalized elders.40 In any case, even in the hypothetical scenario where all of the negative correlation between frailty and dental care was driven only by a selection effect, our results underline the need to increase access to dental care for frail elders, and can be used to raise the awareness on that issue. The none significant effect of pre-frailty may either be explained by the fact that reverse causation (pre-frailty caused by absence of dental care) is lower or do not exist, or due to the fact that the ‘pure’ negative effect of pre-frailty on dentist visit is less important. This seems a reasonable assumption, as pre-frails are less likely to suffer from mobility limitations associated with problems of access to dental care.
We found that socio-economic variables (i.e., living with a spouse, education, and subjective material deprivation) had little or non-significant impact on GP visit and hospital admission. These results are consistent with a previous analysis of health care use in the elderly German population.5 However, these variables had significant impact on dental care use. In particular, the result that material deprivation is associated with lower dental care use strengthens the need to promote better access to dental care in the elderly, for instance by optimizing dental care insurance and / or increasing coverage.41 We found that only between-subject differences in terms of material deprivation was associated with dental care use. This result could be partly explained by the low amount of within-subject variability in socio-economic status across waves. Another interpretation of the result is that habits or ‘predisposing’ factors related to present or past economic conditions 29
have higher impacts on dental care use than transitive economic shocks. In any case, that lower economic resources are associated with less access to specialists is consistent with theoretical and empirical evidence.4,29
Our study faces several limitations. A well-known shortcoming of the linear probability model is that the predicted probabilities are unbounded thus making it unsuitable for making predictions. However, we were mainly interested in computing average marginal effects, and standard errors were adjusted for heteroskedasticity. We also checked the robustness of our results using non-linear logit specifications, but the conclusion remained unchanged (Tables A.4 and A.5). Despite the richness of SHARE survey, the models were estimated only on a subset of the population being observed in all waves, which could create a selection bias. However, as our identification strategy relies on within-individual variability, our estimates are consistent in the presence of selection on observables or unobservables insofar as the non-ignorable non-response is due to time invariant characteristics.33 Another
way to deal with attrition would be either to apply inverse probability weighting (IPW) on the unbalanced panel,34 or to use a competing-risk model treating attrition as an endogeneous variable. However, the conditional independence assumption underlying the IPW methodology could not be verified in our data (see technical Appendix B). Moreover, absence of information regarding the date of hospitalization, ambulatory care or dental care visit prevented joint modeling of health care use and attrition in a competing-risk framework. Yet, several influential studies reported that attrition does not lead to serious bias (i.e., affecting the magnitude of coefficients) even in the presence of large sample attrition.42–44 Another data limitation is lack of information about the reasons for hospitalization (e.g., planned versus unplanned), which would be helpful distinguishing in empirical models. Finally, because of data limitations, we were not able to identify whether the use of hospital care and ambulatory care were adequate or not. Further studies should therefore explore whether frailty is correlated with unnecessary care use. Similarly, the decrease in dental care use associated with frailty may not necessarily indicate “inadequate” care/prevention, and this result should be therefore explored with caution.
CONCLUSION
Frailty is a multifactorial and dynamic concept. It is a non-absorbing state, which means it is possible to design interventions to delay, if not reverse, frailty transitions. Our results suggest that delaying transitions towards frailty (e.g., by promoting exercise and appropriate diet) may contribute to preventing hospital and ambulatory care uses. Further research is needed to investigate the relationship between frailty and dental care by controlling for reverse causation.
Notes
1The third wave was a retrospective survey (SHARELIFE) conducted in 2008/09 and focusing on people’s life
References
1. Weisbrod BA. The Health Care Quadrilemma: An Essay on Technological Change, Insurance, Quality of Care, and Cost Containment. Journal of Economic Literature. 1991;29(2):523-552.
2. Zweifel P, Felder S, Meiers M. Ageing of population and health care expenditure: A red herring? Health Econ. 1999;8(6):485-496.
3. Seshamani M, Gray A. Ageing and health-care expenditure: The red herring argument revisited. Health Econ. 2004;13(4):303-314.
4. Andersen R, Newman JF. Societal and Individual Determinants of Medical Care Utilization in the United States. Milbank Q. 2005;83(4).
5. Hajek A, Bock J-O, König H-H. Which factors affect health care use among older Germans? Results of the German ageing survey. BMC Health Serv Res. 2017;17.
6. Smith PM, Bielecky A, Ibrahim S, et al. How much do preexisting chronic conditions contribute to age differences in health care expenditures after a work-related musculoskeletal injury? Med Care. 2014;52(1):71-77.
7. Hazra NC, Rudisill C, Gulliford MC. Determinants of health care costs in the senior elderly: Age, comorbidity, impairment, or proximity to death? Eur J Health Econ. August 2017.
8. Heider D, Matschinger H, Müller H, et al. Health care costs in the elderly in Germany: An analysis applying Andersen’s behavioral model of health care utilization. BMC Health
Serv Res. 2014;14:71.
9. Sirven N, Rapp T. The cost of frailty in France. Eur J Health Econ. 2017;18(2):243-253.
10. Fried LP, Tangen CM, Walston J, et al. Frailty in older adults: Evidence for a phenotype. J Gerontol A Biol Sci Med Sci. 2001;56(3):M146-156.
11. Rockwood K. Conceptual Models of Frailty: Accumulation of Deficits. Can J Cardiol. 2016;32(9):1046-1050.
12. Xue Q-L. The frailty syndrome: Definition and natural history. Clin Geriatr Med. 2011;27(1):1-15.
13. Fried LP, Ferrucci L, Darer J, Williamson JD, Anderson G. Untangling the concepts of disability, frailty, and comorbidity: Implications for improved targeting and care. J
Gerontol A Biol Sci Med Sci. 2004;59(3):255-263.
14. Marcell TJ. Sarcopenia: Causes, consequences, and preventions. J Gerontol A Biol Sci
Med Sci. 2003;58(10):M911-916.
15. Santos-Eggimann B, Cuénoud P, Spagnoli J, Junod J. Prevalence of frailty in middle-aged and older community-dwelling Europeans living in 10 countries. J Gerontol A Biol Sci
Med Sci. 2009;64(6):675-681.
16. Dalgaard C-J, Strulik H. Optimal Aging and Death: Understanding the Preston Curve.
Journal of the European Economic Association. 2014;12(3):672-701.
17. Strulik H. Frailty, mortality, and the demand for medical care. The Journal of the
Economics of Ageing. 2015;6:5-12.
18. Grossman M. On the Concept of Health Capital and the Demand for Health. Journal
of Political Economy. 1972;80(2):223-255.
19. Hoeck S, François G, Geerts J, Van der Heyden J, Vandewoude M, Van Hal G. Health-care and home-care utilization among frail elderly persons in Belgium. Eur J Public
Health. 2012;22(5):671-677.
20. Ilinca S, Calciolari S. The Patterns of Health Care Utilization by Elderly Europeans: Frailty and Its Implications for Health Systems. Health Serv Res. 2015;50(1):305-320.
21. Sirven N, Rapp T. The Dynamics of Hospital Use among Older People Evidence for Europe Using SHARE Data. Health Serv Res. 2017;52(3):1168-1184.
22. Chen X, Chen H, Douglas C, Preisser JS, Shuman SK. Dental treatment intensity in frail older adults in the last year of life. J Am Dent Assoc. 2013;144(11):1234-1242.
23. Ettinger RL. Dental implants in frail elderly adults: A benefit or a liability? Spec Care
Dentist. 2012;32(2):39-41.
dental occlusion in community-dwelling frail elderly people. Geriatr Gerontol Int. 2013;13(1):50-54.
25. Nitschke I, Majdani M, Sobotta BAJ, Reiber T, Hopfenmüller W. Dental care of frail older people and those caring for them. J Clin Nurs. 2010;19(13-14):1882-1890.
26. Stein P, Aalboe J. Dental Care in the Frail Older Adult: Special Considerations and Recommendations. J Calif Dent Assoc. 2015;43(7):363-368.
27. Ravesteijn B, Kippersluis H van, Doorslaer E van. The wear and tear on health: What is the role of occupation? Health Econ. 2018;27(2):e69-e86.
28. Börsch-Supan A, Brandt M, Hunkler C, et al. Data Resource Profile: The Survey of Health, Ageing and Retirement in Europe (SHARE). Int J Epidemiol. 2013;42(4):992-1001. 29. Andersen RM. Revisiting the Behavioral Model and Access to Medical Care: Does it Matter? Journal of Health and Social Behavior. 1995;36(1):1-10.
30. Börsch-Supan A, Kneip T, Litwin H, Myck M, Weber G. Ageing in Europe -
Supporting Policies for an Inclusive Society. Berlin, Boston: De Gruyter; 2015.
31. Prince MJ, Reischies F, Beekman AT, et al. Development of the EURO-D scaleâA European, Union initiative to compare symptoms of depression in 14 European centres. Br J
Psychiatry. 1999;174:330-338.
32. Wooldridge JM. Econometric Analysis of Cross Section and Panel Data. Cambridge, Massachusetts: MIT Press; 2002.
33. Nijman T, Verbeek M. Nonresponse in panel data: The impact on estimates of a life cycle consumption function. J Appl Econ. 1992;7(3):243-257.
34. Contoyannis P, Jones AM, Rice N. The dynamics of health in the British Household Panel Survey. J Appl Econ. 2004;19(4):473-503.
35. Mundlak Y. On the Pooling of Time Series and Cross Section Data. Econometrica. 1978;46(1):69.
36. Kohn JL, Liu JS. The dynamics of medical care use in the British household panel survey. Health Econ. 2013;22(6):687-710.
37. Wooldridge JM. Simple solutions to the initial conditions problem in dynamic, nonlinear panel data models with unobserved heterogeneity. J Appl Econ. 2005;20(1):39-54. 38. Angrist JD, Pischke J-S. Mostly Harmless Econometrics: An Empiricist’s Companion. Princeton University Press. Princeton; 2009.
39. The SHARE sampling procedures and calibrated design weights. In: The Survey of
Health, Aging, and Retirement in Europe-Methodology. Mannheim Research Institute for the
Economics of Aging (MEA): Börsch-Supan A, Jürges J; 2005:28-69.
40. Naouri D, Bussiere C, Pelletier-Fleury N. What are the determinants of dental care expenditures in institutions for adults with disabilities? Findings from a National Survey.
Archives of Physical Medicine and Rehabilitation. January 2018.
41. Calcoen P, Ven WPMM van de. How can dental insurance be optimized? Eur J Health
Econ. 2018;19(4):483-487.
42. Jones AM. Panel Data Methods and Applications to Health Economics. In: Mills TC, Patterson K, eds. Palgrave Handbook of Econometrics: Volume 2: Applied Econometrics. London: Palgrave Macmillan UK; 2009:557-631.
43. Fitzgerald J, Gottschalk P, Moffitt R. An Analysis of Sample Attrition in Panel Data:
The Michigan Panel Study of Income Dynamics. National Bureau of Economic Research;
1998.
44. Cheng TC, Trivedi PK. Attrition Bias in Panel Data: A Sheep in Wolf’s Clothing? A Case Study Based on the Mabel Survey. Health Economics. 2015;24(9):1101-1117.
TABLES
TABLE 1. Sample means of the independent variables by wave
All
waves wave 1 wave 1 wave 4 wave 5 wave 6
w6 vs w1 (%) Time-invariant characteristics Female 0.563 0.563 0.563 0.563 0.563 0.563 0% Secondary education 0.307 0.307 0.307 0.307 0.307 0.307 0% Tertiary education 0.229 0.229 0.229 0.229 0.229 0.229 0% Time-varying characteristics A. Socio-demographics Age 67.5 61.9 64.2 68.5 70.5 72.4 +17%
Living with partner 0.618 0.623 0.643 0.627 0.609 0.586 -6% Material deprivation 0.205 0.235 0.217 0.202 0.191 0.181 -23%
B. Need for care
Pre-frail 0.390 0.379 0.382 0.405 0.389 0.397 +5%
Frail 0.098 0.059 0.067 0.099 0.122 0.145 +146%
Poor self-rated health 0.303 0.220 0.284 0.322 0.333 0.354 +61%
Limit. / ADL 2+ 0.031 0.019 0.018 0.032 0.035 0.052 +174%
Limit. / IADL 2+ 0.049 0.022 0.027 0.045 0.064 0.084 +282%
Chronic conditions 2+ 0.510 0.283 0.431 0.575 0.600 0.663 +134% Depressive symptoms 3+ 0.364 0.345 0.337 0.372 0.370 0.396 +15% ADL: activities of daily living. IADL: instrumental activities of daily living
TABLE 2. Sex and age-standardized rates of health care use according to frailty status
Frailty status
Robust Pre-frail Frail
Health care use indicator SHARE waves used Obs. Adj. Rate (95% CI) Adj. Rate (95% CI) Adj. Rate (95% CI) Hospitalization Waves 1, 2, 4, 5, 6 30,390 0.097 (0.092-0.102) 0.166 (0.159-0.173) 0.301 (0.280-0.324)
Ambulatory care visit (all) Waves 1, 2, 4, 5, 6 30,390 0.879 (0.874-0.884) 0.926 (0.918-0.928) 0.975 (0.965-0.980)
GP only Waves 1, 2, 4 27,480 0.797 (0.799-0.813) 0.867 (0.856-0.871) 0.937 (0.925-0.949)
Specialist only Waves 1, 2, 4 27,480 0.439 (0.430-0.447) 0.512 (0.503-0.522) 0.648 (0.626-0.671)
Dentist visit Waves 1, 2, 5, 6 26,884 0.636 (0.627-0.644) 0.572 (0.562-0.581) 0.414 (0.389-0.439) Adj. Rate: rate standardized on sex and age.
TABLE 3. Panel data linear probability models of hospital and ambulatory care visit
Hospital admission (1/0) Ambulatory care visit (1/0)
(1) Total effect of frailty a (2) Partial effect of frailty b (1) Total effect of frailty a (2) Partial effect of frailty b Model specification Static FE Dynamic
CRE Static FE Dynamic CRE Static FE Dynamic CRE Static FE Dynamic CRE Fried's frailty Pre-frail 0.050*** 0.058*** 0.038*** 0.043*** 0.013*** 0.018*** 0.008* 0.012** Frail 0.134*** 0.144*** 0.090*** 0.097*** 0.016*** 0.021*** 0.005 0.009 Time-varying controls A. Exogenous controls
Age dummies yes yes yes yes yes yes yes yes
Time fixed effects yes yes yes yes yes yes yes yes
Time*country yes yes yes yes yes yes yes yes
B. Potentially
endogenous controls
Living with partner 0.004 0.007 -0.007 -0.008
Material deprivation 0.004 0.003 0.007 0.006 Poor SRH 0.084*** 0.094*** 0.029*** 0.030*** Limit. / ADL 2+ 0.047** 0.042* 0.007 -0.003 Limit. / IADL 2+ 0.070*** 0.072*** -0.011 -0.008 Chronic 2+ 0.037*** 0.041*** 0.041*** 0.047*** Depressive symptoms 0.008 0.007 0.006 0.003 C. Unobserved shocks
Lagged dep. variable 0.110*** 0.097*** 0.221*** 0.197***
Initial condition 0.046*** 0.031*** 0.026*** 0.016*** Time-invariant controls Female -0.025*** -0.021*** 0.007* 0.010** Secondary education 0.006 0.009 0.003 0.005 Tertiary education -0.008 0.001 0.009* 0.014*** Avg(Prefrail) † 0.075*** 0.022** 0.048*** 0.006 Avg(Frail) † 0.201*** 0.066*** 0.066*** -0.001 Avg(Partner) † -0.003 0.015*** Avg(Deprivation) † -0.018* -0.017** Avg(SHR) † 0.094*** 0.026*** Avg(ADL2+)† 0.088** -0.011 Avg(IADL2+)† -0.018 -0.018 Avg(Chronic2+)† 0.047*** 0.095*** Avg(Depress) † 0.016* 0.022***
Country fixed effects yes yes yes yes yes yes yes yes
Obs. 30,390 24,312 30,390 24,312 30,390 24,312 30,390 24,312
FE: Fixed effects. CRE : Correlated Random Effects
a
(1) total effect of frailty : model without endogenous health controls
b (2) partial effect of frailty : model including endogenous health controls
†Mean of the time-varying characteristic (Mundlak device), interpreted as between-subject differences. Note that all the associated time varying regressors were mean-centered in order to achieve this interpretation.
TABLE 4. Panel data linear probability models of GP and specialist visit
GP visit (1/0) Specialist visit (1/0)
(1) Total effect of frailty a (2) Partial effect of frailty b (1) Total effect of frailty a (2) Partial effect of frailty b Model specification Static FE Dynamic
CRE Static FE Dynamic CRE Static FE Dynamic CRE Static FE Dynamic CRE Fried's frailty Pre-frail 0.012** 0.021*** 0.008 0.012 0.027*** 0.032*** 0.017** 0.023** Frail 0.021** 0.029** 0.010 0.004 0.073*** 0.077*** 0.046*** 0.057*** Time-varying controls A. Exogenous controls
Age dummies yes yes yes yes yes yes yes yes
Time fixed effects yes yes yes yes yes yes yes yes
Time*country yes yes yes yes yes yes yes yes
B. Potentially endogenous
controls
Living with partner -0.011 -0.008 -0.013 0.006
Material deprivation 0.009 0.017** 0.011 0.005 Poor SRH 0.037*** 0.052*** 0.071*** 0.089*** Limit. / ADL 2+ -0.011 -0.014 0.005 -0.037 Limit. / IADL 2+ -0.002 -0.006 0.004 0.010 Chronic 2+ 0.031*** 0.018* 0.085*** 0.064*** Depressive symptoms 0.003 0.002 0.006 -0.001 C. Unobserved shocks
Lagged dep. variable 0.225*** 0.203*** 0.206*** 0.187***
Initial condition 0.027*** 0.012** 0.080*** 0.060*** Time-invariant controls Female 0.003 0.003 0.023*** 0.031*** Secondary education -0.003 -0.000 0.045*** 0.047*** Tertiary education -0.010 -0.004 0.097*** 0.105*** Avg(Prefrail) † 0.062*** 0.024** 0.105*** 0.027* Avg(Frail) † 0.073*** 0.031** 0.158*** 0.035 Avg(Partner) † 0.017** 0.030*** Avg(Deprivation) † -0.007 -0.069*** Avg(SHR) † 0.021** 0.112*** Avg(ADL2+)† -0.012 -0.051 Avg(IADL2+)† -0.052*** -0.037 Avg(Chronic2+)† 0.119*** 0.112*** Avg(Depress) † 0.029*** 0.044***
Country fixed effects yes yes yes yes
Obs. 27,480 18,320 27,480 18,320 27,480 18,320 27,480 18,320
FE: Fixed effects. CRE : Correlated Random Effects
a
(1) total effect of frailty : model without endogenous health controls
b (2) partial effect of frailty : model including endogenous health controls
†Mean of the time-varying characteristic (Mundlak device), interpreted as between-subject differences. Note that all the associated time varying regressors were mean-centered in order to achieve this interpretation.
TABLE 5. Panel data linear probability models of dental care use Dental care (1/0) (1) Total effect of frailty a (2) Partial effect of frailty b Model specification Static FE Dynamic
CRE Static FE Dynamic CRE Fried's frailty Pre-frail -0.005 -0.010 -0.011 -0.014* Frail -0.012 -0.031** -0.015 -0.031** Time-varying controls A. Exogenous controls
Age dummies yes yes yes yes
Time fixed effects yes yes yes yes
Time*country yes yes yes yes
B. Potentially endogenous
controls
Living with partner 0.006 0.008
Material deprivation 0.009 0.021* Poor SRH -0.016** -0.018* Limit. / ADL 2+ 0.015 0.002 Limit. / IADL 2+ -0.044*** -0.039** Chronic 2+ 0.009 0.002 Depressive symptoms 0.027*** 0.024*** C. Unobserved shocks
Lagged dep. variable 0.339*** 0.336***
Initial condition 0.001 0.004 Time-invariant controls Female 0.027*** 0.031*** Secondary education 0.077*** 0.071*** Tertiary education 0.121*** 0.111*** Avg(Prefrail) † -0.025** -0.019 Avg(Frail) † -0.129*** -0.072*** Avg(Partner) † 0.024** Avg(Deprivation) † -0.073*** Avg(SHR) † -0.033** Avg(ADL2+)† 0.084** Avg(IADL2+)† -0.130*** Avg(Chronic2+)† 0.020** Avg(Depress) † 0.022*
Country fixed effects yes yes
Obs. 26,884 20,163 26,884 20,163
FE: Fixed effects. CRE : Correlated Random Effects
a (1) total effect of frailty : model without endogenous health controls b (2) partial effect of frailty : model including endogenous health controls
†Mean of the time-varying characteristic (Mundlak device), interpreted as between-subject differences. Note that all the associated time varying regressors were mean-centered in order to achieve this interpretation.
Appendix A – Additional analyses
Content description: additional or robustness analyses for the paper HSR-18-0703 “Frailty
transitions and healthcare use in Europe.”
Table A.1. Sample size, dropouts and attrition rate by wave and initial characteristics in the unbalanced sample
Full sample
Initial characteristics (wave 1)
Poor health Chronic 2+ Frail Wave No.
individuals Survival rate Drop-outs Attrition rate Attrition rate Attrition rate Attrition rate
1 64,437
2 54,621 84,8% 9,816 15,2% 18,2% 15,7% 21,4%
4 46,792 72,6% 7,829 14,3% 17,8% 16,0% 22,6%
5 44,591 69,2% 2,201 4,7% 7,5% 7,8% 11,4%
Table A.2. Verbeek and Nijman tests of attrition bias in the unbalanced sample
HOSP DENT DOC GP SPE
Est p-value Est p-value Est p-value Est p-value Est p-value
NEXT WAVE -0.007 0.068 0.016 0.008 -0.003 0.305 -0.016 0.002 0.020 0.003
ALL WAVES -0.008 0.006 0.031 0.000 0.003 0.305 -0.002 0.575 0.023 0.000
NUMBER OF WAVES -0.005 0.000 0.011 0.000 -0.000 0.981 -0.003 0.029 0.009 0.000
(+ time-varying characteristics) yes yes yes yes yes
(+ time-invariant characteristics) yes yes yes yes yes
Obs. 64,437 53,731 64,437 45,985 45,985
NEXT WAVE: indicator of whether the individual responded in the subsequent wave ; ALL WAVES: indicator of whether the individual responded to all waves;
NUMBER OF WAVES: count of the number of waves that were observed for the individual.
Reading grid: At least one of the tests is rejected in the models of hospital use (HOSP), dentist use (DENT), GP use (GP) and specialist use (SPE).
Interpretation: Attrition is not exogenous in these models. Estimating models using the unbalanced panel without attrition correction would entail biased
Table A.3. Hausman test of fixed effects versus correlated random effects
Balanced panel Unbalanced panel
Dependent variable Chi-square P-value Obs. Chi-square P-value Obs.
Hospitalization 0 1 30,390 25.95 0.9925 64,437
Ambulatory care 0 1 30,390 28.51 0.9799 64,437
GP visit 0 1 27,480 18.8 0.9038 45,985
Specialist visit 0 1 27,480 23.26 0.7198 45,985
Table A.4. Total effect of frailty transitions on health care use. Results of alternative model specifications
Total effecta of frailty on dependent variable
Model (1) (2) (3) (4) (5) (6) FE Balanced FE Unbalanced Conditional ML Balanced Conditional ML Unbalanced Dynamic CRE Balanced Dynamic CRE Unbalanced Pr (HOSPITALIZATION) Pre-frail 0.050*** 0.051*** 0.097*** 0.112*** 0.058*** 0.059*** [0.040,0.061] [0.043,0.059] [0.035,0.159] [0.083,0.141] [0.046,0.070] [0.049,0.069] Frail 0.134*** 0.145*** 0.193*** 0.230*** 0.144*** 0.160*** [0.110,0.158] [0.128,0.162] [0.071,0.315] [0.174,0.286] [0.117,0.172] [0.140,0.181] Obs. 30,390 59,016 14,080 24,452 24,312 39,565 Pr (AMBULATORY CARE) Pre-frail 0.013*** 0.014*** 0.047*** 0.045*** 0.018*** 0.016*** [0.005,0.022] [0.008,0.021] [0.015,0.079] [0.021,0.069] [0.009,0.028] [0.008,0.024] Frail 0.016*** 0.022*** 0.120*** 0.131*** 0.021*** 0.020*** [0.005,0.028] [0.013,0.031] [0.033,0.208] [0.071,0.191] [0.007,0.033] [0.010,0.031] Obs. 30,390 59,016 8,660 14,671 24,312 39,565 Pr (GP VISIT) Pre-frail 0.012** 0.014*** 0.029** 0.030** 0.021*** 0.021*** [0.001,0.024] [0.004,0.024] [0.001,0.057] [0.006,0.055] [0.005,0.036] [0.007,0.035] Frail 0.021** 0.024*** 0.103*** 0.100*** 0.029** 0.029*** [0.003,0.038] [0.009,0.039] [0.030,0.176] [0.040,0.159] [0.006,0.051] [0.008,0.049] Obs. 27,480 39,886 8,010 10,416 18,320 23,414 Pr (SPECIALIST VISIT) Pre-frail 0.027*** 0.029*** 0.036*** 0.028*** 0.032*** 0.040*** [0.012,0.043] [0.016,0.043] [0.015,0.058] [0.009,0.048] [0.018,0.060] [0.021,0.059] Frail 0.073*** 0.081*** 0.095*** 0.077*** 0.077*** 0.083*** [0.043,0.103] [0.055,0.106] [0.053,0.138] [0.030,0.123] [0.039,0.117] [0.048,0.118] Obs. 27,480 39,886 15,294 19,846 18,320 23,414 Pr (DENTAL CARE) Pre-frail -0.005 -0.000 -0.009 -0.002 -0.010 -0.004 [0.018,0.008] [-0.011,0.010] [0.028,0.010] [-0.017,0.013] [-0.022,0.009] [-0.017,0.009] Frail -0.012 -0.021** -0.020 -0.032** -0.031** -0.040*** [0.037,0.013] [-0.039,-0.003] [0.055,0.015] [-0.061,-0.002] [-0.060,-0.002] [-0.064,-0.017] Obs. 26,884 47,944 12,640 19,480 20,163 31,543
aTotal effect: estimates from the model without endogenous health variables
FE : Fixed effects ; ML : Maximum Likelihood ; CRE : Correlated Random Effects Balanced: balanced panel (same number of observations per individual)
Unbalanced: unbalanced panel (unequal number of observations per individual) Statistical significance: ***: <1% ; **:<5% ; *<10%
Table A.5. Partial effect of frailty transitions on health care use. Results of alternative model specifications
Partial effecta of frailty on dependent variable
Model (1) (2) (3) (4) (5) (6)
FE Balanced FE Unbalanced Conditional ML Balanced Conditional ML Unbalanced Dynamic CRE Balanced Dynamic CRE Unbalanced Pr (HOSPITALIZATION) Pre-frail 0.038*** 0.034*** 0.067*** 0.071*** 0.043*** 0.039*** [0.028,0.049] [0.026,0.042] [0.019,0.115] [0.043,0.099] [0.030,0.055] [0.029,0.050] Frail 0.090*** 0.093*** 0.117*** 0.133*** 0.097*** 0.100*** [0.065,0.115] [0.075,0.111] [0.032,0.201] [0.082,0.184] [0.069,0.126] [0.078,0.122] Obs. 30,390 59,016 8,660 14,671 24,312 39,565 Pr (AMBULATORY CARE) Pre-frail 0.008* 0.008** 0.027* 0.025** 0.013** 0.009** [0.001,0.017] [0.001,0.014] [0.002,0.056] [0.003,0.046] [0.003,0.023] [0.000,0.017] Frail 0.005 0.007 0.047 0.052* 0.009 0.005 [0.008,0.018] [-0.003,0.017] [0.037,0.130] [-0.004,0.108] [-0.005,0.023] [-0.007,0.016] Obs. 30,390 59,016 8,660 14,671 24,312 39,565 Pr (GP VISIT) Pre-frail 0.008 0.008 0.017 0.017 0.013 0.012 [-0.004,0.020] [-0.002,0.018] [-0.012,0.046] [-0.009,0.042] [-0.003,0.028] [-0.003,0.026] Frail 0.010 0.012 0.074* 0.068** 0.010 0.007 [-0.008,0.029] [-0.004,0.028] [-0.004,0.151] [0.005,0.132] [-0.014,0.034] [-0.015,0.029] Obs. 27,480 39,886 8,010 10,416 18,320 23,414 Pr (SPECIALIST VISIT) Pre-frail 0.017** 0.017** 0.021* 0.013* 0.026** 0.028*** [0.001,0.033] [0.003,0.031] [-0.001,0.042] [-0.000,0.027] [0.004,0.047] [0.008,0.047] Frail 0.046*** 0.049*** 0.057** 0.040** 0.041** 0.047** [0.014,0.078] [0.022,0.076] [0.013,0.101] [0.009,0.071] [0.000,0.083] [0.010,0.084] Obs. 27,480 39,886 15,294 19,846 18,320 23,414 Pr (DENTAL CARE) Pre-frail -0.011 -0.006 -0.017 -0.010 -0.014* -0.008 [0.024,0.002] [-0.016,0.005] [0.038,0.004] [-0.027,0.007] [-0.030,0.003] [-0.022,0.006] Frail -0.015 -0.027*** -0.023 -0.040** -0.031** -0.036*** [0.041,0.011] [-0.046,-0.007] [0.062,0.016] [-0.074,-0.007] [-0.063,-0.001] [-0.062,-0.011] Obs. 26,884 47,944 12,640 19,480 20,163 31,543
a Partial effect: estimates from the model including endogenous health variables (self-rated health, ADL / IADL,
chronic diseases, depressive symptoms)
FE : Fixed effects ; ML : Maximum Likelihood ; CRE : Correlated Random Effects Balanced: balanced panel (same number of observations per individual)
Unbalanced: unbalanced panel (unequal number of observations per individual) Statistical significance: ***: <1% ; **:<5% ; *<10%
Table A.6. Effect of dentist visit on frailty
Pr (Frail) Pr (Low appetite)
FE CRE FE CRE
Dental care -0.010** -0.013*** 0.002 0.001
(0.004) (0.004) (0.004) (0.004)
Time-varying controls
Age dummies yes yes yes yes
Time fixed effects yes yes yes yes
Time*country fixed effects yes yes yes yes
Living with partner -0.007 -0.012** -0.019*** -0.022***
(0.005) (0.005) (0.006) (0.005) Material deprivation 0.015*** 0.013** 0.002 0.000 (0.005) (0.005) (0.005) (0.005) Time-invariant controls Female 0.067*** 0.031*** (0.003) (0.003) Secondary education -0.036*** -0.014*** (0.004) (0.004) Tertiary education -0.042*** -0.019*** (0.005) (0.004) Avg(Dentist care) -0.043*** -0.018*** (0.007) (0.006) Avg(Partner) 0.004 -0.003 (0.004) (0.003) Avg(Deprivation) 0.103*** 0.059*** (0.007) (0.005)
Country fixed effects no yes no no
Obs. 53,731
FE: Fixed effects; CRE: Correlated Random Effects
Low appetite: component of the frailty index, coded 1 if the appetite has diminished. Models estimated on SHARE waves 1,2,5,6 on the unbalanced panel
Table A.7. Fixed effects models with sampling weights
Hospital admission (1/0) Ambulatory care (1/0) GP visit (1/0) Specialist visit (1/0) Dental care (1/0)
Model specification No weight Sampling
weight No weight Sampling weight No weight Sampling weight No weight Sampling weight No weight Sampling weight Fried's frailty Pre-frail 0.038*** 0.041*** 0.008* 0.003 0.008 -0.002 0.017** 0.011 -0.011 -0.019** Frail 0.090*** 0.081*** 0.005 0.009 0.010 -0.004 0.046*** 0.046** -0.015 -0.036** Time-varying controls A. Exogenous controls
Age dummies yes yes yes yes yes yes yes yes yes yes
Time fixed effects yes yes yes yes yes yes yes yes yes yes
Time*country yes yes yes yes yes yes yes yes yes yes
B. Potentially endogenous
controls
Living with partner 0.004 0.006 -0.007 -0.010 -0.011 -0.006 -0.013 -0.013 0.006 -0.007
Material deprivation 0.004 -0.000 0.007 0.003 0.009 -0.001 0.011 0.010 0.009 0.009 Poor SRH 0.084*** 0.078*** 0.029*** 0.029*** 0.037*** 0.046*** 0.071*** 0.069*** -0.016** -0.014 Limit. / ADL 2+ 0.047** 0.081*** 0.007 0.003 -0.011 -0.007 0.005 -0.038 0.015 0.003 Limit. / IADL 2+ 0.070*** 0.049** -0.011 -0.010 -0.002 -0.009 0.004 0.003 -0.044*** -0.023 Chronic 2+ 0.037*** 0.034*** 0.041*** 0.044*** 0.031*** 0.035*** 0.085*** 0.086*** 0.009 0.010 Depressive symptoms 0.008 0.010 0.006 0.013** 0.003 0.008 0.006 0.023* 0.027*** 0.042*** Obs. 30,390 30,390 30,390 30,390 27,480 27,480 27,480 27,480 26,884 26,884
Sampling weight: weight defined in SHARE to ensure representativeness of the surveyed population. Additional information available in Klevmarken, A., Hesselius, P., & Swensson, B. (2005). The SHARE sampling procedures and calibrated design weights. The survey of health, aging, and retirement in europe-methodology, 28-69
Appendix B – Technical appendix
Content description: methodological details for the paper HSR-18-0703 “Frailty transitions
and healthcare use in Europe.”
1. Econometric specifications
1.1.General specification
Our aim in this paper is to explore the impact of frailty transitions on health care use. We detail below the model specifications and estimation strategies used to achieve this purpose and discuss the conditions under which our estimates can be considered as causal.
Let denote a binary indicator of health care use for outcome k (k= HOSP, DENT, DOC, GP, SPE), individual i (i=1,...,N) at time t (t=1,...,T). Let denote a vector of dummy indicators of Frieds’ frailty score being strictly higher than 0 (pre-frail) or strictly higher than 2 ((pre-frail), denote the full rank matrix of time-varying control variables, represents an unobserved individual specific term (capturing time-invariant unobserved factors affecting health care use) and represents the idiosyncratic error term (capturing time-varying unobserved shocks). The general model to be estimated is written as follows:
As is by definition a binary variable, the model we estimate is a linear probability model (LPM). In practice, it is difficult to assess which of a linear or non-linear specification is best (as noted by Angrist and Pischke, 2009, logit and probit models also rest on restrictive and un-testable assumptions concerning the distribution of the error terms and in practice, this choice may depend on the data and study objectives. Three considerations led us to the choice of a LPM over a non-linear specification: (1) we were mainly interested in computing average marginal effects (AMEs), which is not possible in the logit specification and necessitate a
posteriori approximations and additional parametric assumptions in the probit model, (2) we
had a large sample size thus the assumption of asymptotic normality for the idiosyncratic errors was reasonable 1 and (3) all independent variables were categorical thus putting less at