CARBON DYNAMICS AND MANAGEMENT IN CANADIAN BOREAL
FORESTS: TRIPLEX-FLUX MODEL DEVELOPMENT, VALIDATION,
AND APPLICATIONS
THESIS
PRESENTED
IN PARTIAL FULFILLMENT OF
THE REQUIREMENT FOR
THE DOCTORAL DEGREE IN ENVIRONMENTAL SCIENCES
BY
JIAN-FENG SUN
Avertissement
La diffusion de cette thèse se fait dans le respect des droits de son auteur, qui a signé le formulaire Autorisation de reproduire et de diffuser un travail de recherche de cycles
supérieurs (SDU-522 - Rév.ü1-2üü6). Cette autorisation stipule que «conformément
à
l'article 11 du Règlement no 8 des études de cycles supérieurs, [l'auteur] concède
à
l'Université du Québecà
Montréal une licence non exclusive d'utilisation et de publication de la totalité ou d'une partie importante de [son] travail de recherche pour des fins pédagogiques et non commerciales. Plus précisément, [l'auteur] autorise l'Université du Québecà
Montréalà
reproduire, diffuser, prêter, distribuer ou vendre des copies de [son] travail de rechercheà
des fins non commerciales sur quelque support que ce soit, y compris l'Internet. Cette licence et cette autorisation n'entraînent pas une renonciation de [la] part [de l'auteur]à
[ses] droits moraux nià
[ses] droits de propriété intellectuelle. Sauf entente contraire, [l'auteur] conserve la liberté de diffuser et de commercialiser ou non ce travail dont [il] possède un exemplaire.»DYNAMIQUE DU CARBONE ET GESTION DE LA FORET BOREALE
DU CANADA: DEVELOPPEMENT, VALIDATION ET APPLICATION
POUR LE MODELE TRIPLEX-FLUX
THÈSE
PRÉSENTÉE
COMME EXIGENCE PARTIELLE
DU DOCTORAT EN SCIENCES DE L'ENVIRONNEMENT
PAR
JIAN-FENG SUN
First of ail, 1 wou Id like to let my supervisor, Professor Changhui Peng and Co supervisor Professor Benoît St-Onge to know under their guidance, what a great experience 1 have during my Ph.D. study! Their patience, understanding, encouragement, support and good nature carried me on through difficult times, and helped me through these important years of my life to learn how to understand and simulate the natural world. Without them, this dissertation would have been impossible.
1 express my SIncere appreciation to my committee member, Professor Frank Berninger, for his advice and help in various aspects of my study. His valuable feedback helped me to improve my dissertation. 1 like ail of the interesting papers and references you chose for me to read.
Here, 1 want to send my profound thanks to Professor Harry McCaughey at Queen's University, especially for providing data and partly finance support, which is really
helpful to my first two years study.
1 am also thankful to my examiners, Professor Daniel Kneeshaw, Joël Guiot and Dr. Jianwei Liu, for their helpful comments and suggestions to improve the quality of this thesis.
Finally,I thank aIl the students and staff in both professors Changhui Peng and Benoît St-Onge laboratories for their kind assistance. 1 also enjoyed ail of the topics we have discussed. Especially, Dr. Xiaolu Zhou took lots of time to explain the code of TRIPLEX, line by line. My colleagues, Drs. Xiangdong Lei, Haibin Wu, Qiuan Zhu, Huai Chen, Dong Hua and students, Weifeng Wang and Sarah Fermet-Quinet and others provided generous support for fieldwork, data ana\ysis and French trans.lation.
Additionally, Professors Hank Margolis from Laval University, Yves Bergeron from UQAT and their groups also helped me a lot with the field inventory. l greatly appreciated their assistance.
Finally, my family, especial1y my mother Guizhi Jiang and my wife Lei Zhang, they always understood, encouraged and supported me to finish my PhD study.
The following seven manuscripts are synthesized to present my research ln this
dissertation:
Chapter II Zhou, X., Peng, C., Dang, Q.-L., Sun, J.F., Wu, H. and Hua, D. 2008
Simulating carbon exchange of Canadian boreal forests I: Model
structure, validation, and sensitivity analysis. Ecological Modelling, 219 (3-4): 276-286.
Chapter III Sun, J.F, Peng, C., McCaughey, H., Zhou, X., Thomas, V., Berninger, F., St-Onge, B. and Hua, D. 2008. Simulating Carbon Exchange of Canadian Boreal Forests II: Comparing the carbon budgets of a boreal mixedwood stand to a black spruce forest stand. Ecological Modelling, 219 (3-4): 287-299.
Chapter IV Sun, J.F., Peng, C.H., Zhou, X.L., Wu, H.B., St-Onge, B. Parameter estimation and net ecosystem productivity prediction applying the madel-data fusion approach at seven forest flux sites across North America. To be submitted to Environment Modelling & Software. Chapter V Sun, J.F., Peng, C.H., St-Onge, B. Carbon dynamics, maturity age, and
stand density management diagram of black spruce forests stands located in eastern Canada: a case study using the TRIPLEX mode!. To be submitted to Canadian Journal ofForest Research.
APPENDIX 1 G.R. Larocque, J.S. Bhatti, A.M. Gordon, N. Luckai, M. Wattenbach, J. Liu, C. Peng, P.A. Arp, S. Liu, C.-F. Zhang, A. Komarov, P. Grabamik, J.F. Sun and T. White. 2008. Unceliainty and Sensitivity Issues in Process-based Models of Carbon and Nitrogen Cycles in Terrestrial Ecosystems In: AJ. Jakeman et al., editors, Developments in Integrated Environmental Assessment vol. 3. Environmental Modelling, Software and Decision Support. p.307-327, Elsevier Science.
APPENDIX 2 Lei, X., Peng,
c.B.,
Tian, D., and Sun, J.F. 2007. Meta-analysis and its application in global change research. Chinese ScienceAPPENDIX 3 Sun, J.F., Peng,
c.B.,
St-Onge, B, Lei, X. Application of meta-analysis in quantifying the effects of soil warming on soil respiration in forest ecosystems. To be submitted to Journal of Plant Ecology.CO-AUTHORSHIP
For the papers in which 1 am the first author, 1 was responsible for setting up the hypothesis, the research methods and ideas, study area selection, model development and validation, data analysis and manuscript writing.
For the others, 1 was active in programming to develop the model using C++, model simulation, data analysis and manuscript preparation.
LIST OF FIGURES XII
ABSTRACT XXI
:ti'iU~ XXIII
LIST OF TABLES XVII
RÉSUMÉ , XVIII CHAPTER l GENERAL INTRODUCTION 1.1. BACKGROUND 1 1.2. MODEL OVERVIEW 3 1.2.1. Model types 3
1.2.2. Model application for management practices 6
1.3. HYPOTHESES 7
lA. GENERAL OBJECTIVES 7
1.5. SPECIFIC OBJECTIVES AND THESIS ORGANISATION 9
1.6. STUDY AREA 14
1.7. REFERENCES 14
CHAPTER II
SIMULATING CARBON EXCHANGE OF CANADIAN BOREAL FORESTS 1.
MODEL STRUCTURE, VALIDATION, AND SENSITIVITY ANALYSIS
2.1. RÉSUMÉ 20
2.2. ABSTRACT 21
2.3. INTRODUCTION 22
2A. MATERIALS AND METHODS 24
2A.1. Model development and description 24
2A.2. Experimental data 32
2.5.1. Model validation 33
2.5.2. Sensitivity analysis 38
2.5.3. Parameter testing 41
2.5.4. Model input variable testing 43
2.5.5. Stomatal COz flux algorithm testing 46
2.6. CONCLUSION 48
2.7. ACKNOWLEDGEMENTS 49
2.8. REFERENCES 49
CHAPTER III
SIMULATING CARBON EXCHANGE OF CANADIAN BOREAL FORESTS II.
COMPARrNG THE CARBON BUDGETS OF A BOREAL MIXEDWOOD STAND TO A BLACK SPRUCE STAND
3.1. RÉSUMÉ 55 3.2. ABSTRACT 56 3.3. INTRODUCTION 57 3.4. METHODS 58 3.4 .1. Sites description 58 3.4.2. Meteorological characteristics 62 3.4.3. Model description 62
3.4.4. Model parameters and simulations 63
3.5. RESULTS AND DISCUSSIONS 65
3.5.1. Model testing and simulations 65
3.5.2. Diurnal variations ofmeasured and simulated NEE 67
3.5.3. Monthly carbon budgets 73
3.5.4. Relationship between observed NEE and environmental variables 74
3.6. CONCLUSION 75
3.7. ACKNOWLEDGEMENTS 78
CHAPTERN
PARAMETER ESTIMATION AND NET ECOSYSTEM PRODUCTNITY
PREDICTION APPLYING THE MODEL-DATA FUSION APPROACH AT SEVEN FOREST FLUX SITES ACROSS NORTH AMERICA
4.1. RÉSUMÉ 87
4.2. ABSTRACT 88
4.3. INTRODUCTION 89
4.4. MATERIALS AND METHODS 91
4.4.1. Research sites 91
4.4.2. Model description 93
4.4.3. Parameters optimization 94
4.5. RESULTS AND DISCUSSION 97
4.5.1. Seasonal and spatial parameter variation 97
4.5.2. NEP seasonal and spatial variations 99
4.5.3. Inter-annual comparison of observed and modeled NEP 102
4.5.4. Impacts of iteration and implications and improvement for the model
data fusion approach 102
4.6. CONCLUSION 106
4.7. ACKNOWLEDGEMENTS 106
4.8. REFERENCES 106
CHAPTER V
CARBON DYNAMICS, MATURITY AGE, AND STAND DENSITY
MANAGEMENT DIAGRAM OF BLACK SPRUCE FORESTS STANDS
LOCATED IN EASTERN CANADA: A CASE SUTY USlNG THE TRIPLEX MODEL 5.1. RÉSUMÉ 112 5.2. ABSTRACT 113 5.3. INTRODUCTION 114 5.4. METHODS 117 5.4.1. Study area 117
5.4.2. TIPLEX model development... 118 5.4.3. Data sources 120 5.5. RESULTS 123 5.5 .1. Model validation 123 5.5.2. Forest dynamics 126 5.5.3. Carbon change 127
5.5.4. Stand density management diagram (SDMD 128
5.6. DISCUSSION 130
5.7. CONCLUSION 133
5.8. ACKNOWLEDGEMENTS 134
5.9. REFERENCES 134
CHAPTER VI
SYNTHESIS, GENERAL CONCLUSION, AND FUTURE DIRECTION
6.1. MODEL DEVELOPMENT 138
6.2. MODEL APPLICATIONS 138
6.2.1. Mixedwoods 138
6.2.2. Management practice challenge 139
6.3. MODEL INTERCOMPARISON 140
6.4. MODEL UNCERTATNTY 143
6.4.1. Model Uncertainty 143
6.4.2. Towards a Model-Data Fusion Approach and Carbon Forecasting 144
6.5. REFERENCES 146
APPENDIX 1
Unceltainty and Sensitivity Issues in Process-based Models of Carbon and Nitrogen
Cycles in Terrestrial Ecosystems 148
APPENDIX 2
APPENDIX 3
Application of meta-analysis in quantifying the effects of sail warming on sail
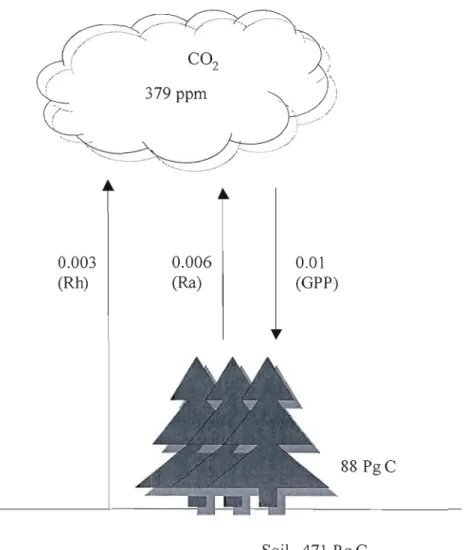
Fig. 1.1. Carbon exchange between the global boreal forest ecosystems and atmosphere, adapted from IPCC (2007), Prentice (2001) and Luyssaert et al. (2007). Rh: Heterotrophic respiration; Ra: Autotropic respiration; GPP:
Gross primary production 2
Fig. 1.2. Photosynthesis simulation of a two-Ieaf model 8
Fig. 1.3. Schematic diagram of the TRIPLEX model development, validation,
optimization, and application for forest management practices 10
Fig. 1.4. Study sites (from Davis et al, 2008, AGU 12
Fig. 2.1. The model structure of TRIPLEX-FLUX. Rectangles represent key pools or state variables, and oval represent simulation process. Solid lines represent carbon flows and the fluxes between the forest ecosystem and external environment, and dashed lines denote control and effects of environ mental variables. The Acanopy represents the sum of photosynthesis in the shaded and sunlit portion of the crowns, depending on the outcome of Vc and Vj (see
Table 1). The Ac_slInlil and Ac_shade are net CO2 assimilation rates for sunlit and shaded ieaves; the fsunlil denotes the fraction of sun lit leaf of the canopy ... 26
Fig. 2.2. The contrast of hourly simulated NEP by the TRIPLEX-FLUX and observed NEP from tower and cham ber at old black spruce site BOREAS for July in 1994, 1995, 1996, and 1997. Solid dots denote measured NEP and solid line represents simulated NEP. The discontinuances of dots and Iines present the
missing measurements of NEP and associated climate variables 35
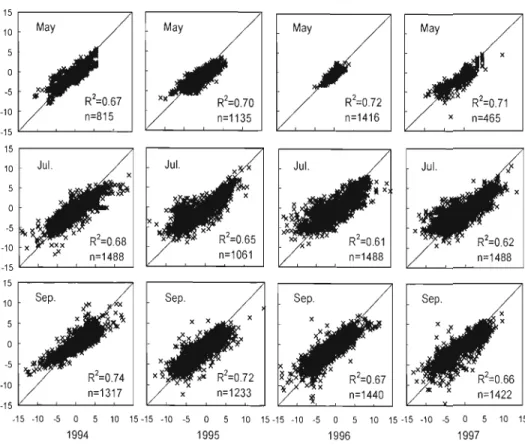
Fig. 2.3. Comparisons (with 1: 1 line) of hourly simulated NEP vs hourly observed
NEP for May, July, and September in 1994, 1995, 1996, and 1997 36
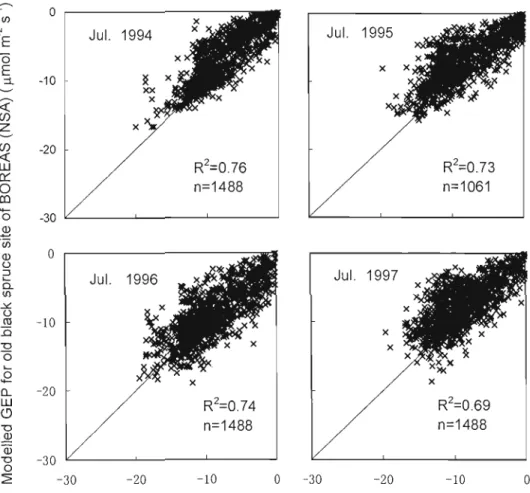
Fig. 2.4. Comparisons of hourly simulated GEP vs hourly observed GEP for July in
1994,1995,1996, and 1997 37
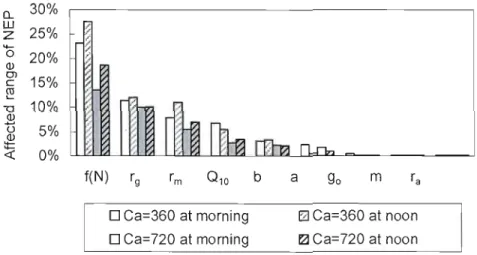
Fig. 2.5. Variations of modelled NEP affected by each parameter as shown in Table 4.
Morning and noon denote the time at 9: 00 and 13: 00 43
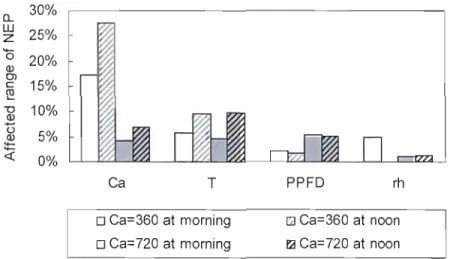
Fig. 2.6. Variations of modelled NEP affected by each model input as listed in Table 4.
Fig. 2.7. The temperature dependence of modelled NEP. Solid line denotes doubling CO2 concentration, and the dashed line represents current air CO2
concentration. The four curves represent different simulation conditions: current CO2 concentration in the morning (regular gray line) and at noon (bold gray line), and doubled CO2 concentration in the morning (regular black line) and at noon (bold black line). Morning and noon denote the time
at 9:00 and 13:00 45
Fig. 2.8. The responses of NEP simulation using coupling the iteration approach to the proportions of C/e. under different CO2 concentrations and timing. Open and solid squares denote morning and noon; dashed and solid lines represent current CO2 and doubled CO2 concentrations, respectively. Morning and
noon denote the time at 9:00 and 13:00 47
Fig. 3.1. Observations of mean monthly air temperature, PPDF, relative humidity, and precipitation during the 2004 growing season (May- August) for both OMW
and OBS 61
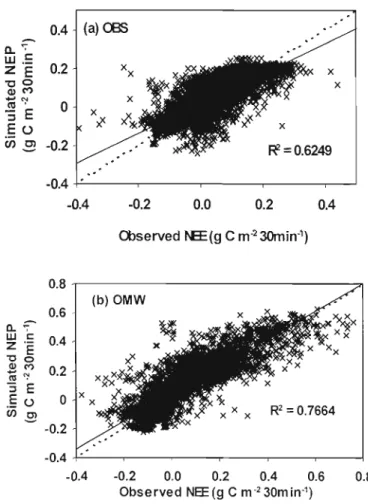
Fig. 3.2. Comparison between measured and modeled NEE for (a) old black spruce 2
(OBS) (R = 0.62, n=5904, SD =0.0605, p<O.OOOI) and Ontario boreal mixedwood (OMW) (R2= 0.77, n=5904, SD = 0.0819, p<O.OOOI) 66 Fig. 3.3. Diurnal dynamics of measured and simulated NEE during the 2004 growing
season in OMW 68
Fig. 3.4. Diurnal dynamics of measured and simulated NEE during the growing season
of2004 in OBS 69
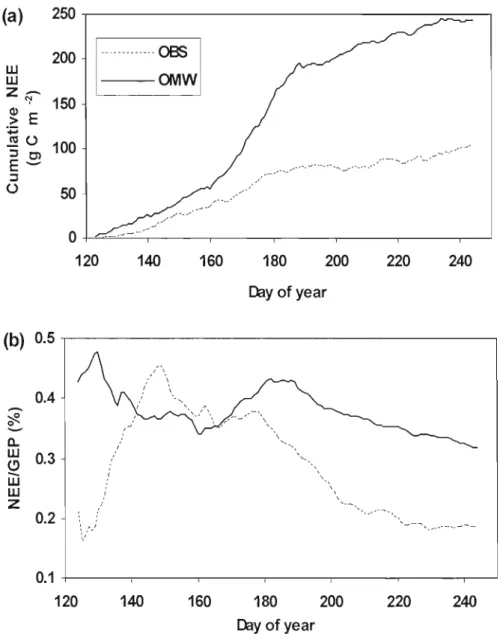
Fig. 3.5. Cumulative net ecosystem exchange ofC02 (NEE in g C m·2) (a) and ratio of NEE/GEP (b) from May to August in 2004 for both OMW and OBS ... 71 Fig. 3.6. Monthly carbon budgets for the 2004 growing season (May - August) at (a) OMW and (b) OBS. GEP: gross ecosystem productivity; NPP: net primary productivity; NEE: net ecosystem exchange; Ra: autotrophic respiration; Rh:
heterotrophic respiration 72
Fig. 3.7. Comparisons of measured and simulated NEE (in g C m'2) for the 2004 growing season (May - August) in OMW and OBS 73
Fig. 3.8. Relationship between the observations of (a) GEP (in g C m'2 day"), (b) ecosystem respiration (in g C m-2 day-l), (c) NEE (g C m,2 day'l) and mean daily temperature (in 'C). The solid and dashed lines refer to the OMW and
OBS, respectively 76
Fig. 3.9. Relationship between the observations of (a) GEP (in g C m'2 30 minutes . \ (b) NEE in g C m'2 30 minutes ,') and photosynthetic photon flux densities (PPFD) (in ~lmol m-2S-I). The symbols represent averaged half-hour values
... 77 Fig. 4.1. Schematic diagram of the model-data assimilation approach used to estimate parameters. Ra and Rb denote autotrophic and heterotrophic respiration. LAI is the Jeaf area index. Ca is the input c!imate variable CO2 concentration
(ppm) within the atmosphere. T is the air temperature (oC). RH is the relative humidity (%). PPFD is the photosynthetic photon flux density (~mol m-2 S·l)
... 90 Fig. 4.2. Seasonal variation of parameters for the different forest ecosystems under investigation (2006). DB is the broadleaf deciduous forest that includes the CA-OAS, US-Hal, and US-UMB sites (see Table 1). ENT is the evergreen needleleaf temperate forest that includes the CA-Ca l, US-Ho l, and US-Me2 sites. ENB is the evergreen needleleaf boreal forest that includes only the
CA-Obs site 97
Fig. 4.3. Comparison between observed and simulated total NEP for the different
forest types (2006) 100
Fig. 4.4. NEP seasonal variation for the different forest ecosystems under investigation (2006). EC is eddy covariance; BO is before model parameter optimization; and AO is after model parameter optimization 101 Fig. 4.5. Comparison between observed and simulated daily NEP in which the before parameter optimization is displayed in the left panel and the after parameter optimization is displayed in the right panel. ENT, DB, and ENB denote evergreen needleleaf temperate forests, three broadleaf deciduous forests, and an evergreen needleleaf boreal forest, respectively. A total of 365 plots
Fig. 4.6. Inter-annual variation of predicted daily NEP flux and observation al data for the selected BERMS- Old Aspen (CA-Oas) site from 2004 to 2007. Only 2006 observational data were used to optimize model parameters and simulated NEP. Observational data from other years were used solely as test periods. EC is eddy covariance; BO is before optimization; and AO is after
optimization 104
Fig. 4.7. Comparison bel:\veen observed and simulated NEP. A is before optimization
and B is after optimization 104
Fig. 5.1. Schematic diagram of the development of the stand density management diagram (SDMD). Climate, soil, and stand information are the key inputs that run the TRIPLEX mode!. Flux tower and forest inventory data were used to validate the mode!. Finally, the SDMD can be constructed based on model simulation results (e.g., density, DBH, height, volume, and carbon)
... 117 Fig. 5.2. Black spruce (Picea mariana) forest distribution study area located near
Chibougamau, Québec, Canada 118
Fig. 5.3. Comparisons of mean tree height and diameter at breast height (DBH) between the TRIPLEX simulations and observations taken from the sam pie
plots in Chibougamau, Québec, Canada 124
Fig. 5.4. Comparison of monthly net ecosystem productivity (NEP) simulated by TRIPLEX, including eddy covariance (EC) flux tower measurements from
2004 to 2007 125
Fig. 5.5. Dynamics of tree volume increment throughout stand development. Harvest time should be postponed by approximately 20 years to maximize forest carbon productivity. V_PAl: the periodic anImai increment of volume (m3/ha/yr); V MAl: the mean annual increment of volume (mJ/ha/yr); C_MAl: the mean annual increment of carbon productivity (g/C/m2/yr); NEP: the an nuai net ecosystem productivity; and C_PAl: the periodic annual
increment of carbon productivity (mJ/ha/yr) 126
Fig. 5.6. Aboveground biomass carbon (giC/m2) plotted against mean volume (mJ/ha) for black spruce forests located near Chibougamau, Québec, Canada ... 128
Fig. 5.7. Black spruce stand density management diagrams with log10 axes in Origin 8.0 for (a) volume (m3/ha) and (b) aboveground biomass carbon (g/C/m2), including crown closure isolines (0.13-1.0), mean diameter (cm), mean height (m), and a self-thinning line with a density of 1000, 2000, 4000, and 6000 (stems/ha), respectively. Initial density (3000 stems/ha) is the sample used for thinning management to yield more volume and uptake more carbon ... 129 Fig. 6.1. Model intercomparison (Adapted from Wang et al, CCP AGM, 2010) ... 142 Fig. 6.2. Overview of optimization techniques and a model-data fusion application in
Table 1.1. Basic information for ail study sites 13 Table 2.1. Variables and parameters used in TRJPLEX-FLUX for simulating old black
spruce of boreal forest in Canada 27
Table 2.3. The model inputs and responses used as the reference level in model sensitivity analysis. LAIs"n and LAIs" represent leaf area index for sunlit and shaded Jeaf; PPFDsun and PPFDsh denote the photosynthetic photon flux density for sunlit and shaded leaf. Morning and noon denote the time
Table 2.2. Site characteristics and stand variables 33
at 9:00 and 13:00 39
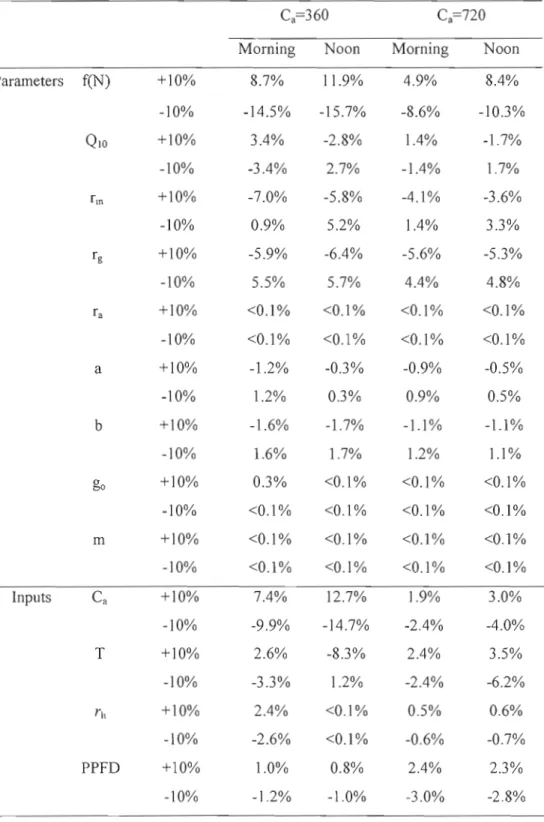
Table 2.4. Effects of parameters and inputs to model response of NEP. Morning and noon denote the time at 9:00 and 13 :00. Note that values of parameters and input variables were adjusted ±10% for testing model response 40 Table 2.5. Sensitivity indices for the dependence of the modelled NEP on the selected model parameters and inputs. Morning and noon denote the time at 9:00 and 13:00. The sensitivity indices were calculated as ratios of the change (in percentage) of model response to the given baseline of20% 41 Table 3.1. Stand characteristics of boreal mixedwood (OWM) and oid black spruce
(OBS) forest. TA, trembling aspen; WS, white spruce; BS, black spruce;
WB, white birch; BF, balsam fir 64
Table 3.2. Input and parameters used in TRJPLEX-Flux 65 Table 4.1. Basic information for ail seven study sites 92
Table 4.2. Ranges of estimated model parameters 96
Table 5.1. 2009 stand variables for the three black spruce stands under investigation for
TRJPLEX model validation 121
Table 5.2. Coefficients of nonlinear regressions of ail three equations for black spruce
Table 5.3. Change in stand density, diameter at breast height (DBH), volume, and
forests SDMD development... 130
La forêt boréale, seconde aire biotique terrestre sur Terre, est actuellement considerée comme un réservoir important de carbone pour l'atmosphère. Les modèles basés sur le processus des écosytèmes terrestres jouent un rôle important dans l'écologie terrestre et dans la gestion des ressources naturelles. Cette thèse examine le développement, la validation et l'application aux pratiques de gestion des forêts d'un tel modèle.
Tout d'abord, le module récement développé d'échange du carbone TRIPLEX-Flux (avec des intervalles de temps d'une demi heure) est utilisé pour simuler les échanges de carbone des écosystèmes d'une forêt au peuplement boréal et mixte de 75 ans dans le nord est de l'Ontario, d'une forêt avec un peuplement d'épinette noire de 110 ans localisée dans le sud de Saskatchewan, et d'une forêt avec un peuplement d'épinette noire de 160 ans située au nord du Manibota au Canada. Les résultats des échanges nets de l'écosystème (ENE) simulés par TRIPLEX-Flux sur l'année 2004 sont comparés à ceux mesurés par les "tours de mesures de covariance des turbulences" et montrent une bonne correspondance générale entre les simulations du modèle et les
observations de terrain. Le coefficient de détermination moyen (R2) est
approximativement de 0.77 pour le peuplement mixte boréal, et de 0.62 et 0.65 pour les deux forêts d'épinette noire situées au centre du Canada. Le modèle est capable d'intégrer les variations diurnes de l'échange net de l'écosystème (ENE) de la période de pousse (de mai à août) de 2004 sur les trois sites. Le peuplement boréal mixte ainsi que les peuplements d'épinette noire agissaient tous deux comme des réservoirs de carbone pour l'atmosphère durant la période de pousse de 2004. Cependant le peuplement boréal mixte montre une plus grande productivité de l'écosystème, un plus grand piégeage du carbone ainsi qu'un meilleur taux de carbone utilisé comparé aux peuplements d'épinette noire.
L'analyse de la sensibilité a mis en évidence une différence de sensibilité entre le matin et le milieu de journée, ainsi qu'entre une concentration habituelle et une concentration doublée de CO2 . De plus, la comparaison de différents algorithmes pour
calculer la conductance stomatale a montré que la production nette de l'écosystème (PNE) modelisée, utilisant une itération d'algorithme est conforme avec les résultats utilisant des rapports Ci/Ca constants de 0.74 et de 0.81 respectivement pour les concentrations courantes et doublées de CO2. Une variation des paramètres et des
données variables de plus ou moins 10% a entrainé, respectivement pour les concentrations courantes et doublées de CO2, une réponse du modèle inférieure ou
égale à 27.6% et à 27.4%. La plupart des paramètres sont plus sensibles en milieu de journée que le matin excepté pour ceux en lien avec la température de l'air, ce qui suggère que la température a des effets considérables sur la sensibilité du modèle pour ces paramètres/variables. L'effet de la température de l'air était plus important dans une atmosphère dont la concentration de CO2 était doublée. En revanche, la sensibilité
du modèle au CO2 qui diminuait lorsque la concentration de CO2 était doublée.
des hétérogeneities spacio-temporelles au coeur des écosystèmes terrestres, à la suite du développement du modèle et de l'analyse de sa sensibilité, sept sites forestiers à tour de mesures de flux (comportant trois forêts à feuilles caduques, trois forêts tempérées à feuillage persistant et une forêt boréale à feuillage persistant) ont été selectionnés pour faciliter la compréhension des variations mensuelles des paramètres du modèle. La méthode de Monte Carlo par Markov Chain (MCMC) à été appliquée pour estimer les paramètres clefs de la sensibilité dans le modèle basé sur le processus de l'écosystème, TRlPLEX-Flux. Les quatre paramètres clefs sélectionnés comportent: un taux maximum de carboxylation photosynthétique à 25°C (Ymax), un taux du transport d' un électron (Jmax) saturé en lumière lors du cycle photosynthétique de réduction du carbone , un coefficient de conductance stomatale (m), et un taux de référence de respiration à 10°C (RIO)' Les mesures de covariance des flux turbulents du COz échangé ont été assimilées afin d'optimiser les paramètres pour tous les mois de l'année 2006. Après que l'optimisation et l'ajustement des paramètres ait été réalisée, la prédiction de la production nette de l'écosystème s'est ameliorée significativement (d'environ 25%) en comparaison avec les mesures de flux de COz réalisés sur les sept sites d'écosystèmes forestiers. Les résultats suggèrent, dans le respect des paramètres sélectionnés, qu'une variabilité plus importante se produit dans les forêts à feuilles larges que dans les forêts d'arbres à aiguilles. De plus, les résultats montrent que l'approche par la fusion des données du modèle incorporant la méthode MCMC peut être utilisée pour estimer les paramètres basés sur les mesures de flux, et que des paramètres saisonniers optimisés peuvent considérablement améliorer la précision d'un modèle d'écosystème lors de la simulation de sa productivité nette et cela pour différents écosystèmes forestiers situés à travers l'Amerique du Nord.
Finalement, quelques uns de ces paramètres et algorithmes testés ont été utilisés pour mettre à jour l'ancienne version de TRIPLEX comportant des intervalles de temps mensuels. En outre, le volume d'un peuplement et la quantité de carbone de la biomasse au dessus du sol des forêts d'épinette noire au Québec sont simulés en relation avec un peuplement des âges, cela à des fins de gestion forestière. Ce modèle a été validé en utilisant à la fois une tour de mesure de flux et des données d'un inventaire forestier. Les simulations se sont averrées réussies. Les corrélations entre les données observées et les données simulées (Rz) étaient de 0.94 0.93 et 0.71 respectivement pour le diamètre à l.3m, la moyenne de la hauteur du peuplement et la productivité nette de l'écosystème. En se basant sur les résultats à long terme de la simulation, il est possible de déterminer l'âge de maturité du carbone du peuplement consideré comme prenant place à l'époque où le peulement de la forêt prélève le maximum de carbone, avant que la récolte finale ne soit realisée. Après avoir comparé l'âge de maturité du volume des peuplements considérés (d'environ 65 ans) et l'âge de maturité du carbone des peulpements considérés (d'environ 85ans), les résultats suggèrent que la récolte d'un même peuplement à son âge de maturité de volume est prématuré. Décaler la récolte d'environ vingt ans et permettre au peuplement considéré d'atteindre l'âge auquel sa maturité du carbone prend place, ménera à la formation d'un réservoir potentiellement important de carbone. Aussi, un nouveau diagramme de la gestion de la densité du carbone du peuplement considéré, basé sur les résultats de la simulation, a été développé pour démontrer quantitativement les relations entre les
densités de peuplement, le volume de peuplement et la quantité de carbone de la biomasse au dessus du sol à des stades de développement variés, dans le but d'établir des régimes de gestion de la densité optimaux pour le rendement de volume et le stockage du carbone.
Mots-Clefs: écosystème forestier, flux de CO2, production nette de l'écosystème, eddy
covariance, TRlPLEX-Flux module, validation d'un modèle, Markov Chain Monte Carlo, estimation des paramètres, assimilation des données, maturité du carbone, diagramme de gestion de la densité de peuplement
The boreal forest, Earth's second largest terrestrial biome, is currently thought to be an important net carbon sink for the atmosphere. Process-based terrestrial ecosystem models play an important role in terrestrial ecology and natural resource management. This thesis focuses on TRIPLEX model development, validation and application of the model to carbon sequestration and budget as weIl as on forest management practices impacts in Canadian boreal forest ecosystems.
Firstly, this newly developed carbon exchange module of TRIPLEX-Flux (with half hourly time step) is used to simulate the ecosystem carbon exchange of a 75-year-old boreal mixedwood forest stand in northeast Ontario, a IIO-year-old pure black spruce stand in southern Saskatchewan, and a 160-year-old pure black spruce stand in
northern Manitoba, Canada. Results of net ecosystem exchange (NEE) simulated by this model for 2004 are compared with those measured by eddy flux towers and suggest good overall agreement between model simulation and observations. The mean coefficient of determination (R2) is approximately 0.77 for the boreal mixedwood, 0.62 and 0.65 for the two old black spruce forests in central Canada. The model is able to capture the diurnal variations of NEE for the 2004 growing season in these three sites. Both the boreal mixedwood and old black spruce forests were acting as carbon sinks for the atmosphere during the 2004 growing season. However, the boreal mixedwood stand shows higher ecosystem productivity, carbon sequestration, and carbon use efficiency than the old black spruce stands.
The sensitivity analysis of TRIPLEX-flux module demonstrated different sensitivities between morning and noon, and from current to doubled atmospheric CO2
concentrations. Additionally, the comparison of different algorithms for calculating stomatal conductance shows that the modeled NEP using the iteration algorithm is consistent with the results using a constant C/Ca of 0.74 and 0.81, respectively for the current and doubled CO2 concentration. Varying parameter and input variable values
by ±IO% resulted in the model response to less than and equal to 27.6% and 27.4% for morning and noon, respectively. Most parameters are more sensitive at noon than in the morning except those that are correlated with air temperature suggesting that air tempe rature has considerable effects on the model sensitivity to these parameters/variables. The air temperature effect was greater under doubled than current atmospheric CO2 concentration. In contrast, the model sensitivity to CO2
decreased under doubled CO2 concentration.
Since prediction uncertainties of models stems mainly from spatial and temporal heterogeneities within terrestrial ecosystems, after the module deve!opment and sensitivity analysis, seven forest flux tower sites (incJuding three deciduous forests, three evergreen temperate forests, and one evergreen boreal forest) were selected to facilitate understanding of the monthly variation in model parameters. The Markov Chain Monte Carlo (MCMC) method was app! ied to estimate sensitive key parameters in this TRIPLEX-Flux process-based ecosystem module. The four key parameters
selected include a maximum photosynthetic carboxylation rate of 25°C (Vmax), an electron transport (Jmax) light-saturated rate within the photosynthetic carbon reduction cycle of leaves, a coefficient of stomatal conductance (m), and a reference respiration rate of IODC (RIO)' Eddy covariance CO2 exchange measurements were assimilated to
optimize the parameters for each month in 2006. After parameter optimization and adjustment took place, the prediction of net ecosystem production significantly improved (by approximately 25%) compared to the CO2 flux measurements taken at
these seven forest ecosystem sites. Results suggest that greater seasonal variability occurs in broadleaf forests in respect to the selected parameters than in needleleaf forests. Moreover, results show that the model-data fusion approach incorporating the MCMC method can be used to estimate parameters based upon flux measurements, and that optimized seasonal parameters can greatly improve ecosystem model accuracy when simulating net ecosystem productivity for different forest ecosystems Jocated across North America.
Finally, sorne of these well-tested parameters and algorithms were used to update and improve the old version of TRlPLEX1.0 that used monthly time steps. Furthermore, stand volume and the aboveground biomass carbon quantity of black spruce (Picea
mariana) forests in Québec are simulated in relation to stand age for forest
management purpose. The model was validated using both a flux tower and forest inventory data. Simulations proved successful. The correlations between observational data and simulated data (R2) are 0.94, 0.93, and 0.71 for diameter at breast height
(DBH), mean stand height, and net ecosystem productivity (NEP), respectively. Based on these long-term simulation results, it is possible to determine the age of forest stand carbon maturity that is believed to take place at the time when a stand uptakes the maximum amount of carbon before final harvesting occurs. After comparing the stand volume maturity age (approximately 65 years old) with the stand carbon maturity age (approximately 85 years old), results suggest that harvesting a stand at its volume maturity age is premature for carbon. Postponing harvesting by approximately 20 years and allowing the stand to reach the age at which carbon maturity takes place may lead to the formation of a potentially large carbon sink. AIso, based on the simulation results, a novel carbon stand density management diagram (CSDMD) has been developed to quantitatively demonstrate relationships between stand densities and stand volume and aboveground biomass carbon quantity at various stand developmental stages in order to determine optimal density management regimes for volume yield and carbon storage.
Keywords: forest ecosystem, CO2 flux, net ecosystem production, eddy covariance,
TRIPLEX-Flux, model validation, Markov Chain Monte Carlo, parameter estimation, data assimilation, carbon maturity, stand density management diagram
*
~ i~ Jt~;. ~
lâ i1
i~TRIPLEX~~fr T
~1mrf
t~ j];L8"J
3f
tst
~D%1iiE,
R
A:tEno
~Al t
7J*nt1*'Î.FîfJ:ffili~~
9J B1Bffl 0
52;1-ffJf7ftstB1TRIPLEX
(=F/Hl'Jff*)
~J.m:l:t~Yè*~êï5'ëBffl T:$:A~'iJ'1fdt$
(-1-75îF**~iB1m~*n
,
W"1JTIl$1W1!!'ê~Wj$ (-1-110~**~~B1-E~~~**)~R~Jt!,1EE'iJ'~tt}~ (-1-160~**~B1-E~~**)
0
:®li-'=J2004~B1~:®:i:~~.m~~~j!L~IHL$5(, R27HJIJ~o. 77,
o.
62~DO.650
t)1JçJ,-'=JJ.m~~~5IU~,#J:fi!:-3&B1,i~t~~ :tEnD~Alt7J*
nt**
~'~ÎiJ$1ï1HJE~U'8J~ ~jffi:l:B1 ~1'U;!]~0 :tE2004îF B1 'Î.
*
~,m~**~~~**~~~TA4.B1~~~fflo@~, m~**~~~~B1'Î.~*
~Jtftt'Î.F j] ~[] [l!!]~J~$
0
.~tt*~~**~~~.-'=J9J~, ~~-'=Jffi~B1A4.=~~~~~*#~,
•
~B1.~~mA~~~tto~*, tE~~~A4.=.~~*~ffi*.~~,
4.R
~ Jît~~Ét-Jj!1~~~-'=JCi/CaA'ffi:i: (:5HJU~O. 74~DO.
S1)
B1{1t'Î.~*m'Î.F jJ(NEP)
~ *~*J: -~B10
±
lO%B1~iJ&*D~:I:~1-t~i~tJHfJ~51~:lJ\T9X~T27.6%
(lf-FrJJJ
~1]27.4
(9J~) B1~z;JJo ~T 154.iffi\.~t)J;f§frB1g;iJ&~iJ&:tE9J~ ~A.~o-'=Jm~B1.~ttffi&, A4.=.~~*Jîffi~~·, 4.iffi\.B1.~tt~Ao
m~B1~M~tt~~~TMi~'Î.~*mB1~~~~~tt, tE~1-.**(-#**
~)
TWt:®:i:J3:ftti,
~~-t~~j]\PJ~~(MCMC)
7JŒ*~mT[Q1-~~.~~!J&B1
jj ~1-t;j§:M-L1J1fi5Vmax, Jmax, 4.JL
~Jî
~iJ&~D ±mrl'fQ.&~iJ&0
jffili2006~B1im:l:~~.m1!J~~iJ&:j$ rPJ1-t*D~1&1~i;L NEP1~1fJ~5IH&m~
7
25%0 fAmL MCMC7J1t
pJ
~Bffl Tl~~~rPJ
B1****~~0
It~ot1*xt52;
@~iJ&~î!j!x:~0llkJ§,
52;@~li%1iiEB1~1t:~D~iJ&*~fflTBJ:J!TRIPLEX
1.00
~tjt~t~~Jm.it* ~D ~1* iFoJ
~~1Jiii!JftiiEJ§,
ffl
-+
%1lt
R:
~ ~1*B1
*=,u~ z;j]~mm*D ~**;gl.ffi
0
ffi&J1i:,
fPJ~RNEPB1R27J\hU~O.
94, o.
93~DO.710
ItJA*JJX:]lil~(S5'i:f-)
~t~:i:JJX:1A(65
1f-)
~201f-, }Arm~**~1:\ttEJ~i~ffiBli!Jj~*=0 ~Tt~1fJ,~*, ~MfJ}UB1~~rf[ ~ IffilJ;g
r.ffi
~"PT
B:ffl T .fr**
ili~ ~f1f9:
8"J
**
**
'&
j]J§fJ.ffi
0GENERAL INTRODUCTION
1.1. BACKGROUND
Boreal forests form Earth's second largest terrestrial biome and play a significant role in the global carbon cycle, because boreal forests are currently thought to be important net carbon sinks for the atmosphere (Tans et al., 1990; Ciais et al., 1995; Sellers et al., 1997; Fan et al., 1998; Gower et al, 2001; Bond-Lamberty et al., 2004; Dunn et al., 2007). Canadian boreal forests account for about 25% of the global boreal forest and nearly 90% of the productive forest area in Canada.
Since the beginning of the Industrial Revolution, increasing human activities have increased CO2 concentration in the atmosphere and the temperature to increase (IPCC,
2001, 2007). The boreal forest ecosystem has long been recognized as an important global carbon sink, however, the pattern and mechanism responsible for this carbon sink is uncertain. Although some study areas of forest productivity are still poorly represented, a review of the relevant literature (see Fig. 1.1) suggests that there is a reasonable carbon budget of the boreal forest ecosystem at the global scale here. Actually, because of the high degree of spatial heterogeneity in sinks and sources, as weil as the anthropogenic influence on the landscape, it is particularly difficult to determine the l'ole of the boreal forest in the global carbon cycle.
Temperature of the boreal forest varies from -45 oC to 35 oC (Bond-Lamberty et al, 2005), and annual mean precipitation is 900mm (Fisher and Bonkley, 2000). However, unlike temperate forest ecosystems, the boreal forest is more sensitive to spring warming and spring time freeze events (Hollinger et al, 1994; Goulden et al, 1996; Hogg et al, 2002; Griffis et al, 2003; Tanja et al, 2003; Barr et al, 2004). Actually, climate change could have a wider array of impacts on forests in North America,
including range shifts, soil properties, tree growth, disturbance regimes, and insect and disease dynamics (Evans and Perschel, 2009).
. / ---....•(
---"
"/"--'
" /---
\... ", / ( /--- ; 379 ppm )-... ( '" 0.003 0.006 0,01 (Rh) (Ra) (GPP) 88 PgC Sail 471 Pg CNet carbon sin!< (Pg C / year)
Fig. 1.1. Carbon exchange between the global boreal forest ecosystems and atmosphere, adapted from IPCC (2007), Prentice (2001) and Luyssaert et al. (2007). Rh: Heterotrophic respiration; Ra: Autotropic respiration; GPP: Gross primary production.
There is conflicting evidence as to whether Canadian bore al forest ecosystems are currently a sink or a source for CO2. For example, the Carbon Budget Model of the Canadian Forest Sector estimated that Canadian forests might currently be a small source because of enhanced disturbances during the last three decades (Kurz and Apps 1999; Bond-Lamberty et al., 2007; Kurz et al., 2008). In contrast, BEPS-InTEC model estimated that Canadian forests are a small C sink (Chen et al. 2000). Myneni et al. (2001) combined remote sensing with provincial inventory data to demonstrate that Canadian forests have been an average carbon sink of ~0.07 Gt/yr for the last two decades. Unfortunately, previous attempts to quantitatively assess the effect of changing environmental conditions on the net boreal forest carbon balance have not taken into account competition between different vegetation types, forest management practices (harvesting and thinning), land use change, and human activities on a large scale.
1.2. MODEL OVERVIEW
There are three approaches used to assess the effects of changing environmental on forest dynamics and carbon cycles (Botkin, 1993; Landsberg and Gower 1997,): (1)
our knowledge of the past, (2) present measurements, and (3) our ability to project into the future. Our knowledge of the past and present measurements are potentially important, but have been of limited use. Long-term monitoring of the forest has proven difficult due to costs and the need for long-term commitment of individuals and institutions. Because the response of temporal and spatial patterns of forest structure and function to changing environment involves complicated biological and ecological mechanisms, current experimental techniques are not directly applicable. In contrast, models provide a means of formalizing a set of hypotheses.
To improve our understanding of terrestrial ecosystem responses to climate change, models are applied widely to simulate the effects of climate change on production, decomposition and carbon balance in boreal forests in recent years.
So far, three types of modeJs, empirical, mechanistic, and hybrid models are popular for forest ecological and c1imate change studies (Peng et al, 2002; Kimmins, 2004). Using forest measurements and observations, site dependent empirical models (e.g., forest growth and yield models) are widely applied for forest management purposes because of their simplicity and feasibility. However, these models are only suitable for predicting in the short-term and at the local scale, and Jack flexibility to account for forest damage evaluation of a sudden catastrophe (e.g., ice storm or fire) as weil as long-term environment changes (e.g. increasing temperature and CO2 concentration).
Unlike empirical models, process models are generally developed after a certain amount of knowledge has been accumuJated using empirical models, and may describe a key ecosystem process or simulate the dependence of growth on a number of interacting processes, such as photosynthesis, respiration, decomposition, and nutrient cycling. These modeJs offer a framework for testing and generating alternative hypotheses and have the potential to help us to accurately describe how these processes will interact under given environmental change (Landsberg and Gower, 1997). Consequently, their main contributions include the use of eco-physiological principles in deriving model development and specification, and long-term forecasting applicability within changing environments (Peng, 2000). Currently, the complex process-based models, although with long-term forecasting capacity in changing environment, are impossible to use to guide forest silviculture and management planning, and they still are only used in forest ecological research as a result of the need for lumped input parameters.
BEPS-InTEC (Liu et al, 1997; Chen et al. 1999, 2000), CLASS (Verseghy, 2000), ECOSYS (Grant, 2001) and IBIS (Foley, 1996) are the principal process-based models with hourly or daily time steps in use in the Fluxnet-Canada network. A critique of each model fo][ows. (1) The Boreal Ecosystem Productivity Simulator (BEPS), derived from the FOREST-BGC model family, together with the Integrated Terrestrial Ecosystem Carbon Cycle Model (TnTEC), is able to simulate net primary productivity (NPP), net ecosystem productivity (NEP) and evapotranspiration at the regional scale.
This model requires as input leaf area index (LAl) and land-cover type from remote sensing data plus sorne other environmental data (e.g., meteorological data and soil data). However, this kind of BGC model only considers the impacts of vegetation cover change on the climate, but ignores the impacts of climate change on vegetation cover change. (2) The Canadian Land Surface Scheme (CLASS) was developed by the Meteorological Service of Canada (MSC) to couple with the Canadian General Climate Model (CGCM). At the stand level, this biophysical land surface parameterization (LSP) scheme is designed to simulate the exchange of energy, water, and momentum between the surface and the atmosphere using prescribed vegetation and soil characteristics (Bartlett et al, 2003), but it neglects vegetation cover change (Foley, 1996; Wang et al, 2001; Arora 2003). Recently, like most similar models, new routines have been integrated into CLASS to simulate carbon and nitrogen dynamics in forest ecosystems (Wang et al, 2002). (3) ECOSYS is developed to simulate carbon, water, nutrient, and energy cycles in the multiple canopy layers divided into sunlit and shade leaf components and with a multilayered SOlI. Although prepared to elucidate the impacts of climate, land use practices and soil management (e.g., fertilization, tillage, irrigation, planting, harvesting, thinning) (Hanson 2004) and tested in U .S.A., Europe and Canada (Grant 2001), this model is too complicated to apply to forest management activities. (4) The Integrated BIosphere Simulator (IBIS) is an hourly Dynamic Global Vegetation Model (DGVM) developed at Wisconsin university (Kucharik et al, 2000) and has been adapted by CFS at regional and national scales. This model includes land
surface processes (energy, water, carbon and momentum balance), soil
biogeochemistry, vegetation dynamics (Iight, water and nutrients competition), and vegetation phenology modules. But this model neglects leaf nitrogen content and it is not suitable to simulate stand-Ievel processes.
To evaluate climate change impacts on the forest ecosystem and its feedback, Canadian forest resources managers need a hybrid model for forest management planning. TRlPLEX (Peng et al, 2002) is a hybrid model to understand quantitatively the consequences of forest management for stand characters, especially for sustainable yield and carbon, nitrogen and water dynamics. This model has a monthly time step
and was developed from three well-established process models: 3-PG (tree growth model) (Landsberg and Waring, 1997), TREEDYN3.0 (forest growth and yield model) (Bossel, 1996), and CENTURY (soil biogeochemistry model) (Parton et al., 1993). It is comprehensive, but it is not complicated, by concentrating on the major mechanistic processes in the forest ecosystem in order to reduce some parameters. Also, this model has been tested in central and eastern Canada using traditional forest inventories (e.g., height, DBH and volume) (Peng et al, 2002; Zhou et al, 2004).
1.2.2. Mode) application for management practices 1.2.2.1. Species composition:
Using chronosequence analyses in central Siberia (Roser et al, 2002) and central Canda (Bond-Lamberty et al, 2005), the previous studies showed that the boreal mixedwood forest sequestrated less carbon than single species forest. However, using species specific allometric models, Martin et al. (2005) indicated the net primary production (NPP) in the mixedwood forest was two times greater than in the single species forest, which contradicts with the previous two studies. Unfortunately, in these studies, the detailed physiological process and the effects on carbon flux of meteorological characteristics were not clear for the mixedwood forest, and most current carbon models have only focused on pure stands. Therefore, there is an immediate need to incorporate the mixedwood forest component into forest carbon dynamics models.
1.2.2.2. Thinning and harvesting
Forest management practices (such as thinning and harvesting) have had significant influence on carbon conservation of forest ecosystems, through changes in species composition, density and age structure (lPCC 1995, 1996). Currently, thinning and harvesting are two dominant management practices used in forest ecosystems (Davis et al. 2000). Intensive forest management practices based on short rotations and high levels of biomass utilization (e.g. whole-tree harvesting (WTH)) may significantly reduce forest site productivity, soil organic matter (SOM), and carbon budgets. Forest thinning is considered as an effective way to acce!erate tree growth, reduce mortality and increase productivity and biomass production (Smith et aL, 1997; Nabuurs et al.,
2008). On the other hand, there is a need to modify current management practices to optimize forest growth and carbon (C) sequestration under a changing environment conditions (Nuutinen et al., 2006; Garcia-Gonzalo et al., 2007). To move from conceptual to practical application of forest carbon management, there remains an urgent need to better understand how managerial activities regulate the cycling and sequestration of carbon. In the absence of long-term field trials, a process-based hybrid model (such as TRIPLEX) may provide an alternative means of examining the long term effects of management on carbon dynamics of future Canadian boreal ecosystems. Consequently, this change requires that forest resource managers make use offorest simulation models in order to make long-term decisions (Peng, 2000).
1.3. HYPOTHESIS
In this study, 1 will test three critical hypotheses using a modeling approach:
(1) Given spatial and temporal heterogeneities, some sensitive parameters should be variable across different times and regions.
(2) The mixedwood boreal forest will sequestrate more carbon than single species forests.
(3) Thinning and lengthening harvest rotations would be beneficial to adjust the density and enhance the capacity of boreal forests for carbon sequestration.
1.4. GENERAL OBJECTIVES
The overaJi objective of this study is to simulate and analyze carbon dynamics and its balance in Canadian boreal ecosystems by developing a new version of TRIPLEX Flux model. To reach this goal, 1 have undertaken the following main tasks.
TASK 1: To develop a new version of the TRIPLEX model.
So far, the big-Ieaf approach is utilized in the TRIPLEX model, which treats the whole canopy as a single leaf to estimate carbon fluxes (e.g., Sellers et al. 1996; Bonan, 1996). Since this single big-leaf model does not account for differences in the radiation absorbed by leaf classes (sunlit and shaded leaf), it will inevitably lead to estimation bias of carbon fluxes (Wang and Leuning, 1998), a two-leaf model will be developed to calculate gross primary productivity (GPP) in this study (Fig. 1.2).
In the old version of the TRIPLEX model, net primary productivity (NPP) is estimated by a constant parameter to proportionally allocate the GPP (Peng et al. 2002). In this study, maintenance respiration (Rm) and growth respiration (Rg) in different plant components (leaf, stem and root) will be estimated respectively for model development (Kimball et al, 1997; Chen et al, 1999).
Sunlit leaf
Shaded leaf
Fig. 1.2. Photosynthesis simulation of a two-Jeaf mode!.
Since spatial and temporal heterogeneities within terrestrial ecosystems may lead to prediction uncertainties in models, sorne sensitive key parameters will be estimated by data assimilation techniques to reduce simulation uncertainties.
TASK 3: To understand the effects of species composition on carbon exchange. ln the context of boreal mixedwood forest management, an important issue for carbon sequestration and cycling is whether management practices should encourage retention of mixedwood stands or convert stands to hardwoods. To better understand the impacts of forest management on boreal mixedwoods and their carbon sequestration, it is necessary to use and develop process-based simulation models that can simulate carbon exchange between forest ecosystems and the atmosphere for different forest stands over time. Carbon fluxes will then be compared between a boreal mixedwood stand and a single species stand.
TASK 4: To understand the effects of forest thinning and harvesting on carbon sequestration.
A stand density management diagram (SDMD) will be developed to quantitatively demonstrate relationships between stand densities and stand volume and aboveground biomass at various stand developmental stages in order to determine optimal density management regimes for volume yield and for carbon storage. As weIl, through long-term simulation, an optimal harvesting age will be determined to uptake maximum carbon before clear cutting.
1.5. SPECIFIC OBJECTIVES AND THESIS ORGANISATION
This thesis is a combination of four manuscripts dealing with the TRIPLEX-Flux model development, validation and application. Chapter Il will focus on TRIPLEX Flux model development. In Chapter III and IV, the TRIPLEX-Flux model will be validated against observations from different forest ecosystems in Canada and North
America. This model will be applied to forest management practices in Chapter V. The relationship between these studies is showed in Fig. 1.3.
In Chapter II, the major objectives are: (1) to describe the new TRIPLEX-Flux model structure and features and to test model simulations against flux tower measurements; and (2) to examine and quantify the effects of modeling response to parameters, input variables and algorithms of the intercellular CO2 concentrations and stomatal
conductance calculations on ecosystem carbon flux. Analyses will have significant implications for the evaluation of factors that relate to gross primaI)' productivity (GPP) as weIl as those that influence the outputs of a carbon flux model coupled with a two-Ieaf photosynthetic mode!.
In Chapter III, the TRIPLEX-Flux model is used to address the following three questions: (1) Are the diurnal patterns of half-hourly carbon flux in summer different between old mixedwood (OMW) and old black spruce (OBS) forest stands? (2) Does OMW sequester more carbon than OBS in the summer? Pursuant to this question, the differences of carbon fluxes (including GEP, NPP, and NEE) between these two types of forest ecosystems are explored for different months. Finally, (3) what is the
Forest inventory
il
Validation density DBH 1 Forest growth 1 c:::::::) 1 Output 1 height c:::::::) 1 SD MD Thinning management 1 c:::::::) LIfi
volume carbonB
Selected parametersc:=:>
1 TRIPLEX 1 !' NPP} c:::::::) 1 Output 1S
Rhl
L
NEPli
Comparison IterationB
-<
1 Flux data (V max , Jmax , m, RIo) 10000 times Optimization (MCMC) Fig. 1.3. Schematic diagram of the TRlPLEX model development, validation, optimization, and application for forest management practices.In Chapter IV, the major objectives were (1) to test TRIPLEX-Flux model simulation against flux tower measurements taken at sites containing different tree species within Canada and the United States of America; (2) to estimate certain key parameters sensitive to environmental factors by way of flux data assimilation; and (3) to understand ecosystem productivity spatial heterogeneity by quantifying the parameters for different forest ecosystems.
In Chapter V, TRIPLEX-Flux was specifically used to investigate the following three questions: (1) is there a difference between the maturity age of a conventional forest managed for volume and the optimum rotation age at which to attain the maximum carbon storage capacity? (2) If different, how much more or less time is required to reach maximum carbon sequestration? Finally, (3) what is the realtionship between stand density and carbon storage with regards to various forest developmental stages? If ail three questions can be answered with confidence then maximum carbon storage capacity should be able to be attained by thinning and harvesting in a rational and sustainable manner.
Finally, in Chapter VI, the previous Chapters' results and conclusions are integrated and synthesized. Some restrictions, limitations and uncertainties of this thesis work are summarized and discussed. The ongoing challenges and suggested directions for the future research are presented and highlighted.
Funding for this study was provided by the Canada Research Chair Program, Flllxnet Canada, the Natural Science and Engineering Research Council (NSERC), the Canadian FOllndation for Climate and Atmospheric Science (CFCAS), and the BIOCAP Foundation. We are grateful to ail of the funding groups, and to the data collection teams and data management provided by the Fluxnet-Canada and North America Carbon Program Research Network.
1NACP Interim Site Synthesis
f1"::;t PrkM-lty Solin
--1>
Table 1.1. Basic information for ail study sites State 1 Latitude(O N) 1 Forest AMT AMP Full Name Age Province Longitude(O W) type (oC) (mm) BOREAS -Old Black Spruce MB (CA) 55.88/98.48 ENB 160 -3.2 536 Groundhog River -Mixedwood ON (CA) 48.22/82.16 MW 75 2 278 Chibougamau -Mature Black Spruce QC (CA) 49.69/74.34 ENB 100 0 961 Campbell River -Mature Douglas-fir BC (CA) 49.871 125.33 ENT 60 8.3 1461 BERMS -Old Aspen SK (CA) 53.63 1 106.20 DB 83 0.4 467 BERMS -Old Black Spruce SK (CA) 53.99/105.12 ENB 111 0.4 467 Harvard Forest -EMS Tower MA (USA) 42.54/72.17 DB 81 8.3 1120 109 Howland Forest -Main Tower ME (USA) 45.20/68.74 ENT 6.7 778 Metolius -Intermediate-aged Ponderosa Pine OR (USA) 44.45/121.56 ENT 90 6.4 447 University of Michigan Biological Station MI (USA) 45.56/84.71 DB 90 6.2 750 N ote: MW
=
Mixedwood, ENB=
Evergreen needleleaf boreal forest, ENT=
evergreen needleleaf temperate forest, DB=
broadleaf deciduous forest. Adapt from CCP and NACP.1.6. STUDY AREA
This study was carried out at ten forest flux sites that were selected from 36 primary sites (Fig. 1.4) possessing complete data sets within the NACP Interim Synthesis: Site Level. Information concerning these ten forest sites is presented in Table 1.1. The study area consists of three evergreen needleleaf temperate forests (ENT), three deciduous broadleaf forests (DB), three evergreen needleleaf boreal forest (ENB) and one mixedwood boreal forest spread out across Canada and the United States of America from western to eastern coast. The dominant species includes black spruce, aspen, Douglas-fir, Ponderosa Pine, Hemlock, red spruce and so on. The !ines of latitude are from 42.5 ° N to 55.9° N. These forest ecosystems are located within different climatic regions with varied annual mean temperatures (AMT) ranging from 3.2°C to 8.3°C and annual mean precipitation (AMP) ranging from 278mm to l46lmm. The age span of these forest ecosystems ranges from 60 to 160 years old and falls within the category of middle and old aged forests, respectively.
Eddy covariance flux data, climate variables (temperature, relative humidity, and wind speed), and radiation above the canopy were recorded at the flux tower sites. Gap-filled and smoothed leaf area index (LAI) data products were accessed from the MODIS website (http://accweb.nascom.nasa.gov/) for each site under the Site-Level Synthesis of the NACP Project (Schwalm et al., in press), which contains the summary statistics for each eight day period. Before NACP Project, LAI data were collected by other Fluxnet - Canada groups (at the University of Toronto and Queen's University) (Chen et al, 1997; Thomas et al, 2006).
1.7. REFERENCES
Arora, V. K. 2003. Simulating energy and carbon fluxes over winter wheat using coupled land surface and tenestrial ecosystem models. Agricultural and Forest Meteorology, 118: 21-47.
Barr, A.G., T.J. Griffis, T.A. Black, X. Lee, R.M. Staebler, 1.D. Fuentes, Z. Chen, K.
Morgenstern. 2004. Comparing the carbon budgets of boreal and temperate deciduous forest stands. Cano 1. For. Res. 32: 813-822.
Bartlett, P.A., J.B. McCaughey, P.M. Lafleur , D.L. Verseghy. 2003. Modelling evapotranspiration at three boreal forest stands using the CLASS: tests of parameterizations for canopy conductance and soil evaporation. International Journal ofClimatology, 23: 427 - 451.
Bonan, G. B. 1996. A land surface model (LSM version 1.0) for ecological, hydrological, and atmospheric studies: Technical description and user's guide. NCAR Tech. Note NCARJTN-4171STR, 150 pp.
Bond-Lamberty, B.P., Wang, c., and Gower, S.T. 2004. Net primary production and net ecosystem production of a boreal black spruce wildfire chronosequence. Global Change Biol. 10: 473-487.
Bond-Lamberty, B, Wang, C., Gower, S.T. 2005. Spatiotemporal measurement and modeling of stand-level boreal forest soil temperatures. Agricultural and Forest Meteorology, 131: 27-40.
Bond-Lamberty, Ben, Scott D. Peckham, Douglas E. Ahl & Stith T. Gower. 2007. Fire as the dominant driver of central Canadian boreal forest carbon balance. Nature 450, 89-92.
Bossel, H. 1996. TREEDYN3 forest simulation mode!. Ecological Modelling, 90: 187
227.
Botkin, D.B., 1993, Forest Dynamics: An Ecological Model, Oxford University Press, New York.
Chen, lM., Rich, P.M., Gower, S.T., Norman, J.M., Plummer, S. 1997. Leaf area index of boreal forests: Theory, techniques, and measurements, Journal of Geophysical Research, 102, D24, 29429-29444.
Chen, lM., l Liu, J. Cihlar, M.L. Goulden. 1999. Daily canopy photosynthesis model through temporal and spatial scaling for remote sensing applications. Ecological Modelling. 124:99-119.
Chen, J. M., W. Chen, J. Liu, J. Cihlar, 2000. Annua) carbon balance of Canada's forests during 1895-1996. Global Biogeochemical Cycle, 14: 839-850.
Chen, W.J., J. M. Chen, J. Liu, and J. Cihlar, 2000. Approaches for reducing uncertainties in regional fore st carbon balance, Global Biogeochemical Cycle,
14: 827-838.
Ciais, P., P. P. Tans, M. Trolier, J. W. C. White, and R. J. Francey. 1995. A large northern hemisphere terrestrial CO2 sink indicated by the 13C/12C ratio of atmospheric CO2 . Nature, 269: 1098-1102.
Davis,L.S., K. N., Johnson P., Bettinger. 2000. Forest Management. McGraw-Hill Science, USA. pp816.
Dunn, A. L., C. C. Barford, S.c. Wofsy, M. L. Goulden, and B. C. Daube, 2007: A long-term record of carbon exchange in a boreal black spruce forest: means, responses to interannual variability and decadal trends. Global Change Biol. 13: 577-590.
Evans, A.M. and R. Perschel. 2009. A review of forestry mitigation and adaptation strategies in the Northeast U.S. Climatic Change, 96: 167-183.
Fan, S., Gloor, M., Mahlman, l, Pacala, S., Sarmiento, J., Takahashi, T., Tans, P., 1998. A Large Terrestrial Carbon Sink in North America Implied by Atmospheric and Oceanic Carbon Dioxide Data and Models. Science, 282, 442-446.
Fisher, R.F. and D., Bonkley. 2000. Ecology and management of forest soil. John Wiley & Sons Inc, Canada.
Foley, J. A, 1. C. Prentice, N. Ramankutty, S. Levis, D. Pollard, S. Sitch, A. Haxeltine. ] 996. An integrated biosphere model of land surface processes, terrestrial carbon balance, and vegetation dynamics. Global Biogeochem. Cycles. 10: 603-628.
Garcia-Gonzalo, l, Peltola, H., Briceno-elizondo, E. and Kellomaki, S., 2007. Changed thinning regimes may increase carbon stock under climate change: A case study from a Finnish boreal fore st. Clim. Change, 81:431 -454.
Gower, ST, O.N. Krankina, RJ. OIson, MJ. Apps, S. Linder and C. Wang. 2001. Net primary production and carbon allocation patterns of boreal forest ecosystems. Ecol.Appl. Il:1395-1411.
Griffis, 1. l, T.A Black, K. Morgenstern, AG.Barr, Z. Nesic, G.B. Drewitt, D. Gaumont-Guay, J.H. McCaughey. 2003.Ecophysiological contrais on the carbon balances of three southern boreal forests. Agricultural and Forest Meteorology 117:53-71.
Goulden, M. L., J. W. Munger, et al. 1996. Exchange of Carbon Dioxide by a Deciduous Forest: Response to Interannual Climate Variability. Science 271(5255): 1576-1578.
Grant, R. F. 2001. A review of the Canadian ecosystem model-ecosys. Modeling carbon and nitrogen dynamics for soil management. M. J. Shaffer, L.-W. Ma and S. Hansen. Boca Raton, Florida, USA, CRC Press: 173-264.
Hanson, P. l, l S. Amthor, S. D. Wullschleger, K. B. Wilson, R. F. Grant, A. Hartley, D. Hui, E. R. Hunt, Jr, D. W. Johnson, J. S. Kimball, A W. King, Y. Luo, S. G. McNulty, G. Sun, P. E. Thornton, S. Wang, M. Williams, D. D. Baldocchi, R. M. Cushmana 2004. Oak forest carbon and water simulations: Model intercomparisons and evaluations against independent data. Ecological Monographs, 74(3): 443-489.
Hogg, E.H., Brandt, J.P., Kochtubajda, B., 2002. Growth and dieback of aspen forests in Northwestern Alberta, Canada, in relation to climate and insects. Cano l For. Res. 32, 823-832.
Hollinger, D.Y., Kelliher, F.M., Byers, lN., Hunt, J.E., McSeveny, T.M., Weir, P.L., 1994. Carbon dioxide exchange between an undisturbed old-growth temperate forest and the atmosphere. Ecology 75, 134-150.
Johnson, D. W. and P.S. Curtis. 2001. Effects of forest management on soil C and N storage: meta analysis. Forest Ecology and Management. 140: 227-238.
Kimmins, J. P. 2004. Forest ecology: a foundation for sustainable forest management and environmental ethics in fOl'estry. Prentice Hall, Sadd le River, New Jersey. U.S,A.
Kimball, lS., P .E. Thornton, M.A. White, S.W. Running. 1997. Simulating forest productivity and surface-atmosphere carbon exchange in the BOREAS study region. Tree Physiology. 17:589-599.
Kucharik, CJ., lA. FoJey et al. 2000. Testing the Performance of a Dynamic Global Ecosystem Model: Water Balance, Carbon Balance, and Vegetation Structure. Global Biogeochem. Cycles. 14: 795-825.