AIS Electronic Library (AISeL)
AMCIS 2006 Proceedings
Americas Conference on Information Systems
(AMCIS)
12-31-2006
Mobile Phone Use in Social Settings: A
Multinational Study
Henri Isaac
University of Paris Dauphine
Robert Nickerson
San Francisco State University
Brenda Mak
San Francisco State University
Follow this and additional works at:
http://aisel.aisnet.org/amcis2006
This material is brought to you by the Americas Conference on Information Systems (AMCIS) at AIS Electronic Library (AISeL). It has been accepted for inclusion in AMCIS 2006 Proceedings by an authorized administrator of AIS Electronic Library (AISeL). For more information, please contact [email protected].
Recommended Citation
Isaac, Henri; Nickerson, Robert; and Mak, Brenda, "Mobile Phone Use in Social Settings: A Multinational Study" (2006). AMCIS
2006 Proceedings. Paper 250.
Mobile Phone Use in Social Settings:
A Multinational Study
Henri Isaac
University of Paris Dauphine
[email protected]
Robert C. Nickerson
San Francisco State University
[email protected]
Brenda Mak
San Francisco State University
[email protected]
ABSTRACT
Mobile commerce relies extensively on mobile phones, which, unlike wired e-commerce client computers, can be used anywhere and anytime and consequently are often used in social situations including restaurants, theaters, and buses. Use of mobile phones in these environments affects not only the user but also co-located people who can be bothered by ringing phones, overheard conversations, and clicking keys. How people perceive the impact of mobile phones in these situations may vary by user factors such as age and work status, and by the culture of the country in which the user is located. We have conducted a multinational study of attitudes about mobile phone use in social situations to which we have received over 1000 responses from five countries. This paper presents the first results from this study.
Keywords
Mobile phone, cell phone, social attitudes, multinational
INTRODUCTION
Mobile commerce relies extensively on mobile (cell) phones to connect users to mobile service providers through voice and text messaging. Unlike wired e-commerce, however, m-commerce often takes place in social settings in which users and co-located people may be affected, including restaurants, theaters, classrooms, and sidewalks. Consequently, mobile service providers must understand attitudes about mobile phone use in these settings in order for m-commerce to be successful; otherwise, they may offer mobile services in situations that can negatively impact users and others. The general purpose of this research is to investigate social attitudes about mobile phone use.
Mobile phone technology has a paradoxical impact on people with both benefits and consequences. Arnold (2003) examined the many “Janus-faces” of mobile phones including liberating and leashed, private and public, and connected and distant. Jarvenpaa and Lang (2005) identified eight paradoxes of mobile technology such as empowerment and enslavement, independence and dependence, and fulfills needs and creates needs. In this paper we take as given the benefits of mobile phone technology and focus exclusively on the other side of the paradox.
The purpose of this research is to examine attitudes about mobile phone use in social settings in several countries. This paper presents the results of a large international survey about these attitudes. Because of the widespread use of text (SMS) messaging, or texting for short, we include it along with voice use of mobile phones in our study. First we review literature on mobile phones including their social use, the role of location and time in their use, and the effect of user and environmental factors on their use. Then we present our hypotheses, describe our research methodology, and present our results and analysis. Finally we discuss our results and give our conclusion.
BACKGROUND
Social Use of Mobile Phones
Mobile phones can interrupt social interactions. When a user receives a mobile phone call or a text message while interacting with others, the user must decide whether to accept the call or read the message and interrupt the interaction. The user’s
decision may depend on whether they are at work or with family or friends. It also may depend on factors such as the user’s age or experience using a mobile phone. Palen, Salzman, and Youngs (2001) showed that a person’s attitude towards public mobile phone use becomes more accepting with increased use. Palen (2002) predicted that as adoption of mobile phones increases, people will be less concerned about appropriate use, but will still call for “mobile-free” zones.
Plant (2001) reported that people have three types of attitudes about taking a call when others are present: move away from the social situation (“flight”), remain in place but removed from the social engagement (“suspension”), stay engaged socially (“persistence”). Weilenmann and Larsson (2001) came to the same result when studying teenagers’ mobile phone use in Sweden. Murtagh (2001), studying the attitude of people receiving a mobile phone call on trains, showed that people try to create a private space in a limited public space. Licoppe and Heurtin (2001) showed that French people adopt different strategies about giving their private phone number in order not to be disturbed.
Location and Time of Mobile Phone Use
The role of location and time of mobile phone use has been studied. Because mobile phones can be used almost anywhere and anytime, they can be used in locations and at times that people may consider inappropriate (e.g., a theater during a performance). In many settings co-located people can be annoyed by their use (Ling 1996, Ling and Haddon 2003). Wei and Leung (1999) found ringing phones, loud talking, and discourteous use are annoyances mobile phones can create, and that users and non-users agree it is inappropriate to use mobile phones in restaurants, schools, libraries, airports, train stations, and hospitals. Ling and Haddon (2003) reported that mobile phone users in France, Germany, Italy, Spain and the U.K. were least likely to leave their mobile phones on “when attending some event like a play or show, adhering to the rules of those particular settings.”
User and Environmental Factors
The impact of mobile phone use may be affected by user characteristics such as gender, age, length of mobile phone use, and employment status. In may also be affected by the factors specific to the user’s country.
From their research on the gendered nature of mobile phone culture in Israel, Lemish and Cohen (2005) concluded that there might be different attitudes among men and women toward mobile phones. Rakow and Navarro (1993) noted that the mobile phone “seems to be an extension on the public world when used by men, an extension of the private world when used by women”. This study, however, concludes that perceptions of mobile phones among men and women are almost the same. Much research of mobile phones focuses on teenagers. A study of French mobile phone users shows that age is the key variable to understanding the differences in attitudes and behaviors (Observatoire Societal du telephone mobile 2005). Certain country factors such as legal environment and national culture may also affect both the user of a mobile phone and co-located individuals. Some countries have laws related to mobile phone use, such as banning mobile phone use while driving.
Few cross-cultural studies of mobile phone use have been conducted. One by Carlson, Kahn, and Rowe (1999), which examined the impact of mobile phone use on decision-making among sales organizations in the U.S. and France, found that mobile phone use predicted changes in certain independent variables more accurately in the U.S. than in France.
HYPOTHESES
We hypothesize that user characteristics, length of mobile phone use, and country of use will affect user preferences for mobile phone use in different social settings. Our dependent variables are user preferences for prohibiting mobile phone voice use and texting in different social settings (while driving, in the classroom, on public transportation, while walking, in public restrooms, in restaurants, in theaters). Our factors are the user’s country, age, gender, length of mobile phone use, and work status. Specifically, we hypothesize the following with respect to users:
H1a: country affects preference for mobile phone voice use. H1b: country affects preference for mobile phone texting. H2a: age affects preference for mobile phone voice use. H2b: age affects preference for mobile phone texting.
H3a: gender affects preference for mobile phone voice use. H3b: gender affects preference for mobile phone texting.
H4a: length of mobile phone use affects preference for mobile phone voice use. H4b: length of mobile phone use affects preference for mobile phone texting. H5a: work status affects preference for mobile phone voice use.
H5b: work status affects preference for mobile phone texting.
RESEARCH METHODOLOGY
Our research methodology involved a paper-based questionnaire, which was developed in English through an iterative process involving a U.S. researcher not associated with this paper and the first and second authors. The first author translated the questionnaire into French and colleagues in Italy, Turkey, and Finland translated it into their respective languages. Because of conference-imposed space limitations, we do not include the questionnaire in this paper and we only describe the parts of the questionnaire related to the analysis we report here. The complete questionnaire is available from the authors. The questionnaire includes background questions classifying users by such factors as age, gender, length of mobile phone use, and work status. The country in which the user uses a mobile phone is identified by the location where the questionnaire was administered.
Because a user can use a mobile phone for voice and texting we include separate but parallel questions for each mode of communication. For each mode we ask for the respondent’s strength of agreement regarding the prohibition of mobile phone use in the following social situations: while driving, in the classroom, on public transportation, while walking, in public restrooms, in restaurants, in theaters. We also ask for the respondent’s strength of agreement with the statement “I feel lost without my cell phone” as it relates to each mode of communication. These questions form eight subscales used in the analysis. Responses to all questions were on a 1 to 7 Likert scale indicating strong disagreement (1) to strong agreement (7). The questionnaire was administered to self-selected undergraduate and graduate business students in the United States, France, Italy, Turkey, and Finland. All students either owned or had full time use of a mobile phone at the time of the survey. 1079 valid questionnaires were returned distributed as follows: USA 332, France 272, Italy 198, Finland 75, Turkey 202. Table 1 shows the characteristics of the respondents.
Gender Male 46.0% Female 53.9% NR 0.1% Age (years) < 20 7.7% 20 – 22 39.6% 23 – 25 31.2% 26 – 30 11.7% > 30 9.4% NR 0.5% Work status Working 45.4% Non-working 54.4% NR 0.2%
Length of mobile phone use (years)
< 1 5.1% 1 – 2 8.0% 2 – 3 14.7% 3 – 4 19.3% 4 – 5 19.2% > 5 33.6% NR 0.1%
RESULTS AND ANALYSIS
We studied the effects of the user’s age, gender, length of mobile phone use, work status, and country on user perceptions of mobile phone use for voice and texting. The GLM multivariate procedure in SPSS 12 was used to conduct MANOVA to analyze the effects of these factors.
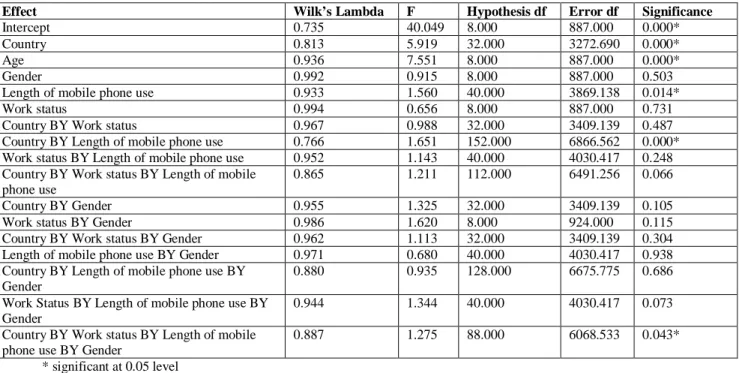
Mobile Phone Use for Voice
The overall effects of the factors were assessed using Wilk’s lambda. Table 2 shows that there is a significant difference in user perceptions of mobile phone use for voice (collapsed across the eight subscales for voice) due to country, age, and length of mobile phone use. Thus H1a, H2a, H4a are accepted at the 0.05 significance level. The effects of gender and work status are not significant, and H3a and H5a are rejected. The following interaction effects are significant: country by length of mobile phone use, country by work status by length of mobile phone use by gender.
Effect Wilk’s Lambda F Hypothesis df Error df Significance
Intercept 0.735 40.049 8.000 887.000 0.000* Country 0.813 5.919 32.000 3272.690 0.000* Age 0.936 7.551 8.000 887.000 0.000* Gender 0.992 0.915 8.000 887.000 0.503 Length of mobile phone use 0.933 1.560 40.000 3869.138 0.014* Work status 0.994 0.656 8.000 887.000 0.731 Country BY Work status 0.967 0.988 32.000 3409.139 0.487 Country BY Length of mobile phone use 0.766 1.651 152.000 6866.562 0.000* Work status BY Length of mobile phone use 0.952 1.143 40.000 4030.417 0.248 Country BY Work status BY Length of mobile
phone use
0.865 1.211 112.000 6491.256 0.066 Country BY Gender 0.955 1.325 32.000 3409.139 0.105 Work status BY Gender 0.986 1.620 8.000 924.000 0.115 Country BY Work status BY Gender 0.962 1.113 32.000 3409.139 0.304 Length of mobile phone use BY Gender 0.971 0.680 40.000 4030.417 0.938 Country BY Length of mobile phone use BY
Gender
0.880 0.935 128.000 6675.775 0.686 Work Status BY Length of mobile phone use BY
Gender
0.944 1.344 40.000 4030.417 0.073 Country BY Work status BY Length of mobile
phone use BY Gender
0.887 1.275 88.000 6068.533 0.043* * significant at 0.05 level
Table 2. Effects of user characteristics and country on user perceptions of voice use
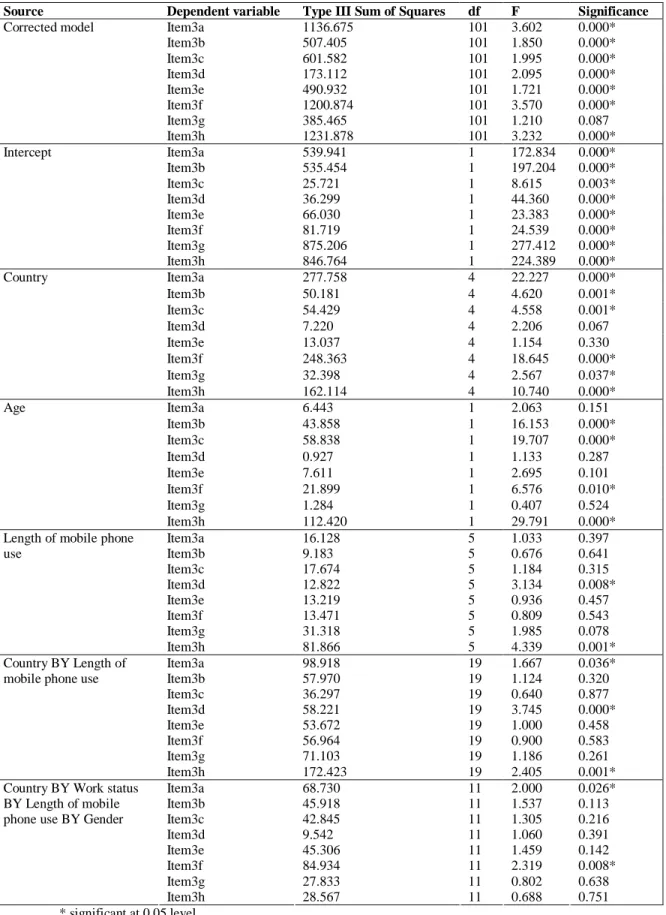
For variables with significant multivariate effects on user perception of voice use, the effects were further examined to determine whether the independent variables were significant for each item of user perception of voice use. Table 3 displays the result. (See Table 4 for the item codes.) Table 5 summarizes whether the effect on each item for user perception of voice use is significant at the 0.05 level.
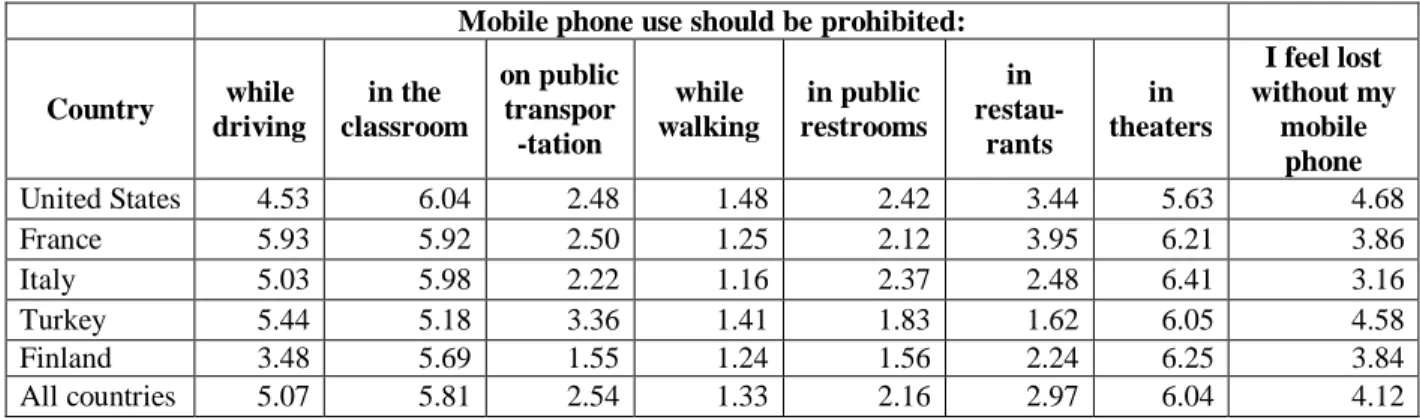
Table 6 gives the mean response to each question about prohibiting mobile phone use for voice by country. From Table 5, country is the only primary factor accounting for a significant difference in user perceptions of mobile phone use for voice while driving. Table 6 shows that France had the highest mean score agreeing with the prohibition of mobile phone use for voice while driving and Finland the lowest. From Table 5, country is the only primary factor accounting for significant difference in user perceptions of mobile phone use for voice in theaters. Table 6 shows that Italy had the highest mean score agreeing with the prohibition of mobile phone use for voice in theaters and the United States the lowest.
Source Dependent variable Type III Sum of Squares df F Significance Item3a 1136.675 101 3.602 0.000* Item3b 507.405 101 1.850 0.000* Item3c 601.582 101 1.995 0.000* Item3d 173.112 101 2.095 0.000* Item3e 490.932 101 1.721 0.000* Item3f 1200.874 101 3.570 0.000* Item3g 385.465 101 1.210 0.087 Corrected model Item3h 1231.878 101 3.232 0.000* Item3a 539.941 1 172.834 0.000* Item3b 535.454 1 197.204 0.000* Item3c 25.721 1 8.615 0.003* Item3d 36.299 1 44.360 0.000* Item3e 66.030 1 23.383 0.000* Item3f 81.719 1 24.539 0.000* Item3g 875.206 1 277.412 0.000* Intercept Item3h 846.764 1 224.389 0.000* Item3a 277.758 4 22.227 0.000* Item3b 50.181 4 4.620 0.001* Item3c 54.429 4 4.558 0.001* Item3d 7.220 4 2.206 0.067 Item3e 13.037 4 1.154 0.330 Item3f 248.363 4 18.645 0.000* Item3g 32.398 4 2.567 0.037* Country Item3h 162.114 4 10.740 0.000* Item3a 6.443 1 2.063 0.151 Item3b 43.858 1 16.153 0.000* Item3c 58.838 1 19.707 0.000* Item3d 0.927 1 1.133 0.287 Item3e 7.611 1 2.695 0.101 Item3f 21.899 1 6.576 0.010* Item3g 1.284 1 0.407 0.524 Age Item3h 112.420 1 29.791 0.000* Item3a 16.128 5 1.033 0.397 Item3b 9.183 5 0.676 0.641 Item3c 17.674 5 1.184 0.315 Item3d 12.822 5 3.134 0.008* Item3e 13.219 5 0.936 0.457 Item3f 13.471 5 0.809 0.543 Item3g 31.318 5 1.985 0.078 Length of mobile phone
use Item3h 81.866 5 4.339 0.001* Item3a 98.918 19 1.667 0.036* Item3b 57.970 19 1.124 0.320 Item3c 36.297 19 0.640 0.877 Item3d 58.221 19 3.745 0.000* Item3e 53.672 19 1.000 0.458 Item3f 56.964 19 0.900 0.583 Item3g 71.103 19 1.186 0.261 Country BY Length of
mobile phone use
Item3h 172.423 19 2.405 0.001* Item3a 68.730 11 2.000 0.026* Item3b 45.918 11 1.537 0.113 Item3c 42.845 11 1.305 0.216 Item3d 9.542 11 1.060 0.391 Item3e 45.306 11 1.459 0.142 Item3f 84.934 11 2.319 0.008* Item3g 27.833 11 0.802 0.638 Country BY Work status
BY Length of mobile phone use BY Gender
Item3h 28.567 11 0.688 0.751 * significant at 0.05 level
Item code User perception
Item3a while driving
Item3b in the classroom Item3c on public transportation
Item3d while walking
Item3e in public restrooms Item3f in restaurants Item3g
Mobile phone use for voice should be prohibited
in theaters Item3h I feel lost without my mobile phone
Table 4. Item codes for voice use
Mobile phone use for voice should be prohibited: Source of effect while driving in the classroom on public transpor-tation while walking in public restrooms in restau -rants in theaters I feel lost without my mobile phone
Country yes yes yes no no yes yes yes
Age no yes yes no no yes no yes
Length of mobile phone use no no no yes no no no yes Country BY Length of mobile phone use
yes no no yes no no no yes
Country BY Work status BY Length of mobile phone use BY Gender yes no no no no yes no no
Table 5. Significance of individual items for voice use (0.05 level)
Mobile phone use should be prohibited:
Country while driving in the classroom on public transpor -tation while walking in public restrooms in restau-rants in theaters I feel lost without my mobile phone United States 4.53 6.04 2.48 1.48 2.42 3.44 5.63 4.68 France 5.93 5.92 2.50 1.25 2.12 3.95 6.21 3.86 Italy 5.03 5.98 2.22 1.16 2.37 2.48 6.41 3.16 Turkey 5.44 5.18 3.36 1.41 1.83 1.62 6.05 4.58 Finland 3.48 5.69 1.55 1.24 1.56 2.24 6.25 3.84 All countries 5.07 5.81 2.54 1.33 2.16 2.97 6.04 4.12
Table 6. Mean response to questions about prohibition of mobile phone use for voice by country
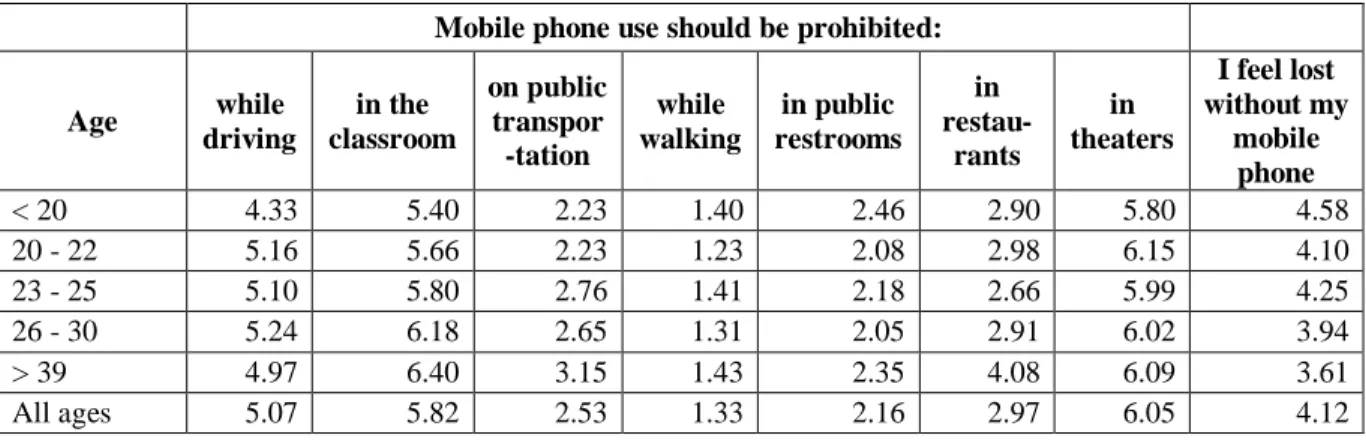
Table 7 gives the mean response to each question about prohibiting mobile phone use for voice by age. From Table 5, both country and age have significant effect on the difference in user perceptions of mobile phone use for voice in the classroom, on public transportation, and in restaurants. Table 6 shows that the United States had the highest mean score agreeing with the prohibition of mobile phone for voice in the classroom and Turkey the lowest. Table 7 shows that older people tend to agree more with the prohibition of mobile phone use for voice in the classroom, on public transportation, and in restaurants.
Mobile phone use should be prohibited: Age while driving in the classroom on public transpor -tation while walking in public restrooms in restau-rants in theaters I feel lost without my mobile phone < 20 4.33 5.40 2.23 1.40 2.46 2.90 5.80 4.58 20 - 22 5.16 5.66 2.23 1.23 2.08 2.98 6.15 4.10 23 - 25 5.10 5.80 2.76 1.41 2.18 2.66 5.99 4.25 26 - 30 5.24 6.18 2.65 1.31 2.05 2.91 6.02 3.94 > 39 4.97 6.40 3.15 1.43 2.35 4.08 6.09 3.61 All ages 5.07 5.82 2.53 1.33 2.16 2.97 6.05 4.12
Table 7. Mean response to questions about prohibition of mobile phone use for voice by age
Mobile Phone Use for Texting
As shown in Table 8, the multivariate tests using Wilk’s lambda show that there is a significant difference in user perceptions of mobile phone use for texting (collapsed across the eight subscales for texting) due to country, age, length of mobile phone use, and gender. Thus H1b, H2b, H3b, H4b are accepted at the 0.05 significance level. The effect of work status is not significant, and H5b is rejected. In addition, the following interaction effects are significant: country by length of mobile phone use, country by length of mobile phone use by gender, country by work status by length of mobile phone use by gender.
Effect Wilk’s Lambda F Hypothesis df Error df Significance
Intercept 0.515 108.826 8.000 924.000 0.000* Country 0.733 9.373 32.000 3409.139 0.000* Age 0.943 7.014 8.000 924.000 0.000* Gender 0.979 2.487 8.000 924.000 0.011* Length of mobile phone use 0.919 1.963 40.000 4030.417 0.000* Work status 0.991 1.008 8.000 924.000 0.428 Country BY Work status 0.970 0.854 32.000 3272.690 0.702 Country BY Length of mobile phone
use 0.752 1.701 152.000 6592.162 0.000* Work status BY Length of mobile
phone use 0.947 1.223 40.000 3869.138 0.159 Country BY Work status BY Length of
mobile phone use 0.867 1.140 112.000 6231.790 0.150 Country BY Gender 0.969 0.889 32.000 3272.690 0.647 Work status BY Gender 0.988 1.369 8.000 887.000 0.206 Country BY Work status BY Gender 0.968 0.898 32.000 3272.690 0.632 Length of mobile phone use BY Gender 0.959 0.930 40.000 3869.138 0.596 Country BY Length of mobile phone
use BY Gender 0.833 1.283 128.000 6408.965 0.018* Work Status BY Length of mobile
phone use BY Gender 0.941 1.351 40.000 3869.138 0.070 Country BY Work status BY Length of
mobile phone use BY Gender 0.881 1.286 88.000 5825.907 0.038* * significant at 0.05 level
Table 8. Effects of user characteristics and country on user perceptions of texting
For variables with significant multivariate effects on user perception of texting, the effects were further examined to determine whether the independent variables were significant for each item of user perception of texting. Table 9 displays the result. (See Table 10 for item codes.) Table 11 summarizes whether the effect on each item for user perception of texting is significant at the 0.05 level.
Source Dependent variable Type III Sum of Squares df F Significance Item8a 544.483 101 1.560 0.001* Item8b 1072.876 101 2.354 0.000* Item8c 270.140 101 1.725 0.000* Item8d 304.092 101 1.847 0.000* Item8e 323.598 101 1.740 0.000* Item8f 304.865 101 1.671 0.000* Item8g 953.841 101 1.990 0.000* Corrected model Item8h 1986.687 101 1.695 0.000* Item8a 609.772 1 176.472 0.000* Item8b 33.352 1 7.391 0.007* Item8c 39.346 1 25.376 0.000* Item8d 37.709 1 23.136 0.000* Item8e 69.089 1 37.523 0.000* Item8f 61.118 1 33.828 0.000* Item8g 124.042 1 26.136 0.000* Intercept Item8h 959.848 1 82.735 0.000* Item8a 16.556 4 1.198 0.310 Item8b 87.664 4 4.857 0.001* Item8c 41.340 4 6.665 0.000* Item8d 71.009 4 10.892 0.000* Item8e 31.105 4 4.223 0.002* Item8f 43.007 4 5.951 0.000* Item8g 140.604 4 7.406 0.000* Country Item8h 137.811 4 2.970 0.019* Item8a 15.291 1 4.425 0.036* Item8b 193.148 1 42.805 0.000* Item8c 1.701 1 1.097 0.295 Item8d 2.543 1 1.560 0.212 Item8e 0.046 1 0.025 0.875 Item8f 0.099 1 0.055 0.815 Item8g 17.698 1 3.729 0.054 Age Item8h 208.352 1 17.959 0.000* Item8a 26.969 5 1.561 0.169 Item8b 29.822 5 1.322 0.252 Item8c 6.378 5 0.823 0.534 Item8d 4.977 5 0.611 0.692 Item8e 16.204 5 1.760 0.118 Item8f 4.143 5 0.459 0.807 Item8g 28.628 5 1.206 0.304 Length of mobile phone use Item8h 137.450 5 2.370 0.038* Item8a 3.882 1 1.124 0.289 Item8b 3.375 1 0.748 0.387 Item8c 0.418 1 0.270 0.604 Item8d 1.287 1 0.790 0.374 Item8e 1.451 1 0.788 0.375 Item8f 3.168 1 1.753 0.186 Item8g 0.310 1 0.065 0.798 Gender Item8h 31.348 1 2.702 0.101 Item8a 99.016 19 1.508 0.075 Item8b 147.968 19 1.726 0.027* Item8c 48.702 19 1.653 0.039* Item8d 50.856 19 1.642 0.041* Item8e 53.884 19 1.540 0.065 Item8f 45.303 19 1.320 0.162 Item8g 192.902 19 2.139 0.003* Country BY Length of mobile phone use Item8h 239.231 19 1.085 0.360
Item8a 59.605 16 1.078 0.372 Item8b 48.953 16 0.678 0.818 Item8c 19.350 16 0.780 0.710 Item8d 19.103 16 0.733 0.762 Item8e 46.902 16 1.592 0.065 Item8f 41.580 16 1.438 0.116 Item8g 227.801 16 3.000 0.000* Country BY Length of mobile phone use BY Gender Item8h 163.012 16 0.878 0.595 Item8a 48.833 11 1.285 0.228 Item8b 92.685 11 1.867 0.040* Item8c 16.784 11 0.984 0.459 Item8d 10.385 11 0.579 0.847 Item8e 50.464 11 2.492 0.004* Item8f 43.154 11 2.171 0.014* Item8g 51.560 11 0.988 0.456 Country BY Work status BY Length of mobile phone use BY Gender Item8h 38.489 11 0.302 0.986 * significant at 0.05 level
Table 9. Tests of between-subjects effects on perceptions of texting
Item code User perception
Item8a while driving Item8b in the classroom Item8c on public transportation Item8d while walking
Item8e in public restrooms Item8f in restaurants Item8g
Texting should be prohibited
in theaters Item8h I feel lost without my mobile phone
Table 10. Item codes for texting
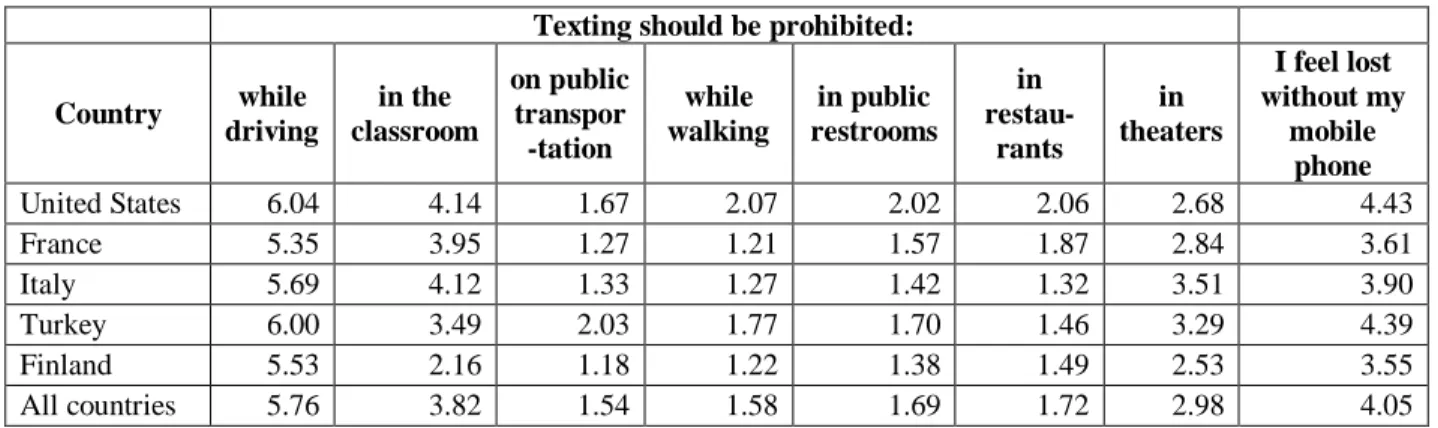
Table 12 gives the mean response to each question about prohibiting texting by country. From Table 11, country is the only primary factor accounting for a significant difference in user perceptions of the prohibition of texting on public transportation, while walking, in public restrooms, restaurants, and theaters. Table 12 shows that respondents across different countries disagree with the prohibition of texting on public transportation, with Finland showing the strongest disagreement. Table 12 also shows that respondents disagree with the prohibition of texting while walking, with France and Finland showing the strongest disagreement. Table 12 indicates that respondents from different countries disagree with the prohibition of texting in public restrooms and restaurants, with Finland indicating the strongest disagreement to such prohibition in public restrooms, and Italy indicating the strongest disagreement to such the prohibition in restaurants. Finally, Table 12 indicates that respondents’ perceptions of the prohibition of texting in theatres differ across countries with Italy agreeing with such prohibition, and the United States and Finland disagreeing.
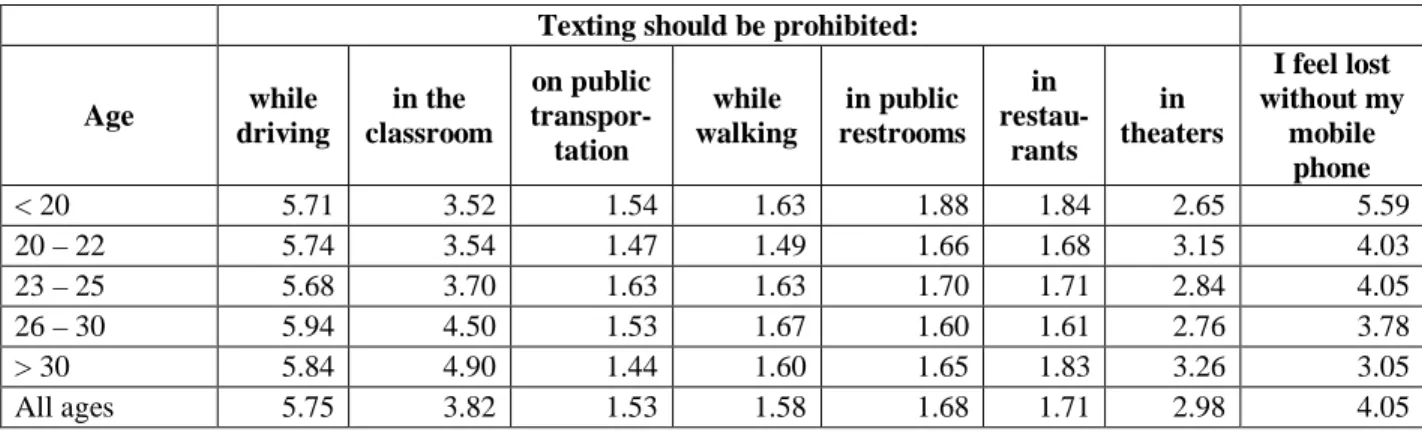
Table 13 gives the mean response to each question about prohibiting texting by age. From Table 11, age is the only primary factor accounting for a significant difference in user perceptions of texting while driving. Table 13 shows that the 26 to 30 age group has the strongest agreement with such prohibition.
Finally, from Table 11, user perceptions of the prohibition of mobile phone use for texting in the classroom differs significantly across countries and age groups. Table 12 shows that the United States and Italy agree with the prohibition of texting in the classroom and Finland disagrees. Table 13 shows that older people agree more with the prohibition of texting in the classroom.
Texting should be prohibited: Source of effect while driving in the classroom on public transpor-tation while walking in public restrooms in restau-rants in theaters I feel lost without my mobile phone
Country no yes yes yes yes yes yes yes
Age yes yes no no no no no yes
Length of mobile phone use no no no no no no no yes Gender no no no no no no no no Country BY Length of mobile phone use
no yes yes yes no no yes no
Country BY Length of mobile phone use BY Gender no no no no no no yes no Country BY Work status BY Length of mobile phone use BY Gender
no yes no no yes yes no no
Table 11. Significance of individual items for texting (0.05 level)
Texting should be prohibited:
Country while driving in the classroom on public transpor -tation while walking in public restrooms in restau-rants in theaters I feel lost without my mobile phone United States 6.04 4.14 1.67 2.07 2.02 2.06 2.68 4.43 France 5.35 3.95 1.27 1.21 1.57 1.87 2.84 3.61 Italy 5.69 4.12 1.33 1.27 1.42 1.32 3.51 3.90 Turkey 6.00 3.49 2.03 1.77 1.70 1.46 3.29 4.39 Finland 5.53 2.16 1.18 1.22 1.38 1.49 2.53 3.55 All countries 5.76 3.82 1.54 1.58 1.69 1.72 2.98 4.05
Table 12. Mean response to questions about prohibition of mobile phone use for texting by country
DISCUSSION
Mobile phones are widespread throughout the world; thus we might think they are global tools where acceptable use does not depend on national differences. Our results indicate otherwise. The prohibition of the use of mobile phones for voice may be linked to national culture. For example, France bans the use of mobile phones while driving, which may be a consequence of the strong view of the French that the use of mobile phones for voice while driving should be prohibited. U.S. respondents do not feel strongly about such prohibition, perhaps because cars, which play a key role in everyday life in the U.S., may be viewed as an extension of one’s private space. Use of mobile phones in theaters may also be linked to national culture. The French, who feel more strongly than the U.S. respondents about prohibiting the use of mobile phones for voice in theaters, would not think of eating or using the restroom during a theater performance, but such behavior is considered acceptable in the U.S.
Texting should be prohibited: Age while driving in the classroom on public transpor-tation while walking in public restrooms in restau-rants in theaters I feel lost without my mobile phone < 20 5.71 3.52 1.54 1.63 1.88 1.84 2.65 5.59 20 – 22 5.74 3.54 1.47 1.49 1.66 1.68 3.15 4.03 23 – 25 5.68 3.70 1.63 1.63 1.70 1.71 2.84 4.05 26 – 30 5.94 4.50 1.53 1.67 1.60 1.61 2.76 3.78 > 30 5.84 4.90 1.44 1.60 1.65 1.83 3.26 3.05 All ages 5.75 3.82 1.53 1.58 1.68 1.71 2.98 4.05
Table 13. Mean response to questions about prohibition of mobile phone use for texting by age
Age is the second factor explaining differences in the prohibition of mobile phone use, with older respondents favoring prohibition more than younger respondents. Young people seem to be getting mobile phones at a younger age and may not have assimilated the social norms common among older generations.
Length of mobile phone use does not explain differences in perceptions of prohibiting mobile phone use for voice in all but one situation. This result may indicate that the appropriateness of mobile phone use for voice is perceived as an issue linked to social interactions rather than personal experiences. Gender is not a factor explaining any differences.
Differences in perceptions of prohibition of mobile phone use for texting may also be explained by national culture and age, but not by length of mobile phone use or gender. For example, U.S. and Finnish respondents differ widely in the perception of prohibition of mobile phone use for texting in the classroom. This may be explained by difference in social norms in educational environments in the two countries.
CONCLUSION
Mobile phones are becoming universal devices that provide many capabilities. Their increasing universality, both as personal devices and as m-commerce clients, adds importance to the question of when and where mobile phones should be used. M-commerce service providers must understand the social impact of mobile phone use so that their services are offered at the appropriate place and time for the user, and do not negatively impact individuals; to do otherwise is likely to result in negative goodwill among potential customers.
The results of this research show that attitudes about the prohibition of mobile phone use in certain social situations, which vary by location and time, are influenced by the country in which the user resides and the user’s age. Current research is investigating a more general model relating location and time with use of mobile phones for voice and texting and its impact in social situations, with mitigating factors such as country and age of user.
REFERENCES
1. Arnold, M. (2003) On the phenomenology of technology: the "Janus-faces" of mobile phones, Information and
Organization, 13, 231-256.
2. Carlson, P. J., Kahn, B. K. and Rowe, F. (1999) Organizational Impacts of New Communication Technology: A Comparison of Mobileular Phone Adoption in France and the United States, Journal of Global Information
Management, 7, 3, 19-29.
3. Jarvenpaa, S. and Lang, K. R. (2005) Managing the Paradoxes of Mobile Technology, Information Systems
Management. Fall, 7-23.
4. Lemish, D. and Cohen, A. A. (2005), On the gendered nature of mobile phone culture in Israel, Sex Roles, 52, 7/8, 511-521.
5. Licoppe, C. and Heurtin, P. (2001) Managing One’s availability to telephone communication through mobile phones: a French case study of the development dynamics of mobile phone use, Personal and Ubiquitous Computing, 5, 99-108.
6. Ling, R. (1996) One can talk about common manners! The use of mobile telephone in inappropriate situations, Rep. n° 32/96, Kjeller, Norway: Telenor Research and Development.
7. Ling, R. and Haddon, H. (2003) Mobile telephony, mobility and the coordination of every day life, in J. Katz (Ed.)
Machine that become us: The social context of communication technology, New Brunswick, NJ: Transaction Publishers,
245-266.
8. Murthagh, G.M. (2001) Seeing the “rules”: Preliminary observations of action, interaction and mobile phone use, in B. Brown, N. Green and R. Harper, R. (Eds) Wireless World: social and interactionnal aspects of the mobile age, Springer Verlag, 81-91.
9. Observatoire Societal du telephone mobile (2005) AFOM, SOFRES TNS, Novembre <http://www.tns-sofres.com/etudes/pol/031105_telmobiles.htm> (February, 2006).
10. Palen, L., (2002) Mobile Telephony in a Connected Life, Communications of the ACM, 45, 33, 78-82.
11. Palen, L., Salzman, M. and Youngs, E. (2001) Going Wireless: Behavior and Practice of New Mobile Phone Users,
Proceedings of the Conference on Computer Supported Cooperative Work (CSCW ’00), 201-210.
12. Plant, S. (2001) On the mobile: the effects of mobile telephones on social and individual life, Motorola <http://www.motorola.com/mot/doc/0/234_MotDoc.pdf> (April 22, 2006).
13. Rakow, L. and Navarro, V. (1993) Remote mothering and the parallel shift: women meet the mobileular phone, Critical
Studies in Mass Communication, 20, 3, 144-157.
14. Wei, R. and Leung, L. (1999) Blurring public and private behaviors in public space: policy challenges in the use and improper use of the mobile phone, Telematics and Informatics, 16, 11-26.
15. Weilenmann, A. L., and Larsson, C. (2001) Local use and sharing of mobile phones, in B. Brown, N. Green and R. Harper (Eds.) Wireless World: social and interactionnal aspects of the mobile age, Springer Verlag, 99-115.