This project is funded by the European Union under the 7th Research Framework Programme (theme SSH) Grant agreement nr 290752. The views expressed in this press release do not necessarily reflect the views of the European Commission.
Working Paper n° 31
Remittances and Development: Do Remittance
Transfer Channels Matter?
Francis Andrianarison, Fatou Cisse, Tiana
Rambeloma
CRES
Enhancing Knowledge for Renewed Policies against PovertyRemittances and Development: Do Remittance Transfer
Channels Matter?
Francis Andrianarison*
1Fatou Cisse*
Tiana Rambeloma*
20th February 2016
Abstract: This paper uses a nationally-representative household survey carried out in Senegal to examine how remittance transfer channels affects the marginal spending behavior of households. Two finding emerge. First, controlling for selection and endogeneity, house-holds receiving remittances through informal transfer channels spend more at margin on key consumption good compared to what they would have spent on this good in receiving remittance through formal channels. Second, formal remittances channels lead to significantly increase marginal spending on two investments goods education and productive goods. At margin, households receiving remittances through informal transfer channels spend less on education and productive goods compared to what they would have spent on this good in receiving remittances through formal channels. These findings hold when we partition the data by quintile group based on household expenditure. Our findings support to the growing literature view that remittances can actually have a positive impact on economic development by increasing the level of investment in human capital and productive assets.
JEL: Keywords: International Migration, Remittances, Investment, productive goods, Remittance Channels.
1
* Consortium pour la Recherche Économique et Sociale (CRES). Corresponding author : fandrianarison@gmail.com
1. Introduction
The growing importance of remittances ‡ows to developing countries has increased atten-tion to focus on their impact in receiving countries. These resources transfers represent a strategy to acquire capital in order to cover peaks in household consumption or to …n-ance new productive investments. The basic question is whether or not remitt…n-ances have an e¤ect on economic development in origin countries. Recent literature suggests that remittances ‡ows could potentially become an important tool for economic development, especially if they can be channelled into productive investment (Ratha, 2007). From this standpoint, the fundamental issue to know is how are these remittances spent or used? Is the money spent on newly desired consumer goods, or they channeled into human and physical investment or they helped to develop productive investments? In this paper, we extend the debate by examining how remittance transfer channels a¤ect recipient decisions. An extensive literature has concluded that remittances impact the expenditure patterns of recipients’ households. These studies argue that remittances actually increase invest-ments in human and physical capital at the margin, relative to other forms of household income. Using the Mexican National Rural Household Survey, Taylor and Mora (2006) concluded that households a¤ected by international migration modify their expenditure patterns by increasing the share of expenditures on investment at the expense of con-sumption. In the same vein, Woodru¤ and Zenteno (2007) show that migration in Mex-ico is associated with a signi…cantly higher rate of investment and a signi…cantly higher capital/output ratio. Similar …ndings are also stated by Zarate-Hoyos (2004), who …nds evidence of greater investments by remittance-receiving households. Airola (2007) reports that remittance-receiving households spend relatively more on durable goods, on health and on housing, but less on food relative to households that do not receive remittances. Finally, using a nationally-representative household data set from Guatemala, Adams and Cuecuecha (2010) suggest that households receiving international remittances spend less at the margin on one key consumption good— food— compared to what they would have spent on this good without remittances. In addition, they show that households receiving
either internal or international remittances spend more at the margin on two investment goods— education and housing— compared to what they would have spent on these goods without remittances. In this study, we explore an additional factor that shapes household expenditure patterns by examining how remittance transfer channels a¤ect the expenditure patterns of recipients’households.
While it is important to understand how money transfers from migrants a¤ect recipient household spending, it is also useful to ascertain how the way that remittances are sent in‡uences their use. For instance, migrants and recipients access to …nancial institution services may play an important role in encouraging savings. On the one hand, migrants should have access to an e¢ cient and secure transfer channel. On the other hand, recipients should have access to deposit accounts, which would encourage them to save more and then to make productive investments. In this sense, Amjad (2010) argues that remittances that come through formal …nancial institution have a much greater multiplier income impact on the economy than those through informal channels. To date, however, we know very little about how remittance transfer channels a¤ect recipient decisions. The purpose of this paper is to extend the debate relating how remittances are spent or used and their impact on economic development by investigating the e¤ects of remittance transfer channels on the expenditure patterns of remittance-receiving households.
In this paper, we provide the …rst systematic exploration of the e¤ect of remittance transfer channels on expenditure patterns of recipients’households. There are two ways to transfer money: through formal or informal channels . An formal transfer channel involves a formal …nancial institution to send money abroad. These institutions are typically banks or currency exchanges and are recognized by both the sending and receiving countries. As an alternative, migrants can use informal channels or informal …nancial services to remit their earnings by sending money to their household directly or through individually trusted middle-men Our main question is to understand whether the receiver’s access to formal …nancial services may in‡uence the direction of remittances towards investment. We use a nationally-representative household survey carried out in Senegal to examine how
remittance transfer channels a¤ects the marginal spending behavior of households. For that, we identify at a …rst stage the determinant of the sender’s choice to remit between formal and informal transfer channels. And at a second stage, we analyze the link between remittance transfer channels and use of remittances.
This paper uncovers a key important …nding about the impact of remittances transfer channels on economic development. formal remittances transfer channels lead to signi-…cantly increase marginal spending on two investments goods education and productive goods. First, controlling for selection and endogeneity, households receiving remittances through informal transfer channels spend more at margin on key consumption good com-pared to what they would have spent on this good in receiving remittance through formal channels. Second, receiving remittances through formal remittances channels lead to sig-ni…cantly increase marginal spending on two investments goods education and productive goods that what it would be through informal channel. Third, households receiving remit-tances through informal channels spend less at the margin on education what they would have spend on this good in receiving remittances through formal channels. These …ndings hold when we partition the data by quintile group based on household.
The rest of the paper is organized in six further sections. In Section 2, we present the conceptual framework for analyzing expenditure patterns and section 3 discusses the identi…cation and empirical strategy. Section 4 describes the data and descriptive analysis and Section 5 presents econometric results and analytical discussions. Finally, Section 6 summarizes the …ndings.
2. Conceptual Framework
In this study, the equation interest is derived from consumer demand models and thus a modi…ed Engel function. Households allocate their budgets across expenditure categories so as to maximize the utility obtained from the consumption of goods and services.2
2With the exception of a new empirical literature on intra-household resource allocation models, most
consumer models assume that households pool their incomes. This leads them to ignore income-source e¤ects.
To analyze the marginal expenditure patterns of remittance-receiving households, it is important to identify an appropriate functional form of the demand equations, which must comply with several requirements (Adams et al., 2010). First, the model allows for variations in expenditure patterns when total level of expenditure changes. Second, the marginal budget shares must vary among di¤erent expenditure categories. And third, the model must ensure additivity of marginal budget shares (the sum of all marginal budget shares must add up to unity).
The modi…ed version of the Working-Leser model which relates budget shares linearly to the logarithm of total expenditure complies with all of the above conditions and is widely used in the literature (Leser, C. E. V., 1963, Adams et al., 2010). The Engel function may be represented as follows:
ei = i+ 1iE + 2iE log E + 1iR + 2iR log R (2.1)
where ei represents household’s expenditure category i , E represents household’s total
expenditure on all goods and services, R is household’s income from migrant remittances. In order to allow for more variability among expenditure categories, one may adjust this model with the inclusion of households’ socio-demographic characteristics and their interactions with the total expenditure and remittances. Let Zj denotes the jthhousehold’s
characteristic variable and let ij, ij and ij be constants. Thus, the complete model is:
ei = i+ 1iE + 2iE log E + 1iR + 2iR log R +
X
j
ijZj + ijEZj + ijRZj (2.2)
From (2.2) we derive the average and marginal budget shares for the good i (ABSi = eEi
and M BSi = dedRi ) as following: ABSi = 1i+ i 1 E + 2ilog E + 1i R E + 2i R E log R + X j ij E + ij + ij R E Z(2.3)j M BSi = 1i+ 1i+ 2i(1 + log E) + 2i(1 + log R) + X ij + ij Zj (2.4)
Where ABSi = eEi (2.3)is the household’s share of expenditure on good i in the total
expenditure E; and the additivity condition must ensure that X
i
.ABSi = 1:Equation
(2.4) shows the responses in the budget share of good i to one unit increase in remittances, holding constant household characteristics
3. Identi…cation and Estimation Strategy
3.1. Identi…cation
Since we investigate the impact of remittance transfer channels on expenditures, we limit our estimates to the sample of households who reported having received remittances. Thus, all results are conditional on having received remittances. We now rede…ne the model in terms of the choices that households make. Assume that households choose between two mutually exclusive states s: (s = 1 if household chooses to receive remittances through formal transfer channels and s = 0 if household chooses to receive remittances through informal transfer channels). Once households have chosen a state, they decide their optimal use of the amount received esi , where esi is the optimal consumption share in good i
(food, consumer goods, durables, education, health, productive investments or others) for household that chooses state s.
On this basis, we have a polychotomous-choice model (Lee, 1983; Adams et al., 2010), where we have an equation like (2.3 ) for each type of expenditure good that households choose for each possible state. In literature on remittance, Lucas and Stark (1985) observe that an endogeneity bias of remittances results from the selectivity of households with migrants. The remittance literature explains this endogeneity bias by the existence of un-observed characteristics that a¤ect both the household’s decision to participate in migration and, as a result, receive remittances as well as the level of the household’s expenditures. In the some vein, an endogeneity bias of remittance channels is associated with the selectivity of households with remittance channels. Thus, the remittance channels variable may be correlated with the error term of the demand equations.
Bourguignon et al. (2007) argue that a two-stage multinomial logit model based on Dubin and McFadden (1984) method is to be preferred to the most commonly used Lee (1984) method to control for selection bias. Thus, the ABS will be estimated with the Dubin and McFadden (1984) method and the model (2.3) can be corrected by adding a term is;h as follows:
esi
E = 8 < :
1si+ siE1 + 2silog E + 1siRE + 2siRE log R+
P j sij E + sij + sij R E Zj + + si;h si+ hi;h hi+ si (3.1)
where s 6= h represents the chosen state (treatment) of the households , hi represents
the selection correction variable estimated in the …rst-stage model and associated with households’choice among alternative h (h = 1 if households choose to receive remittances through formal channels and h = 0 if households choose to receive remittances through informal channels), the parameter si;h is a coe¢ cient to be estimated and is directly
proportional to the correlation between the error terms of the consumption and the choice equations; E ( si j X; Z) = 0 while si is the error term, which is assumed to be normally
distributed with a mean of zero and variance of 2. The probability of receiving remittances
through formal channels or informal channels is estimated in the …rst-stage. The selection correction variable is determined in the following way:
0ih =
pi;hln(pi;h)
(1 pi;h)
and 1is = ln pi;s (3.2)
Where pi;h stands for the probability that the household selects alternative h, pi;s is the
probability of selecting the base alternative state s for the type of expenditure good i . Also, si;h = si si;h, where si represents the standard deviation of the error term and
si;h is the correlation coe¢ cient between the error term and the unobserved element of
The marginal budget share (M BS) can be rewritten as follow:
M BSsi =
8 < :
1si+ 1si+ 2si(1 + ln E) + 2si(1 + ln R) +
+Pj sij + sijRE Zj + + si;h 1is+ si;h 0ih
(3.3)
3.2. Specifying the two stage model
The rationale underlying the choice of functional form of probability between formal and informal transfer channels follows the standard literature in remittance transfer channels modeling. These models are similar to the ones for remittance motives. It is expected that the choice of remittance transfer channel is likely a¤ected by both migrant and recipient household-related characteristics such as human capital, social network, location and in-comes variables (Amuedo-Dorantes and Pozo, 2005). Educated migrants, migrants with more work experience and with wider networks family and friends in their countries of residence are more likely to use banks, as they are likely to understand the banking system and to hold a bank account. Using informal channels is more likely when migrants remit to more rural areas where banks may not be available. As using formal transfer channels usually entails costs or other requirements set by di¤erent remittance service providers, either the low-income migrant or recipient household may be excluded from using these transfer channels (see e.g. Ngugi and Sennoga, 2011; Agu, 2011).
The survey contains no information on migrants income’s level nor those of recipient households. Thus, the migrant’s and the recipient household’s incomes are proxied with several variables referring to the standard human capital approach. Following these lines, variables age, migrant’s gender, duration of his/her migration, his/her country of residence, education level, location (OECD, Africa) and urban are used as proxies for the migrant’s income, which is expected to increase from the e¤ect of these proxies (Agarwal et al. 2002 et de la Brière et al. 2002, Mincer, 1974). We add also a dummy variable for whether he/she has dependent children in his/her current country of residence. The rationale behind the last variable is that if the migrant has children in his/her current country of residence, the migrant is likely to divide his/her income between children rear and sending remittances
back home (de la Brière et al. 2002). In addition to the proxies of the recipient household’s income, variable assets of households may also be considered as one, as it is likely to be positively correlated with the recipient household’s income.
On the basis of the preceding, the …rst-stage choice function of the choice’s probability between formal and informal transfer channels can be estimated as:
Pr ob [s = Inf ormal] = 8 > > > < > > > :
f (OECD; Af rica; U rban_Senegal; SON; AGE_M IG; SEXE_M IG; Pr imary_M IG; Secondary_M IG;
U niversity_M IG; Duration; HHASSET )
(3.4) where
Variable Description
Dummy variable indicating current residence of migrant OECD if an OECD country (1=yes)
Africa in an Africa country other than Senegal (1=yes) Urban_Senegal if in Urban Senegal (1=yes)
Migrant Characteristics
SON Dummy variable indicating relationship of migrant to the household head,(1=if son or daughter) AGE_MIG Age of migrant (in years)
SEXE_MIG Dummy variable indicating sex of migrant (1=male) Education level completed by migrant before migration
Primary_MIG Primary education (1=yes) Secondary_MIG Secondary education (1=yes) University_MIG University education (1=yes) Duration Duration of migration in years
Thus, the complete model to be estimated can be represented as follows: esi E= 8 > > > > > > > > > > > > > > > > < > > > > > > > > > > > > > > > > :
1si+ Esi+ 2siln E + 1siRE+ 2siREln R + 1siHD + 1siHDE + 1siHDRE
+ 2siAge25 + 2si Age25
E + 2siAge25 R
E+ 3siAge59 + 3si Age59
E + 3siAge59 R E
+ 4siChild5 + 4siChild5E + 4siChild5RE+ 5siChild5_15 + 5si
Child5_15 E
+ 5siChild5_15R
E+ 6siEDP RIM + 6siEDP RIME + 6siEDP RIMRE+ 7siEDSEC
+ 7siEDSECE + 7siEDSECRE+ 8siEDU N IV + 8siEDU N IVE + 8siEDU N IVER
+ 9siAREA + 9siAREAE + 9siAREARE+ 10siHHASSET + 10siHHASSETE
+ 10siHHASSETRE+P9j=1 sijREGIONj+ 10i 0i+ 01i 1i+ si
(3.5) where
Variable Description
esi Annual household expenditures on one of the seven expenditures categories (food,
consumer goods/durable, housing, education,health, productive goods or other)
E Total annual household expenditures
R Total remittances received
HD Household head is non-indigenous (1=yes)
Age25 Household head is between 25 and 59 years old (1=yes)
Age59 Household head is above 59 years old (1=yes)
Child5 There are children below age 5 in the household (1=yes)
Child5_15 There are children between 5 and 15 years in the household (1=yes)
EDP RIM There are household members with primary education (1=yes)
EDSEC There are household members with secondary education (1=yes)
EDU N IV There are household members with university (1=yes)
AREA Area (0=urban,1= rural)
HHASSET Assets if household owns land or buildings (1=yes)
REGION A set of nine regional dummy variables
particular expenditure category, we compare the M BS between two states s ( s = 1 : formal channels, and s = 0 informal channels).We would ideally want to compare what happens when the household with s = 1 with what would have happened to this household with s = 0. Clearly, we cannot observe the same household in the two states, so we compare households with s = 1 to households with s = 0 who are as similar as possible. As people self-select whether they receive remittance through s and we do not have experimental, longitudinal data. One way to evaluate the impact of s is to turn to estimate the Average Treatment E¤ects on the Treated (AT T ). Our treatment is s : the choice of remittance transfer channels (s = 1; 0) We estimate the following .AT T
AT T = E(M BS0 M BS1js = 0) = E(MBS0js = 0) E(M BS1js = 0) (3.6)
where E(M BS0js = 0) represents the marginal budget share (MBS) , estimated with
the equation for households that choose informal transfer channels s = 0 conditioning on the characteristics of households that received remittances through informal transfer channels s = 0: Otherwise E(M BS1js = 0) represents the MBS, estimated with equation
for households that received remittances through formal transfer channels called s = 1 conditioning on the characteristics of households that received remittances by informal transfer channels s = 0:
Expression (3:6) thus provides a comparison between the observed outcomes (the …rst term on the R-H-S) and the unobserved outcome (the second term on the R-H-S), which can be estimated given the existence of socio-demographic characteristics that connect the two groups. Equation (3:6) represents the e¤ect in M BS produced by receiving remittances through formal transfer channels. Examples of remittance studies that implemented this technique successfully include Adams et al. (2010).
Based on the pair of M BS (M BS for households receiving remittances through informal channels and their counterfactual), one can calculate the AT T , which will show the e¤ect of receiving remittances through formal channels on marginal propensities to spend. The
pair of budget shares is represented below:
E(M BS0js = 0) =
8 < :
10i+ 10i+ 20i(1 + ln E) + 20i(1 + ln R)+
P
j ( j0i+ j0i)Zj + 0i;0 0i0+ 0;i0 1i0
(3.7)
E(M BS1js = 0) =
8 < :
11i+ 11i+ 21i(1 + ln E) + 21i(1 + ln R)+
P
j ( j1i+ j1i)Zj + 0i;1 0i1+ 0;i1 1i1
(3.8)
The e¤ect of remittances channels on the marginal propensity to spend by households receiving remittances through formal channels is then obtained from the di¤erence of the two M BS and can be represented in the following way:
AT T01i =
8 < :
( 10i 11i) + ( 10i 11i) + ( 20i 21i)(1+ ln E) + ( 20i 21i)(1+ ln E)+ P
j ( joi j1i) + ( j0i j1i) Zj+ 0i;0 0i0+ 0i;0 1i0 0i;0 1i1js=0 0i;1 0i1js=0
(3.9)
4. Data and Descriptive Analysis
Data come from the Senegalese Migration and Remittances Household Surveys (SMRHS ), a nationally representative survey done by the Consortium pour la Recherche Economique et Sociale (CRES ) during the period October to December 2009. The survey captured data on a cross-section of migrants, including those who left home a long time back. For this survey, a migrant is a person who used to live in a household in the country in which the interview is being conducted, but left before the interview to live abroad, or in another village or urban area within the country, for at least six months. Remittances refer to transfers of resources, both money and in-kind those are sent to households by migrant workers who left home to live outside of their origin communities. Remittances include both international (cross-border) and internal (within-country). Following a two-phase sampling procedure, the survey was designed to be statistically representative both at the national level and for urban and rural areas (CRES, 2011). The survey included 2100 households sample containing 700 households with international migrants, 700 with internal migrants
and 700 without migrants.
The survey covered recent migration and remittance trends, housing conditions, house-hold assets and expenditures, use of …nancial services, internal and international migration. The survey instrument collected also information on a variety of demographic, social, and economic characteristics, such as education, marital status, housing conditions, labor force participation, skills, languages, assets and access to …nance. With respect to remittances, the survey collected: (i) the amount of monetary and non-monetary remittances received during the preceding 12 months from former and non-former household members, that is, individuals who regularly send remittances but have not been part of the current house-hold; (ii) the household’s spending of the money transferred by migrants in the last 12 months; and (ii) the commonly remittance channels used by migrants for remitting.
According to the SMRHS, Senegalese migrants mainly sent remittances through in-formal channels. Sending money through friends and relatives or carry the money him-self/herself during visits, is still the most important transfer channel. Then, migrants remit fund through remittances service providers such as Western Union or Moneygram. The use of bank transfer is very marginal. For this study, the 17 di¤erent remittance channels recorded by the household surveys are grouped into two groups based on whether the trans-fer channels are considered to be formal or not (informal). Transtrans-fer channels regarded as formal include the following: Western Union, Moneygram, other money transfer operators, postal money orders, and direct transfers to bank account, banks, Forex, credit unions, and travel agencies. Transfer channel was regarded as informal if the migrant sent remittances through informal individual agents, friends or relatives, couriers, mobile phone, pre-paid card, internet, or migrant brought remittances back home himself, or used some other means for remitting. In this study, we only consider “cash” remittances. Each household that is recorded as having received remittances (internal or international) from former or non-former household members is assumed to having received exactly the amount of remittances measured by the survey.
the households surveyed, 927 reported having received remittances during the reference period of one year prior to data collection. We limit our estimates to this sample. Thus, all results are conditional on having received remittances. Among remittance- receiving households, 523 reported having received remittances through formal transfer channels and 404 declared having received remittances through informal transfer channels. Remittances contribute to a large share of household expenditures: 31.5% of annual expenditures for all households, 41.6% of annual expenditures for those receiving remittances through formal transfer channels, and 22.8% of annual expenditures for those receiving remittances through informal transfer channels.
Insert Table 1
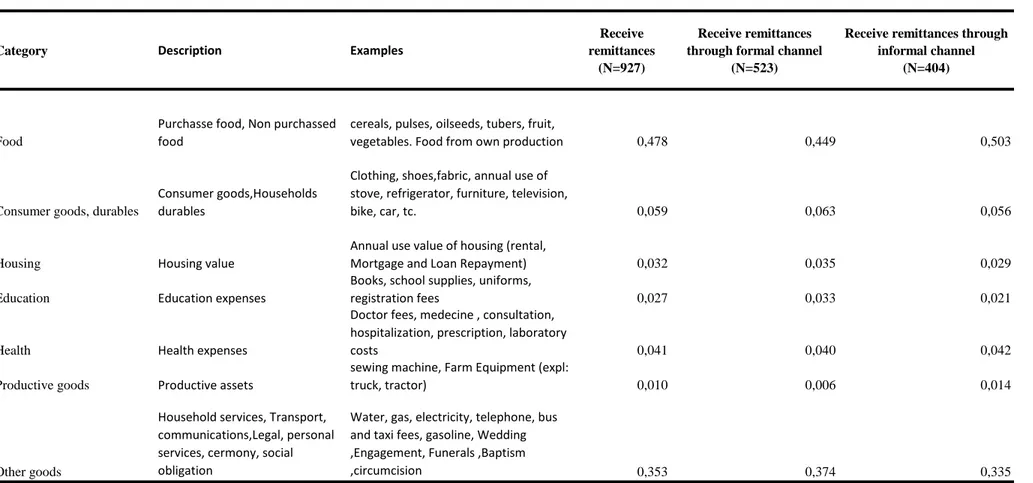
Since we want to examine the impact of remittance transfer channels on expenditures spe-ci…cally on investment, it is important to present the type of expenditures data contained in the 2009 SMRHS. Table 2 shows the summary of detailed information on seven major categories of expenditure collected in the survey. While the time base over which these expenditure outlays measured varied (from last 7 days for most food items, to last six months for durable goods and services), all expenditures were aggregated to obtain yearly value.
Table 2 also shows the average budget shares devoted to the seven categories of goods for all remittance receiving households and for each group of households: those receiving through formal channels, and those receiving through informal channels. On average, households spend nearly 54% of their budget on food and consumption goods, durables. But a signi…cant di¤erence is noted between the two types of households: while those receiving remittances through formal channels spend only 51% of their budget on these two categories of good, those receiving remittances through informal channels devote over 56% of their budget.
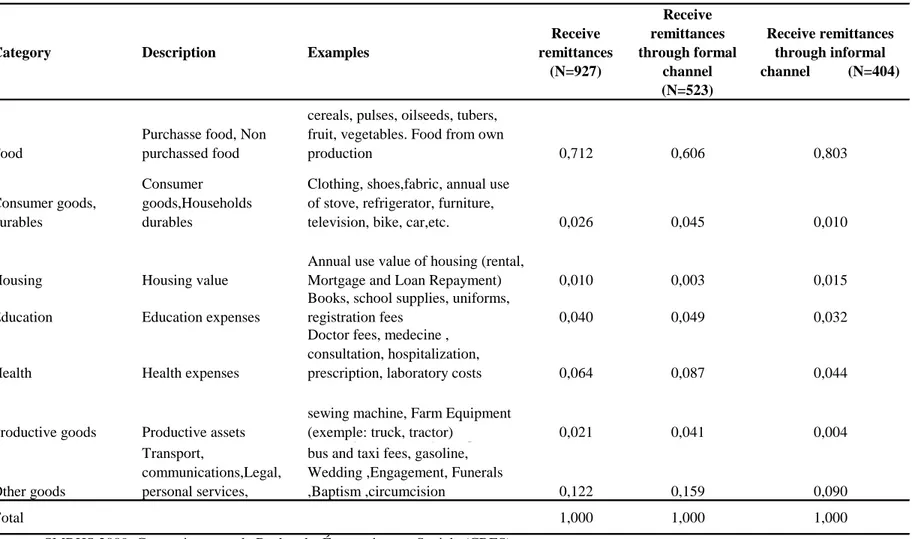
Each household recorded as remittances-receiving - internal or international- is asked how are these remittances spent or used? The 11 di¤erent groups of expenditures recorded by the household surveys are grouped into seven groups: consumer goods : (i) food and (ii) durable goods (furniture, household equipment, audiovisual equipment, vehicles); (iii)housing ; investment expenditures on human capital (iv) education (tuition, materials, transportation) and (v) health (medical services, medicines, health insurance), - or (vi) in productive activities - small business, trade, purchases of machinery or animals for the production process and (vii) others such as household services, transportation, culture and entertainment or ceremony.
Table 3 shows that over 71% of remittances are spent on food. This share devoted to food is more important for households receiving remittances through informal trans-fer channels (80,3%). Table 3 shows also that household receiving remittances through formal transfer channels has assigned higher share for education, health, and productive investments than those receiving remittances through informal transfer channels.
Insert Table 3
5. Econometric Results and Discussions
5.1. Main Results
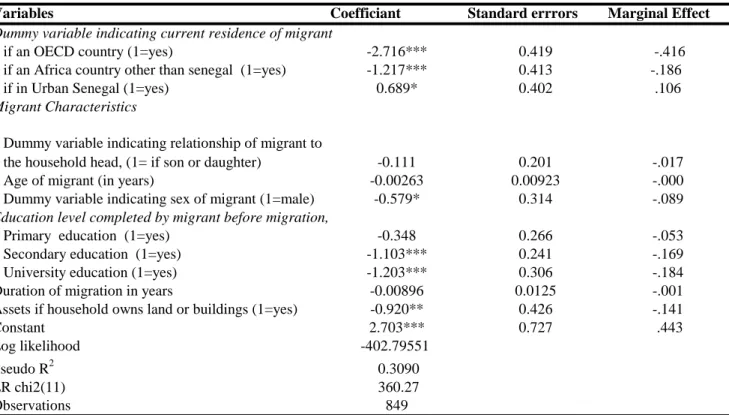
Table 4 presents results from the …rst-stage equation of the multinomial logit model (3.4). The coe¢ cients of variables indicating whether the migrant is the son or daughter of the household head, whether he/she is residing in an OECD country, in an African country other than Senegal or in urban regions of Senegal, whether he/she has completed secondary education or higher before migration, whether the migrant is male and the household’s asset are statistically signi…cant. Of the signi…cant variables, the largest partial e¤ects on the probability of using informal channels are induced by the current residence of the migrant
and his/her education level before migration.
Insert Table 4
In terms of the migrant’s residence, international migrants residing in an OECD country or in an African country other than Senegal have higher probability to use formal channels for remitting than migrants residing in rural regions of Senegal. In terms of education level attained before migration, migrants with secondary education level and higher are more likely to use formal channel for remitting than migrants residing in rural regions of Senegal. Also, as these variables, both education level and residence may be interpreted as a proxy for the migrant’s income, and are expected to increase the income, international migrants with higher education level may not be as liquidity constrained in their choice between remittance channels as migrants in rural regions of Senegal, and are likely to have a better access to formal channels.
Insert Table 5
Tables 5 and 6 show the results of the second-stage equation for each expenditure category and for each type of household: households receiving remittances through formal channels (Table 5), households receiving remittances through informal channels (Table 6). The most important variable in these two tables is the selection term, which is the
h variable. For the two categories of households, those receiving remittances through
formal channels (Table 5) or those receiving remittance through informal channels (Table 6), the h variable is signi…cant for two expenditures categories. These results suggest that
selectivity in unobservable components matters. In other words, estimations ignoring the selectivity part of the model would be biased.
Insert Table 6
budget shares for the seven categories of expenditures and for each type of household. Table 7 also presents the counterfactual marginal budget shares used in the estimation of the Average Treatment E¤ects (AT T ). The counterfactual represents the expenditure of households who choose to receive remittance through informal transfer channels would have had with they received it through formal channels. It is obtained using the equation for expenditure shares for households who receive remittances through formal channels on households who receive remittances through informal channels as given by equation (3.8). Table 7 shows the Average Treatments E¤ects on the Treated (AT T ) for the seven categories of expenditure. Three of these AT T results are notable. First, when compared to what they would spend in receiving remittances through formal channels, households receiving remittances through informal channels spend more at margin on one key con-sumption good: food. At the mean, households receiving remittances through informal channels spend 13% more at the margin on food that what they would have spend on this good in receiving remittances through formal channels.
Second, households receiving remittances through informal channels spend less at mar-gin on two investments expenditures: productive goods, education. At the mean, house-holds receiving remittances through informal channels spend 97% less at the margin on productive goods that what they would have spend on this good in receiving remittances through formal channels. These large marginal increases in spending on productive assets are very important because they can help to create economic activities in Senegal. At the mean, households receiving remittances through informal channels spend 84% less at the margin on spending in education what they would have spend on this good in receiving remittances through formal channels. This result is also important because it can help to raise the level of human capital.
5.2. Heterogeneity in e¤ects: remittance channels and expenditure in housing, education and productive goods
In the previous section, we noted that households receiving remittances through informal channels spend less at the margin on productive goods and education than what they would have spend on these investments goods in receiving remittances through formal channels. Since households receiving remittances through formal channels also enjoy higher levels of per capita income (expenditure), it is possible that these …ndings are driven by the higher levels of income (expenditure).
To test whether our results are robust when controlling for level of household expendit-ure, we divide all 927 households in the data set into quintile groups on the basis of total annual per capita expenditure, including remittances. We then partition the quintiles into two mutually-exclusive groups of households: those receiving remittances through informal channels and those receiving remittances through formal channels. The regression results reported above can then be used to calculate counterfactual marginal budget shares and Average Treatment E¤ects on the Treated (AT T ) for the various quintile groups.
Tables 8 shows the expenditure behavior on education for each quintile group for the two groups of households. At the mean the estimated marginal budget share spent on education is quite low: less than 2% for households receiving remittances through informal channels and 3% for those receiving remittances through formal channels. However, except the …fth richest quintile groups, households receiving remittances through informal channels spend less at the margin on education than what they would have spent on this investment good in receiving remittances through formal channels. For example, the last column in Table 8 shows that the …rst four poorest quintile households receiving remittances through informal channels spend between 72% and 142% less at the margin on education, than what they would have spent on this investment good with the receipt of remittances through formal channels. For the …fth richest quintile, the Average Treatment E¤ects is not statistically signi…cant.
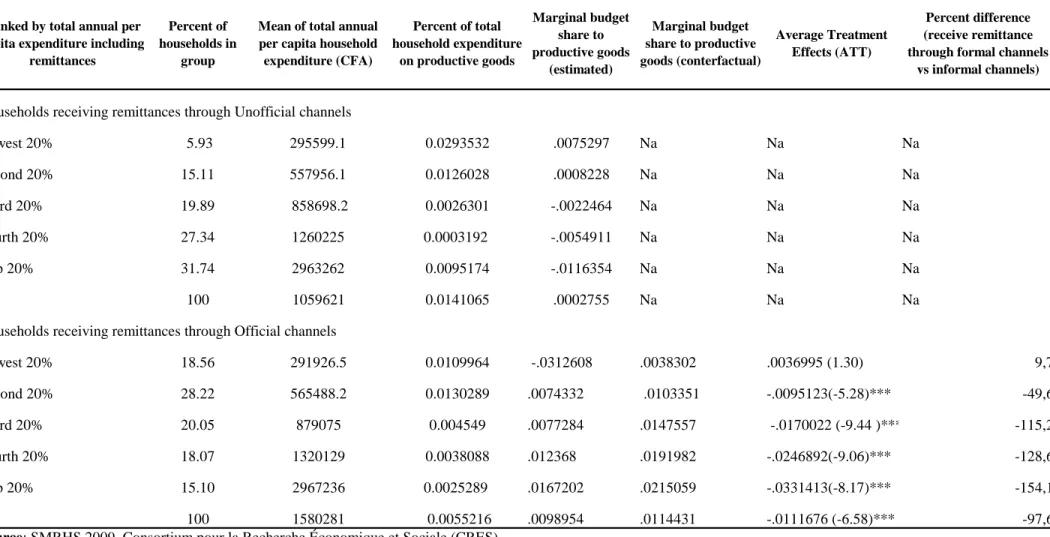
Table 9 shows the expenditure patterns for productive goods for each quintile group for the two groups of households. At the mean, except the …rst poorest quintile group, households receiving remittances through informal channels spend less at the margin on productive goods than what they would have spent on this investment good with the receipt of remittances through formal channels. For example, the last column in Table 9 shows that the four richest quintile households receiving remittances through informal channels spend between 49% and 154% less at the margin on productive goods, than what they would have spent on this investment good with the receipt of remittances through formal channels. For the …rst poorest quintile, the Average Treatment E¤ects is not statistically signi…cant.
Insert Table 9
In sum, with respect to the two main categories of investment expenditures— education and productive goods— the robustness checks show that our …ndings are robust in terms of signs and signi…cance, but that in terms of changes in point estimates our results show important variation. On the whole, our data set for Senegal shows that households receiving remittances through formal channels spend less at the margin on food, and more at the margin on education and productive goods than what they would have spent on these investment goods while receiving remittances through informal channels.
6. Conclusion
This paper has used a large, nationally-representative household survey from Senegal to analyze how remittance transfer channels a¤ects the marginal spending behavior of house-holds on a broad range of consumption and investments goods. Three key …ndings emerge. First, comparing to what they would have spend when receiving remittances through formal channels, households receiving remittances through informal channels spend more at the margin on one key consumption good: food. Second, households receiving remittances through informal channels spend 97% less at the margin on productive goods that what
they would have spend on this good in receiving remittances through formal channels. Third, households receiving remittances through informal channels spend 84% less at the margin on spending in education what they would have spend on this good in receiving remittances through formal channels. These …ndings hold when we partition the data by quintile group based on household expenditure.
Our study shows that remittances of fund through formal channels lead to signi…cantly increasing marginal investment expenditures, education and productive goods. Our …nd-ings support to the growing literature view that remittances can actually have a positive impact on economic development by increasing the level of investment in human capital and productive assets.
References
[26] Adams, Richard H. Jr., (2005), “Remittances, Household Expenditure and Investment in Guatemala,” The World Bank, Working Paper WPS3532
[26] Adams R.H., Cuecuecha, A (2010). Remittances, Household Expenditure and Invest-ment in Guatemala, World DevelopInvest-ment, 38,pp. 1626-1641.
[26] Agarwal, R. and Horowitz, A.W. (2002). ”Are International Remittances Altruism or Insurance? Evidence from Guyana Using Multiple-Migrant Households”. World Development 30 (11): 2033-2044.
[26] Agu, C. 2011. “Nigeria”. In Remittance Markets in Africa, edited by Mohapatra, S. and Ratha, D., 185-220. IBRD / The World Bank: Washington D.C.
[26] Aimee Chin, Léonie Karkoviata and Nathaniel Wilcox (2010). Impact of Bank Ac-counts on Migrant Savings and Remittances: Evidence from a Field Experiment. [26] Airola, Jim. (2007). The Use of Remittance Income in Mexico. International Migration
[26] Amjad, R. (2010). Remittances and poverty in Pakistan: A note. In L. Banerjee, A. Dasgupta, & R. Islam (Eds.) Development, equity and poverty: Essays in honor of Azizur Rehman Khan. New Delhi, India: Macmilla.
[26] Amuedo-Dorantes, C. and Pozo, S. (2005). “On the Use of Di¤ering Money Transmis-sion Methods by Mexican Immigrants”. The International Migration Review 39 (3): 554-576.
[26] Bourguignon, François, M. Fournier and M. Gurgand (2007) “Selection bias correc-tions based on the multinomial logit model: Monte Carlo comparisons.”, Journal of Economic surveys, 21, pp. 174-205.
[26] De la Brière, B., Sadoulet, E., de Janvry, A. and Lambert, S. (2002). “The Roles of Destination, Gender, and Household Composition in Explaining Remittances: An Analysis for the Dominican Sierra”. Journal of Development Economics 68 (2): 309-328.
[26] Caroline Freund and Nikola Spatafora (2008). Remittances, Transaction Costs, and Informality. Journal of Development Economics Volume 86, Issue 2, June 2008, Pages 356-366.
[26] CRES and World Bank (2011). “Migration and Remittances Survey in Senegal–2009.” Survey Report. World Bank and CRES, Washington, DC.
[26] Dubin J and McFadden, D. (1984). An Econometric Analysis of Residential Electric Appliance Holdings and Consumption. Econometrica 52, 345-362.
[26] Hausman, J. and D. McFadden (1984) “Speci…cation tests for the multinomial logit model.” Econometrica 52 (5), pp. 1219-40.
[26] Heckman, James (1979) “Sample selection bias as a speci…cation error”, Econometrica Vol. 47(1), pp. 153-161.
[26] Lee, L. (1983). Generalized Econometric Models with Selectivity. Econometrica,51, 507–512.
[26] Leser, C. E. V., (1963), “Forms of Engel Functions,” Econometrica, Vol. 31, No. 4, pp. 694–703.
[26] Mesnard, A. (2004). _Temporary migration and capital market imperfections_, Ox-ford Economic Papers, vol. 56, pp. 242–62.
[26] Mincer, J.A. (1974). Schooling, Experience and Earnings. Columbia University Press: New York and London.
[26] Ngugi, R. W. and Sennoga, E. (2011). “Uganda”. In Remittance Markets in Africa, ed-ited by Mohapatra, S. and Ratha, D., 243-270. IBRD / The World Bank: Washington D.C.
[26] Ratha, D., (2007), Leveraging Remittances for Development, Migration Policy Insti-tute, World Bank, Washington, DC.
[26] Schmertmann, C. (1994) “Selectivity Bias Correction Methods in Polychotomous Sample Selection Models.”Journal of Econometrics, 60 (January-February), pp. 101-32.
[26] Taylor, J. Edward and Jorge Mora. 2006. Does Migration Reshape Expenditures in Rural Households? World Bank Policy Research Working Paper 3842.
[26] Woodru¤, C. and Zenteno, R. (2007). Migration networks and microenterprises in Mexico, Journal of Development Economics, vol. 82(2), pp. 509— 28.
[26] The World Bank. (2011). Migration and Remittances Factbook 2011 – 2nd Edition. IBRD / The World Bank: Washington D.C.
[26] Zarate-Hoyos, German A. (2004). Consumption and Remittances in Migrant House-holds: Toward a Productive Use of Remittances. Contemporary Economic Policy, 22 (4), 555-65;
Variable
t-test (Formal vs.
Informal
Household head is non-indigenous (1=yes) 0,01 0,10 0,02 0,15 0,00 0,02 -0.96
Age of household head (years) 53,27 15,71 53,12 15,61 53,40 15,81 0.11
Household head is between 25 and 59 years old
(1=yes) 0,62 0,49 0,60 0,49 0,64 0,48 0.34
Household head is above 59 years old (1=yes) 0,37 0,48 0,38 0,49 0,36 0,48 -0.16
Number of children below age 5 in household 1,96 1,99 1,65 2,09 2,24 1,86 1.53
Number of children between 5 and 15 years in
household 2,80 2,47 2,61 2,69 2,96 2,26 1.4391
There are children below age 5 in the household
(1=yes) 0,72 0,45 0,65 0,48 0,78 0,41 2.44**
There are children between 5 and 15 years in the
household (1=yes) 0,85 0,36 0,78 0,41 0,91 0,29 2.83***
Number of household members with primary
education 2,29 2,46 2,57 2,62 2,06 2,29 -0.91
Number of household members with secondary
education 1,14 1,77 1,65 2,11 0,69 1,25 -5.73***
Number of household members with high
university education 0,15 0,45 0,28 0,60 0,04 0,22 -5.41***
There are household members with primary
education (1=yes) 0,74 0,44 0,78 0,42 0,71 0,45 -0.11
There are household members with secondary
education (1=yes) 0,44 0,50 0,58 0,49 0,32 0,47 -5.94***
There are household members with university
(1=yes) 0,11 0,32 0,21 0,41 0,03 0,17 -5.97***
Area (0=urban,1= rural) 0,56 0,50 0,44 0,50 0,66 0,47 3.85***
Assets if household owns land or buildings (1=
yes) 0,93 0,25 0,91 0,28 0,95 0,22 -0.70
Total annual per capita expenditure (including
remittances) 292 656 467 184 371 864 399 773 224666 508 805 -1.68
Remittances as percent of total annual
expenditures (including remittances) 31,54 36,86 41,63 44,70 22,87 25,47 -5.79***
N 927 523 404
Receive remittances through formal channel
Receive remittances through informal channel All households
Category Description Examples
Receive remittances
(N=927)
Receive remittances through formal channel
(N=523)
Receive remittances through informal channel
(N=404)
Food
Purchasse food, Non purchassed food
cereals, pulses, oilseeds, tubers, fruit,
vegetables. Food from own production 0,478 0,449 0,503
Consumer goods, durables
Consumer goods,Households durables
Clothing, shoes,fabric, annual use of stove, refrigerator, furniture, television,
bike, car, tc. 0,059 0,063 0,056
Housing Housing value
Annual use value of housing (rental,
Mortgage and Loan Repayment) 0,032 0,035 0,029
Education Education expenses
Books, school supplies, uniforms,
registration fees 0,027 0,033 0,021
Health Health expenses
Doctor fees, medecine , consultation, hospitalization, prescription, laboratory
costs 0,041 0,040 0,042
Productive goods Productive assets
sewing machine, Farm Equipment (expl:
truck, tractor) 0,010 0,006 0,014
Other goods
Household services, Transport, communications,Legal, personal services, cermony, social obligation
Water, gas, electricity, telephone, bus and taxi fees, gasoline, Wedding ,Engagement, Funerals ,Baptism
,circumcision 0,353 0,374 0,335
Source: SMRHS 2009, Consortium pour la Recherche Économique et Sociale (CRES)
Category Description Examples Receive remittances (N=927) Receive remittances through formal channel (N=523) Receive remittances through informal channel (N=404) Food
Purchasse food, Non purchassed food
cereals, pulses, oilseeds, tubers, fruit, vegetables. Food from own
production 0,712 0,606 0,803 Consumer goods, durables Consumer goods,Households durables
Clothing, shoes,fabric, annual use of stove, refrigerator, furniture,
television, bike, car,etc. 0,026 0,045 0,010
Housing Housing value
Annual use value of housing (rental,
Mortgage and Loan Repayment) 0,010 0,003 0,015
Education Education expenses
Books, school supplies, uniforms,
registration fees 0,040 0,049 0,032
Health Health expenses
Doctor fees, medecine , consultation, hospitalization,
prescription, laboratory costs 0,064 0,087 0,044
Productive goods Productive assets
sewing machine, Farm Equipment
(exemple: truck, tractor) 0,021 0,041 0,004
Other goods
Household services, Transport,
communications,Legal, personal services,
Water, gas, electricity, telephone, bus and taxi fees, gasoline, Wedding ,Engagement, Funerals
,Baptism ,circumcision 0,122 0,159 0,090
Total 1,000 1,000 1,000
Source: SMRHS 2009, Consortium pour la Recherche Économique et Sociale (CRES)
Variables Coefficiant Standard errrors Marginal Effect
Dummy variable indicating current residence of migrant
if an OECD country (1=yes) -2.716*** 0.419 -.416
if an Africa country other than senegal (1=yes) -1.217*** 0.413 -.186
if in Urban Senegal (1=yes) 0.689* 0.402 .106
Migrant Characteristics
Dummy variable indicating relationship of migrant to
the household head, (1= if son or daughter) -0.111 0.201 -.017
Age of migrant (in years) -0.00263 0.00923 -.000
Dummy variable indicating sex of migrant (1=male) -0.579* 0.314 -.089
Education level completed by migrant before migration,
Primary education (1=yes) -0.348 0.266 -.053
Secondary education (1=yes) -1.103*** 0.241 -.169
University education (1=yes) -1.203*** 0.306 -.184
Duration of migration in years -0.00896 0.0125 -.001
Assets if household owns land or buildings (1=yes) -0.920** 0.426 -.141
Constant 2.703*** 0.727 .443
Log likelihood -402.79551
Pseudo R2 0.3090
LR chi2(11) 360.27
Observations 849
* Significant at the 0.1 level. ** Significant at the 0.05 level. *** Significant at the 0.01 level
Table 4: Multinomial logit model, using the Dubin McFadden method
Source: SMRHS 2009, Consortium pour la Recherche Économique et Sociale (CRES)
Variables Food Consumer goods, durables
Housing Education Health Productive goods
Others
Log total annual household expenditure -0.136*** 0.114*** 0.0950*** -0.0255*** 0.00335 0.0132* 841,735*** (0.0352) (0.0360) (0.0241) (0.00787) (0.0135) (0.00712) (112,358) Remittances as percent of total annual
expenditures (including remittances) -0.00737 0.00539 0.00125 -0.00117 -0.00549 0.000928 5,927 (0.0804) (0.0132) (0.0114) (0.00333) (0.0130) (0.00304) (85,803) Remittances as percent of total annual
expenditures (including remittances) X Log
total remittances 0.000461 -0.000299* -6.52e-05 9.52e-05 0.000153 -8.25e-06 -376.5
(0.000280) (0.000181) (0.000133) (0.000114) (0.000112) (4.98e-05) (558.3) Household head is non-indigenous (1=yes) 0.0358 0.0552 0.00162 0.0164 -0.0247** -0.00550 -229,384***
(0.0368) (0.0411) (0.0286) (0.0136) (0.0115) (0.00613) -76,634 Household head is between 25 and 59 years
old (1=yes) 0.152 0.0390 0.0492 -0.0249 -0.390 0.0577 -167,173
(5.298) (0.788) (0.633) (0.198) (0.808) (0.188) (5.438e+06) Household head is above 59 years old (1=yes) 0.116 0.0251 0.0263 -0.0145 -0.375 0.0543 -107,634
(5.297) (0.784) (0.633) (0.197) (0.808) (0.188) (5.452e+06) There are children below age 5 in the
household (1=yes) -0.0299 0.0465* -0.0118 0.00987 -0.00611 -0.00192 4,046
(0.0322) (0.0263) (0.0201) (0.00952) (0.0146) (0.00856) (84,163) There are children between 5 and 15 years in
the household (1=yes) 0.0112 -0.0204 0.0155 0.00717 -0.0266 0.000204 112,097
(0.0407) (0.0268) (0.0273) (0.00987) (0.0190) (0.00862) (109,664) There are household members with primary
education (1=yes) 0.0520 -0.0351 -0.0283 0.0120 0.00861 0.00350 -181,661*
(0.0421) (0.0296) (0.0261) (0.0109) (0.0134) (0.00734) (93,211) There are household members with secondary
education (1=yes) 0.0132 -0.0364 -0.0269 0.0143* -0.00194 0.000640 -46,464
(0.0391) (0.0278) (0.0206) (0.00837) (0.0130) (0.00942) (74,556) There are household members with university
(1=yes) 0.104** -0.0366 -0.0330 0.0294* -0.0155 -0.00202 33,916
(0.0474) (0.0330) (0.0344) (0.0164) (0.0191) (0.00916) (141,703)
Area (0=urban,1= rural) 0.0352 -0.0330 0.0285 -0.00656 -0.0127 -0.00304 -81,795
(0.0427) (0.0269) (0.0270) (0.00779) (0.0157) (0.00934) (87,403) Assets if household owns land or buildings (1= yes) 0.0322 -0.0379 -0.0696 0.0236 -0.0275 0.0135 207,884 (0.119) (0.124) (0.0899) (0.0187) (0.0415) (0.00865) (201,833) _m0 0.00254 -0.0861 0.0425 0.0109 0.0868** -0.00681 60,944 (0.0911) (0.0562) (0.0516) (0.0261) (0.0399) (0.0260) (176,879) _m1 0.0335 -0.0446* 0.0236 0.00372 0.0269 -0.00468 19,416 (0.0414) (0.0246) (0.0194) (0.0121) (0.0171) (0.00989) (75,151) Sigma2 0.0215** 0.0129 0.00918** 0.00181** 0.00951 0.00154 9.414e+10* (0.00912) (0.00804) (0.00406) (0.000758) (0.00582) (0.000967) (4.903e+10) rho0 0.0222 -0.972** 0.569 0.329 1.141*** -0.222 0.255 (0.632) (0.476) (0.577) (0.666) (0.326) (0.667) (0.593) rho1 0.293 -0.504** 0.315 0.112 0.354* -0.153 0.0812 (0.298) (0.203) (0.222) (0.308) (0.199) (0.263) (0.260) Constant 2.096 -1.540* -1.305* 0.402* 0.496 -0.260 -1.144e+07* (5.313) (0.911) (0.709) (0.228) (0.851) (0.211) (5.893e+06)
Source: SMRHS 2009, Consortium pour la Recherche Économique et Sociale (CRES)
Notes. N=927 households. 523 remittance receiving households through informal channels, 404 remittance receiving households through formal channels. The
model also includes interactions of each of the exogenous variables with the inverse of expenditure, interaction with remittance, the inverse of total expenditure, an urban/rural dummy variable and eleven regional dummy variables, but the coefficients for these variables are not reported. Standard errors in parentheses, they are obtained by boostrapping (100 repetitions). The first stage of the model is shown in Table 4.
Table 5 : Household expenditure estimates (selection corrected) for households receiving remittance through formal channels, using the Dubin McFadden method
Variables Food Consumer goods, durables
Housing Education Health Productive
goods
Others
Log total annual household expenditure -0.0934** 0.0423 0.0251 -0.0102** 0.00351 -0.00398 1.021e+06*** (0.0412) (0.0291) (0.0166) (0.00432) (0.0117) (0.00960) (292,662) Remittances as percent of total annual expenditures
(including remittances) -0.0214 0.00754 0.00432 0.00207 0.00451 -0.000154 19,268 (0.0156) (0.00530) (0.00619) (0.00212) (0.00365) (0.00223) (59,708) Remittances as percent of total annual expenditures
(including remittances) X Log total remittances 0.00129** -0.000435* -0.000188 -9.28e-05 -0.000392** 1.22e-05 -1,701 (0.000519) (0.000224) (0.000158) (6.86e-05) (0.000189) (0.000123) (1,408) Household head is non-indigenous (1=yes) -0.0784 -0.00155 0.0355 0.0419* -0.0228* 0.00889 861.6
(0.0897) (0.0203) (0.0372) (0.0247) (0.0120) (0.00764) (107,979) Household head is between 25 and 59 years old
(1=yes) -0.225** -0.0234 0.0979 0.0293* 0.0104 0.0374 -1.176e+06**
(0.112) (0.0689) (0.0832) (0.0176) (0.0245) (0.0241) (539,760) Household head is above 59 years old (1=yes) -0.248** -0.00265 0.0898 0.0247 0.00960 0.0323 -1.068e+06**
(0.108) (0.0679) (0.0815) (0.0171) (0.0248) (0.0231) (530,295) There are children below age 5 in the household
(1=yes) 0.0692* -0.0187 -0.0248 0.00833 -0.00811 0.00942 -98,296
(0.0410) (0.0197) (0.0176) (0.00590) (0.0128) (0.00875) (85,911) There are children between 5 and 15 years in the
household (1=yes) -0.0297 0.0359 0.0127 0.00571 -0.0186 0.00211 52,864 (0.0676) (0.0337) (0.0172) (0.00717) (0.0173) (0.00825) (95,951) There are household members with primary education
(1=yes) 0.00176 -0.00591 0.00482 0.00118 0.00766 0.00826 -94,702
(0.0536) (0.0242) (0.0150) (0.00520) (0.0137) (0.00933) (139,578) There are household members with secondary
education (1=yes) -0.0137 -0.0114 -0.00981 0.00807 0.00208 -0.0109 -338,868 (0.0404) (0.0232) (0.0190) (0.00786) (0.0125) (0.0147) (219,720)
There are household members with university (1=yes) 0.111 -0.0471 -0.135* 0.0182 0.0181 -0.00388 119,190 (0.0908) (0.0540) (0.0752) (0.0140) (0.0370) (0.0249) (281,426) Area (0=urban,1= rural) 0.0339 -0.0308 -0.00532 -0.00938 -0.0136 -0.00614 -66,793
(0.0455) (0.0206) (0.0148) (0.00602) (0.0122) (0.0115) (85,737) Assets if household owns land or buildings (1= yes) 0.0757 0.00295 -0.0918** 0.0147 0.0245 -0.00636 158,017 (0.0568) (0.0290) (0.0415) (0.0102) (0.0233) (0.0147) (218,120) _m0 -0.0286 -0.00883 0.0205 -0.00375 0.00608 0.00460 -30,756 (0.0295) (0.0165) (0.0167) (0.00537) (0.0121) (0.00720) (73,636) _m1 -0.0157 -0.0348 0.0585 -0.0231 0.0186 -0.0136 -97,344 (0.0934) (0.0462) (0.0426) (0.0187) (0.0328) (0.0212) (185,676) Sigma2 0.0225* 0.00505 0.00578 0.00114 0.00281* 0.00173* 9.340e+10 (0.0119) (0.00320) (0.00468) (0.000733) (0.00151) (0.00101) (6.054e+10) rho0 -0.244 -0.159 0.346 -0.143 0.147 0.142 -0.129 (0.195) (0.258) (0.215) (0.201) (0.254) (0.212) (0.301) rho1 -0.135 -0.627 0.987* -0.878 0.450 -0.421 -0.409 (0.621) (0.664) (0.518) (0.581) (0.646) (0.567) (0.698)
Constant 2.078*** -0.574 -0.339 0.110 0.0293 -3.42e-05 -1.293e+07***
(0.596) (0.413) (0.255) (0.0687) (0.181) (0.144) (4.098e+06)
Standard errors in parentheses * Significant at the 0.1 level. ** Significant at the 0.05 level. *** Significant at the 0.01 level
Notes: N=927 households. 523 remittance receiving households through informal channels, 404 remittance receiving households through formal channels. The model
also includes interactions of each of the exogenous variables with the inverse of expenditure, interaction with remittance, the inverse of total expenditure, an urban/rural dummy variable and eleven regional dummy variables, but the coefficients for these variables are not reported. Standard errors in parentheses, they are obtained by boostrapping (100 repetitions). The first stage of the model is shown in Table 4.
Source: SMRHS 2009, Consortium pour la Recherche Économique et Sociale (CRES)
Table 6 : Household expenditure estimates (selection corrected) for households receiving remittance through informal channels, using the Dubin McFadden method
Receive remittances through Informal channel
Estimated marginal budget share Estimated marginal budget share Contrefactual marginal budget share Average Treatment Effects (ATT) Food 0,5160027 0,3683496 0,4565205 0.0594822*** (0.0063287)
Consumer goods, durables 0,0346806 0,1037418 0,0413589 -0.0066783
(0.006248) Housing 0,0443249 0,0902205 0,0506387 -0.0063138 (0.0057641) Education 0,0038906 0,0205906 0,0240065 -0.0201159*** ( 0.0017773) Health 0,038142 0,0884967 0,0618334 -0.0236914*** (0.0022042 ) Productive goods 0,0002755 0,0098954 0,0114431 -0.0111676*** (0.0016975 ) Other goods 0,3697295 0,3516167 0,3690625 0.0006671* (0.0081889) Total 1,0070458 1,0329113 1,0148636
Source: SMRHS 2009, Consortium pour la Recherche Économique et Sociale (CRES)
* Significant at the 0.1 level.
Receive remittances through Formal channel Expenditure Category
Notes: N=927 households. 523 remittance receiving households through informal channels, 404 remittance receiving
households through formal channels. Expenditure categories defined in Table 2. Estimated MBS refers to using the MBS coefficients for type s households with households of type s. Counterfactual MBS obtained using the MBS coefficients for households receiving remittances through formal channels with households receiving remittances through informal channels. Numbers in parenthesis are two tailed t-tests
Table 7 : Marginal budget shares on expenditure and Average Treatment Effects (ATT) for Households receiving remittances through Informal and Formal Channels
Ranked by total annual per capita
expenditure including remittances Percent of households in group
Mean of total annual per capita household expenditure (CFA) Percent of total household expenditure on education Marginal budget share to education (estimated) Marginal budget share to education (conterfactual) Average Treatment Effects (ATT) Percent difference (receive remittance through formal channels
vs informal channels)
Households receiving remittances through Unofficial channels
Lowest 20% 5.93 295599.1 0.0241201 0.0074333 Na Na Na Second 20% 15.11 557956.1 0.0276135 0.0084431 Na Na Na Third 20% 19.89 858698.2 0.0173984 0.0017409 Na Na Na Fourth 20% 27.34 1260225 0.0156381 -0.0023548 Na Na Na Top 20% 31.74 2963262 0.0143855 -0.0047748 Na Na Na All 100 1059621 0.021341 0.0038906 Na Na Na
Households receiving remittances through Official channels
Lowest 20% 18.56 291926.5 0.0176146 0.0788087 0.0393766 -0.0319433(-90.59)*** -81,1 Second 20% 28.22 565488.2 0.0361352 0.0303433 0.0302646 -0.0218215(-90.72 )*** -72,1 Third 20% 20.05 879075 0.029676 0.021353 0.0171238 -0.0153829(-40.89)*** -89,8 Fourth 20% 18.07 1320129 0.0324598 0.0177669 0.005594 -0.0079487 (-20.57)** -142,1 Top 20% 15.10 2967236 0.0376115 0.0081501 -0.000945 -0.00382981(-00.86) 405,3 All 100 1580281 0.0334677 0.0205906 0.0240065 -0.0201159(-110.32)*** -83,8
Source: SMRHS 2009, Consortium pour la Recherche Économique et Sociale (CRES)
* Significant at the 0.1 level.
Notes: N=927 households. 523 remittance receiving households through informal channels, 404 remittance receiving households through formal channels. Estimated MBS refers to using the
MBS coefficients for type s households with households of type s. Counterfactual MBS obtained using the MBS coefficients for households receiving remittances through formal channels with households receiving remittances through informal channels. Percent difference (Informal channels vs formal channels) calculated by dividing ATT by the value of the counterfactual MBS. Numbers in parenthesis are two tailed t-tests.
Ranked by total annual per capita expenditure including
remittances
Percent of households in
group
Mean of total annual per capita household expenditure (CFA) Percent of total household expenditure on productive goods Marginal budget share to productive goods (estimated) Marginal budget share to productive goods (conterfactual) Average Treatment Effects (ATT) Percent difference (receive remittance through formal channels
vs informal channels)
Households receiving remittances through Unofficial channels
Lowest 20% 5.93 295599.1 0.0293532 .0075297 Na Na Na Second 20% 15.11 557956.1 0.0126028 .0008228 Na Na Na Third 20% 19.89 858698.2 0.0026301 -.0022464 Na Na Na Fourth 20% 27.34 1260225 0.0003192 -.0054911 Na Na Na Top 20% 31.74 2963262 0.0095174 -.0116354 Na Na Na All 100 1059621 0.0141065 .0002755 Na Na Na
Households receiving remittances through Official channels
Lowest 20% 18.56 291926.5 0.0109964 -.0312608 .0038302 .0036995 (1.30) 9,7 Second 20% 28.22 565488.2 0.0130289 .0074332 .0103351 -.0095123(-5.28)*** -49,6 Third 20% 20.05 879075 0.004549 .0077284 .0147557 -.0170022 (-9.44 )*** -115,2 Fourth 20% 18.07 1320129 0.0038088 .012368 .0191982 -.0246892(-9.06)*** -128,6 Top 20% 15.10 2967236 0.0025289 .0167202 .0215059 -.0331413(-8.17)*** -154,1 All 100 1580281 0.0055216 .0098954 .0114431 -.0111676 (-6.58)*** -97,6
Source: SMRHS 2009, Consortium pour la Recherche Économique et Sociale (CRES)
Notes: : N=927 households. 523 remittance receiving households through informal channels, 404 remittance receiving households through formal channels. Estimated MBS
refers to using the MBS coefficients for type s households with households of type s. Counterfactual MBS obtained using the MBS coefficients for households receiving remittances through formal channels with households receiving remittances through informal channels. Percent difference (Informal channels vs formal channels) calculated by dividing ATT by the value of the counterfactual MBS. Numbers in parenthesis are two tailed t-tests.
Scientific Coordinator : Xavier Oudin (oudin@ird.pdr.fr) Project Manager : Delia Visan (delia.visan@ird.fr)
Find more on www.nopoor.eu Visit us on Facebook, Twitter and LinkedIn