Contents lists available atScienceDirect
Applied Geography
journal homepage:www.elsevier.com/locate/apgeog
Understanding the drivers of deforestation and agricultural transformations
in the Northwestern uplands of Cambodia
Rada Kong
a,∗, Jean-Christophe Diepart
b, Jean-Christophe Castella
c,d,e, Guillaume Lestrelin
c,f,
Florent Tivet
c,d, Elisa Belmain
c,f, Agnès Bégué
c,faDepartment of Agricultural Land Resources Management, General Directorate of Agriculture, Ministry of Agriculture Forestry and Fisheries, Toeuk Laak 3, Phnom Penh, Cambodia
bGembloux Agro-Bio Tech, University of Liège, Gembloux, Belgium cCIRAD, Université de Montpellier, Montpellier, France dCIRAD, UR AIDA, Avenue Agropolis, 34398, Montpellier, France
eIRD, Institut de Recherche pour le Développement, Avenue Agropolis, 34394, Montpellier, France fCIRAD, UMR TETIS, 500 rue J.-F. Breton, 34093, Montpellier, France
A R T I C L E I N F O Keywords: Land-cover changes Land-use drivers Remote sensing Rural migration Agricultural expansion Cambodia A B S T R A C T
At the end of the 1990s, the Northwestern uplands of Cambodia were one of the last forest frontiers of the country. In a region that was the last Khmer Rouge stronghold, the opening of former conflict zones after a peace agreement initiated a vast movement of agricultural colonization. This movement was economically triggered by high market demand for agricultural commodities such as maize and cassava and fueled by a massive flow of spontaneous in-migration of land-poor farmers from lowland regions around the entire country. Focused on four upland districts along a pioneer front of Northwestern Cambodia, we analyzed historical trajectories of land use/ cover changes using a chronological series of Landsat data from 1976 to 2016. We identified key drivers of deforestation using demographic data and qualitative information from local actors and other relevant stake-holders. We found a 65 percent forest cover loss due to conversion by smallholders into agricultural land for maize and cassava cultivation over a period of 15 years. The underlying mechanisms of land use change were further investigated to understand the diversity of individual farm trajectories and decision-making processes in relation to land conversion. These elements of diagnosis are essential to engage farming communities in in-novative land use systems and to develop sustainable alternatives to boom crops that have led to the current situation of land degradation and economic instability.
1. Introduction
Tropical deforestation stands out as a key feature of global land use changes (Hansen et al., 2013) although the arguments advanced to explain it are usually far from conclusive (Lambin et al., 2001). The factors and pathways driving deforestation are indeed intricate and result from multiple factors, both local and regional, originating from different levels of organization and acting in various combinations in different locations (Geist & Lambin, 2002).
In Cambodia, deforestation is associated with both rapid economic growth and agricultural expansion (Diepart & Sem, 2015) reflecting the emergence of boom crops all across Southeast Asia (Hall, 2011). Recent waves of deforestation have been quantified and documented, although mainly in relation with the development of agro-industrial plantations
granted as economic land concessions on state land (Davis, Yu, Rulli, Pichdara, & D'Odorico, 2015; Fella, Barua, Tamminen, & Hatcher, 2017). Little is known about other forms of forest conversion, particu-larly those produced by migrant smallholder farmers that are prevalent in the Northwestern corner of the kingdom. There, agricultural ex-pansion into forested upland margins has led to the emergence of new agrarian systems mainly based on annual crops such as maize, cassava, peanut, and soybean. In Pailin and Battambang Provinces as a whole, the area of these crops increased six fold between 2001 and 2015, from 40,000ha to 250,000ha in 2015 (MAFF, 2001,2015).
The region was the cradle of the Khmer Rouge (KR) uprising in the sixties and the rear base of their resistance against governmental forces in the eighties and nineties. In this region, the KR reintegration policy had designated new settlement and administrative areas in which KR
https://doi.org/10.1016/j.apgeog.2018.12.006
Received 6 April 2018; Received in revised form 29 November 2018; Accepted 13 December 2018 ∗Corresponding author.
E-mail addresses:[email protected](R. Kong),[email protected](J.-C. Diepart),[email protected](J.-C. Castella),
[email protected](G. Lestrelin),[email protected](F. Tivet),[email protected](E. Belmain),[email protected](A. Bégué).
0143-6228/ © 2018 Elsevier Ltd. All rights reserved.
soldiers were allowed to resettle and where their representatives were given responsibilities in land management. The subsequent allocation of forested land to demobilized soldiers and their families then marked the opening of the agricultural frontier, which created incentives for further migration (Diepart & Dupuis, 2014).
A first body of literature looking at agrarian changes in the region focuses on the political economy of land governance. It argues that land has emerged as common ground between a moving population and the combatant forces seeking to control them with a legitimized use of force (Pilgrim, Ngin, & Diepart, 2012). It also suggests that the struggles between KR and neoliberal modes of land control are central to state formation processes (Diepart & Dupuis, 2014).
A second body of knowledge examined the economics of boom crop production and the commercialization of smallholder agriculture. This literature argues that despite a quick increase in farm income and household assets in the early stages of the boom (Kem, 2017), agri-cultural expansion quickly made the farmers highly dependent on market fluctuations and generated negative impacts, including soil degradation and reductions in yield and crop profitability (Belfield, Martin, & Scott, 2013;Kong et al., 2016;Montgomery, Martin, Guppy, Wright, & Tighe, 2017).
However, the literature does not sufficiently capture the actual pathways of land use/cover change (LUCC) in the Northwest and in particular the institutions and mechanisms that are involved in the changes. To shed light on these processes, we have developed a multi-scale analysis that examines agrarian change over the past 40 years in the upland areas of Battambang and Pailin Provinces. This paper en-deavors three things. Firstly, we set the magnitude of land cover changes at the landscape level (covering four districts) using remote sensing technologies. Secondly, by drawing on secondary data, we identify the proximate causes and underlying factors that have driven land cover changes. Thirdly, based on primary data collected during fieldwork conducted in 2016 and 2017 in one specific district of the study area, we develop a graphic representation of LUCC mechanisms that allow for a detailed understanding of the interactions between the multiple drivers of changes along with the variations of these interac-tions across time and space.
2. Methodology
2.1. Framing the LUCC analysis: a multi-scale approach
Changes in land cover (biophysical attributes of the Earth's surface) and land use (human intentions applied to these attributes) are complex and dynamic (Lambin et al., 2001). They are driven by a combination of factors in synergic interaction, acting at different scales and originating from different levels of organization in the social-ecological systems (Geist & Lambin, 2002; Turner & Meyer, 1994). Recent research has proposed moving beyond simplistic linear causation models of LUCC to include an empirically rooted understanding and interpretation of a large number of factors interacting at different temporal and spatial scales (Lambin, Geist, & Lepers, 2003).
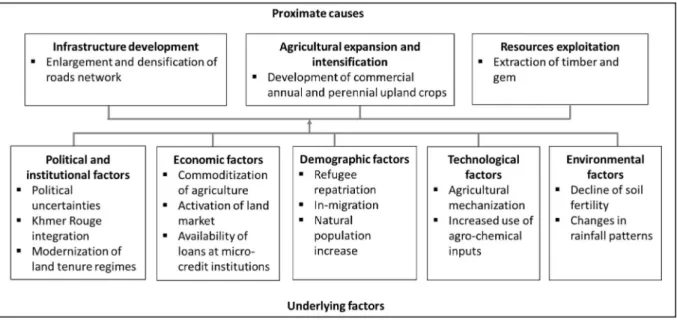
To account for the change of land cover and land use observed in the Northwestern uplands of Cambodia, we have adapted the framework developed byGeist and Lambin (2002)as shown inFig. 1. We have used this framework as it clearly differentiates proximate causes oper-ating at the local level and underlying forces which originate from re-gional or even global levels. Proximate (or direct) causes of land-use change constitute human activities or immediate actions that originate from intended land use and directly affect land cover, while underlying (or indirect, or root) driving forces are fundamental forces that un-derpin the more proximate causes of land-cover change (Lambin et al., 2003). Based on the literature review relevant to the agricultural ex-pansion in the Northwest of Cambodia (Diepart & Dupuis, 2014; Die-part & Sem, 2015, 2018;Montgomery et al., 2017; Touch, Martin, Scott, Cowie, & Liu, 2016, 2017), we identified three main categories of proximate causes: agricultural expansion and intensification, infra-structure development, and resources exploitation, and five main ca-tegories of underlying factors: political and institutional factors, eco-nomic factors, demographic factors, technological factors, and environmental factors (Fig. 1). In addition, a number of elements of each proximate cause and underlying factor are defined as working hypothesis. The comprehensive analysis of LUCC therefore consists of investigating interactions as well as causal relations between proximate causes and underlying driving forces (Lambin et al., 2003).
2.2. Study site and data collection
The study area is located along a pioneer front in the Northwestern Cambodian uplands (Fig. 2). The study area covers 3,200 km2with a total population of 158,000 people (PDP-BB, 2015;PDP-PL, 2015). It shares borders with Thailand in the west and was a KR stronghold until 1998. It includes four districts, namely Sala Krau and Pailin districts that belong to Pailin province and Samlout and Rotonak Mondol dis-tricts that belong to Battambang province.
Our analysis proceeded at two different levels along a three-step process (Table 1). We first conducted an analysis of land cover changes from 1976 to 2016 using remote sensing technologies for the entire study area. We then combined this spatial analysis of the nature and extent of land use/cover changes with field surveys to identify prox-imate causes and underlying factors of the observed historical changes. Finally, we carried out a detailed analysis of land use pathways only in
Rotonak Mondol District, where several of the authors have been in-volved in field activities since 2010.
2.2.1. Land use/cover classification
The LUCC analysis rests on a collection of Landsat Multispectral Scanner (MSS) and Thematic Mapper (TM) scenes acquired from the US Geological Survey site (http://earthexplorer.usgs.gov/) for six dates: 1976, 1997, 2002, 2006, 2010, and 2016 (Appendix 1). These dates were chosen based on the previous forest cover inventory at the country scale conducted by the Forestry Administration of the Ministry of Agriculture Forestry and Fisheries (Forestry Administration, 2010; McKenney & Prom, 2002; Mekong Secretariat & River Commission, 1994) and important historical milestones of LUCC identified in the literature (Diepart & Dupuis, 2014;Diepart & Sem, 2018;Pilgrim et al., 2012). Images were selected from relatively cloud-free acquisitions (< 10 percent clouds) and at the same period of the year, during the Fig. 2. Location of the study area.
Table 1
Data collection and analysis across scales.
Analyses Scale Input Data Analytical processes Outputs
Patterns of LUCC Rotonak Mondol, Samlout, Pailin and Sala Krau Districts
- Landsat scenes 1976, 1997, 2002, 2006, 2010, and 2016
- Ground control points collected in 2016
- Image pre-processing and classification
- Accuracy assessment and image post-processing
- LUC classification and maps - Quantification of land cover
changes Proximate causes
and underlying factors of LUCC
- Official statistics: census 2008 (NIS, 2009) and commune database 2006–2015 (NCDD, 2010; PDP-BB, 2015;PDP-PL, 2015)
- Secondary sources 2001–2016 (PDAFF-BB, 2016; PDAFF-PL, 2016;MPWT & JICA, 2003;MLMUPC, 2005;LICADHO, 2011; andPDLMUPC, 2014)
- Categorization of drivers of land use changes
- Sectoral analysis of proximate causes and underlying factors
- Framework of proximate causes and underlying factors
Pathways of LUCC Rotonak Mondol District - Individual interviews of resource persons and farmers in 2016
- Focus group discussions with resource persons in 2016
- Qualitative data analysis - Graphic representation of LUCC
- Explanation of LUCC mechanisms
Cambodian dry season from December to April.
The image pre-processing consisted of converting the Digital Number into Top-of-Atmosphere reflectance, resampling the 1976 MSS image at TM spatial resolution (from 60 m to 30 m), mosaicking the two Landsat scenes covering the study area, and sub-setting to encompass the study area. The classification process combined supervised classi-fication (maximum likelihood algorithm) with ENVI 5.0 software and visual image interpretation with QGIS 2.14, applied to the six images. Based on 1,474 ground control points randomly collected during a field survey in March 2016 and a false color composition (Near infrared for red, green for blue, red for green) of the 2016 image, we created by visual interpretation a ground data set made of polygons labeled into nine classes: water, artificial, paddy rice, annual upland crops, tree crops, grass, bush, degraded forest, and dense forest (Appendix 2). To build the ground data sets for the classification of the historical images (1976–2010), we established a look-up table between the observed land cover and the color composition of Landsat image based on the 2016 ground data set, and then used it as reference to photo-interpret and draw the polygons creating the data set for each previous date. The photo-interpretation was also verified with the retrospective interviews with local people referring to major areas of LUCC, and the same set of false color used in 2016 was applied to improve the visual interpreta-tion.
Each ground data set was randomly split into training (50 percent) and validation (50 percent) data sets. Ten image layers were used in the classification process: five spectral bands (blue, green, red, near in-frared, and short-wave infrared) except for the 1976 MSS image as only three (green, red, and near infrared) were available, two spectral in-dices (Normalized Difference Vegetation Index – NDVI, Normalized Difference Water Index – NDWI), and three texture indices (homo-geneity, entropy and correlation). The NDVI and NDWI were calculated using respectively the equation [NDVI = (Near Infrared band – Red band)/(Near Infrared band + Red band)] developed byRouse, Haas, Schell, and Deering (1974), and the equation [NDWI = (Near Infrared Band – Short Wave Infrared Band)/(Near Infrared Band + Short Wave Infrared Band)] developed by Gao (1996). The texture indices were derived from the grey level co-occurrence matrix (GLCM) (Haralick, Shanmugam, & Dinstein, 1973).
The accuracy assessment showed overall classification accuracies between 74 and 93 percent with Kappa coefficients between 0.73 and 0.92 respectively (Appendix 3). Finally, the land cover maps were post-processed by filters application, vectorization and LULC correction. The filters application was done in three steps: Sieve Classes (group min threshold: 2, number of neighbor: 4), Clump Classes (7 × 7), and Majority analysis (majority with 5 × 5).
2.2.2. Proximate causes and underlying factors of LUCC
Proximate causes and underlying factors of LUCC were first identi-fied through the literature review and were pre-classiidenti-fied as presented in Fig. 1, using the conceptual framework proposed by Geist and Lambin (2002). We subsequently used them as working hypothesis to be gradually checked and validated through triangulation with dif-ferent datasets. The local expressions and implications of LUCC drivers were investigated through qualitative methods based on semi-struc-tured interviews of resource persons. The respondents were witnesses of recent LUCC selected through snowball sampling process for their in-timate knowledge of causes and factors of changes (Appendix 6). The information obtained through their singular stories and individual perceptions of local changes were then generalized during focus group discussions. These collective sessions gathered some of the individual respondents and additional key actors of LUCC identified during the individual interviews (Appendix 6). They provided a broader perspec-tive on the drivers of LUCC at the district level. Then, in-depth inter-views of 95 farmers selected through stratified random sampling al-lowed to quantify some of the information provided during the previous surveys such as e.g. yield decreases after a few years of monocropping
or in-migration trends.
We also validated working hypotheses on land cover change by triangulating with official statistics derived from government data-bases. The expansion of the road network was quantified based on four different datasets: 2001 (MPWT & JICA, 2003), 2005 (MLMUPC, 2005), 2011 (LICADHO, 2011) and 2014 (PDLMUPC, 2014). We derived data on population mobility and migration from the demographic census of 1998 and 2008 and we extracted other relevant socio-economic data spanning the period 2006 to 2010 from the national commune database (NCDD, 2010) and 2011 to 2015 from the provincial commune data-base (PDP-BB, 2015;PDP-PL, 2015).
We obtained yearly data of cultivated area of upland crops for the period 2001–2016 at the Provincial Departments of Agriculture, Forestry and Fisheries (PDAFF) of Battambang and Pailin. Yet, the da-taset was too fragmented (data not systematically available for each year and each location, or changing indicators over the years) to con-duct a multivariate statistical analysis of interactions within and lin-kages between proximate causes and underlying factors in relation with the LUCC. Therefore, validation was mostly done during the focus group discussions (Appendix 6) that were conducted in all the five communes of Rotonak Mondol District. Once an agreement was reached among participants on the list of proximate cause and underlying fac-tors of LUCC, they were asked to rank the level of influence of these causes and factors on observed LUCC in their commune as weak, medium, or strong. These qualitative assessments were finally used to estimate the strength of the relations between causes and factors and their impacts on LUCC in the study area.
We also used the different data described above to develop a spatial representation of the mechanisms of interaction between causes and factors ‘on the ground’ (i.e. territorial dynamics such as road expansion, land allocation along the roads, etc.) that led to the observed LUCC from remote sensing in our study site. The chorematic representation of territorial dynamics, originally developed byBrunet (1980), has been used on multiple topics in the French geography tradition. These gra-phic abstractions or models highlight the territorial structures and processes more than the element's exact location, as practiced by con-ventional mapping. While a map is a representation of a geographic space at a point in time, the chorem seeks to understand how it has been built up over time. This involves an analytical process, which begins with establishing the relationship between land use transformations and its drivers on the ground. These relationships are social con-structed; they are identified as socio-territorial logics by resource per-sons interviewed individually and confirmed collectively during focus group discussions. Because of delays in the design work, the graphic representation of LUCC (Fig. 9) could not be validated by the group that originally contributed the local knowledge. It was validated by the experts who worked for many years in the area, some of them being co-authors of the manuscript.
3. Results
3.1. Land use/cover change analysis
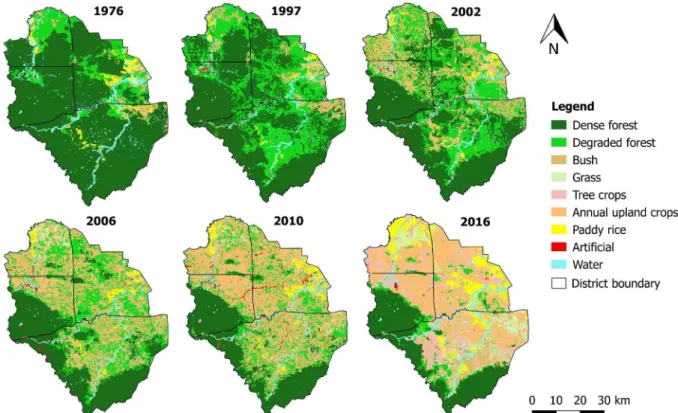
The most remarkable LUCC was observed between 1997 and 2006 (Fig. 3). Total forest cover (dense and degraded forestland) remained almost unchanged accounting for about 90 percent of the area between 1976 and 1997. However, around 13 percent of the dense forest area was converted to degraded forestland. During the following 20-year period (1997–2016), forest cover reduced dramatically, with only 25 percent remaining in 2016, and with a particular emphasis along the main roads. The 65 percent of forest cover loss occurred primarily be-tween 2006 and 2016.
It appears obvious that the forest cover was lost to agricultural land (Figs. 3 and 4). Agricultural land increased tremendously from 1 per-cent in 1997 to 61 perper-cent in 2016 with most of the conversion taking place between 2006 and 2016. Forest conversion occurred following
two main pioneer fronts: one started from the Northwestern part of Pailin Province bordering with Thailand and another one from the Northeast neighboring districts with densely populated lowlands. Forest conversion was relatively more intensive and homogenous in Pailin, especially from 2002 to 2010. In 2016, the area looked fully saturated with the remaining homogenous forest cover in the South and South-west, which was declared a protected area in 1993 (Royal Government of Cambodia, 1993) and a few spots scattered in the area which were not very suitable for agriculture due to steep slopes and rough terrain. The 61 percent of agricultural land in 2016 (208,163 ha) is con-stituted of around 80 percent annual upland crops, about 10 percent of tree crops and 10 percent of paddy rice. Annual upland crops expanded rapidly to constitute the single most important agricultural land use since 2002, meaning that the conversion of forest land was undeniably for annual upland crops (especially maize and cassava). Paddy rice area also increased noticeably between 2010 and 2016 but at a slower pace than annual upland crops. Paddy rice remains spatially fragmented due
to its need for hydromorphic conditions. Tree crops (i.e. rubber, longan and mango) emerged as an important land use in 2016. Overall, the large areas of tree crops and annual upland crops were developed mainly on dense forest (54 percent) and degraded forest (40 percent) while paddy rice was developed on degraded forest (53 percent) and bush (24 percent) (Appendix 4).
3.2. Drivers of land use/cover change
The proximate causes and underlying factors that were identified and then through the successive steps described in the method section are presented inFig. 5. Each of them is described in the following sub-sections.
3.2.1. Proximate causes of LUCC
3.2.1.1. Resource exploitation: the rush for timber and gems. Timber logging and gem exploitation started in the early 1980s along the Fig. 4. Evolution of LUCC over the last four decades in the study area based on time series of remote sensing data.
borderlands and intensified from 1990 when a commercial agreement was reached between the KR, Thai companies and the Thai military (Le Billon, 1999). The Thai National Intelligence Agency reports that the KR generated approximately 106 million USD of income from timber exploitation between 1989 and 1992 (Stier, 1993). For the same period, the Thai Forestry Statistics reported timber imports equivalent to 687,809 cubic meters. By 1992, a total of 16 logging concessions were leased to Thai companies (Le Billon, 1999). Gem mining also witnessed a remarkable development in Pailin and Samlout. Mining started in 1989 with 6000 miners and traders, expanding rapidly at an industrial scale with approximately 45 companies and 150 mined fields (Lechervy, 1996) and an average monthly income estimated at 5 million USD between 1990 and 1992 (Le Billon, 1999).
Although gem resources were rapidly exhausted, logging continued despite embargos on timber trading with the KR imposed by the gov-ernment and the international community. The total quantity of logs exported by the KR from 1990 to 1998 amounted to 2.5 million cubic meters, which equaled the government's official exports during the same period. In fact, a large part of the logs exported by the government also originated from the KR controlled areas since the government agreed to recognize all the concession contracts signed with the Thai companies and the KR (Le Billon, 1999).
3.2.1.2. Infrastructure development: paving the way to agricultural expansion. The dramatic expansion of agricultural areas occurred concurrently with the improvement and densification of the road network. While the war had left the rural infrastructure severely damaged and under total lack of maintenance (ADB, 2001), the Thai logging companies established in the North-Western region contributed to the considerable expansion of the road network for the purposes of timber extraction and exportation. Then, in 1996, the SEILA program
together with a ‘food for work’ program carried out by the International Labor Organization and the World Food Program also mobilized funds from international aid to rehabilitate the rural infrastructure (Schulz & Huyssteen, 1999). Finally, in 2001–2005, an Asian Development Bank (ADB) loan financed the restoration and upgrading of all national and provincial roads throughout the Northwestern provinces (ADB, 2001). Consistently, we compiled the four datasets and harmonized the information on road surface by differentiating three categories (asphalt, laterite and dirt road). Between 2001 and 2011, in the studied districts, the total length of (mainly laterite and dirt) roads increased sharply from 544 km to 2,529 km (Appendix 5). The increase was particularly important in Samlout and Rotonak Mondol Districts which benefited from large, pre-existing road networks before the war. Although 2014 data is not available for Pailin and Sala Krau, the road network ex-pansion probably continued as in Samlout and Rotonak Mondol from 1,731 km in 2011 to 2,719 km in 2014. The decrease of laterite roads in 2011 could be explained by degradation due to intensive uses and floods, or possibly by inconsistencies between the different data sources.
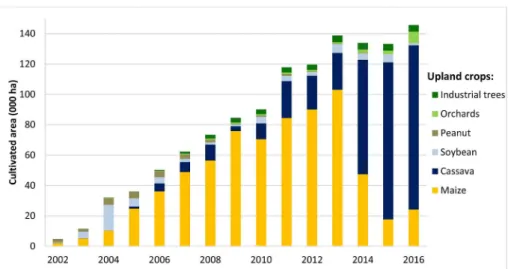
3.2.1.3. Agricultural expansion and intensification: shift to upland boom crops. According toagricultural statistics of PDAFF, the cultivated area in rainy seasons of annual and perennial upland crops (excluding paddy areas) in all study districts increased exponentially from a few thousand hectares to 145,000 ha1over the past 15 years (Fig. 6). Soybean and
peanut were the dominant crops before 2004, although they were Fig. 5. Historical milestones of proximate causes and underlying factors of LUCC.
1Comparison of provincial statistics with the remote sensing data on annual and perennial crops shows a 23% difference in favor of remote sensing data. This could be explained by an underestimation by state actors of the extent of agricultural expansion in order to minimize forest conversion figures.
replaced afterwards by hybrid maize. The area of maize increased sharply at 72 percent per year between 2001 and 2009, while cassava expanded rapidly from 2014, mainly at the expense of maize, to cover 80 percent of the total agricultural land in 2016. The area under industrial trees expanded between 2006 and 2009 at around 130 percent per year, mainly through the development of rubber plantations. Subsequent expansion then occurred with the development of pepper plantations. Orchards – made up of about 80 percent of mango and longan plantations – witnessed rapid expansion periods between 2005 and 2006 (mainly with longan in Pailin) and again between 2015 and 2016 (mainly with mango in Rotonak Mondol).
3.2.2. Underlying factors of land use changes
3.2.2.1. Politics and institutions: the intricacies of Khmer Rouge re-integration. Cambodia was strongly influenced by the Cold War and, from 1969, underwent a devastating civil war for almost three decades (Le Billon & Springer, 2007). Following the downfall of the KR regime in 1979, the country witnessed far-reaching political and institutional changes: from a socialist state to a market economy with the abandonment of the autarchic policy of the KR in 1989, from civil war to peace in 1991, and from a single-party regime to a multi-party democracy in 1993 (Le Billon, 2000).
But in the Northwest of Cambodia, the conflicts between KR forces and the government army continued until 1998. In a context of with-drawal of all foreign political and financial support to Cambodia in the late 1980s and with logging activities being completely banned in Thailand in 1989 (Hirsch, 1995), the KR leadership decided to exploit the country's natural resources in order to finance its guerrilla war against the Cambodian government. The exploitation and trade of timber and gems was organized by the KR through concessions nego-tiated with Thai companies (Le Billon, 2000;French, 2002). But forest exploitation also benefited the government after the adoption of eco-nomic liberalization measures which allowed foreign companies to in-vest in forest exploitation (Hameiri, 2010;Hughes, 2003).
That period was one of intense political instability. It is associated with the KR's withdrawal from the Paris peace accords in 1991, the uncertainties regarding the political transition following the 1993 na-tional election and competition between the two political parties con-stituting the national coalition, which were actually generating income from forest exploitation to build patronage networks across the country (Le Billon, 2002). In the absence of a consistent regulatory framework of timber extraction, the political turmoil had the effect of escalating timber extraction with each faction trying to generate as much income as possible. Overall, embargos on timber exportation from the KR controlled areas were never really effective (Le Billon, 1999).
In the mid-1990s, 23 protected areas covering about 3.3 million hectares (18 percent of national territory) including, in the study area, the Phnom Samkos Wildlife Sanctuary and Samlout Multiple Use Area (Royal Government of Cambodia, 1993). Starting from 1998, however, most of the unprotected forestland was allocated to demobilized the KR families and government soldiers following the so-called ‘win-win’ policy for the political settlement of the Cambodian conflict (Hun, 2006). Part of this reintegration policy aimed at providing the KR lea-ders with key positions within provincial and district administrations and lower-grade the KR representatives were given carte blanche to distribute land to demobilized soldiers. Given the considerable tracts of land suitable for cultivation, this reintegration marked the opening of the agricultural frontier and further created incentives for migration (Diepart & Dupuis, 2014).
3.2.2.2. Demography: population increase fueled by in-migration flows. Population growth, land concentration and atomization, along with a ban on state land clearing promulgated in the 2001 Land Law led to a rapid decrease of household land holdings in the lowland areas of Cambodia (Diepart, 2015). With limited opportunities for off-farm
employment, farmers in rural central rice-growing plains migrated to the peripheral uplands regions. As illustrated inFig. 7, this migration pattern had a significant impact on population growth in the four study districts. In 1997, a first migration peak coincided with the arrival of families repatriated from refugee camps located in Thailand. Subsequently, in-migration occurred with two important peaks in 2002 and 2007, consisting of migrants originating from neighboring districts and a flow of long distance migrants from the Southwest of the country where the demobilized KR soldiers are originally from (Diepart & Dupuis, 2014). In 2008 census data, the total population of the study area was 151,357 people of which 68 percent were migrants (NIS, 2009). Computation of the census data reveals that 72 percent of migrant household heads declared that their main reason for migration was the search for employment, while 72 percent of in-migrant population also considered farming as their primary occupation. Put together, these observations suggest that migration to the study area has been predominantly driven by farming households looking for agricultural land.
3.2.2.3. Economy: liberalization policies, growth and indebtedness. Measures taken in the late 1980s – early 1990s to liberalize the national economy did not seem to have any noticeable influence on the economic growth of the Northwest until the KR integration in 1998 (ADB, 2001). Subsequently, the flourishing of regional agri-businesses started to have impacts on the demand and price of cereals. In the mid-2000s, hybrid maize was introduced by the Charoen Pokphand group and widely adopted by local farmers looking for higher profits (World Bank, 2015). Local farmers could thus quickly improve their living conditions. The housing and living conditions as well as assets of households in the study area improved considerably in the late 2000s. Based on commune databases 2006–2010 (NCDD, 2010) and 2011–2015 (PDP-BB, 2015; PDP-PL, 2015), the percentage of households with improved housing and transport equipment considerably increased between 2006 and 2015: zinc roof (+35 percent), latrine (+47 percent), access to drinking water (+27 percent) and ownership of motorbikes (+34 percent). We attribute the improvement of living conditions to increasing crop incomes, but also to increasing access to credit.
3.2.2.4. Technology: intensification of upland farming practices. Based on the same commune database, the proportion of households to the number of tractors and power tillers increased by 2.4 and 8.4 percent respectively. Likewise, the percentage of households using pesticides and chemical fertilizers increased exponentially from 2006 to 2013 by 31 and 38 percent, respectively. The trend relative to pesticide use is confirmed by a 2011 survey conducted in Samlout and Sala Krau (Touch et al., 2016) as well as by key informant interviews and focus group discussions undertaken during the present study. In addition, information access to stimulation techniques for off-season fruit production encouraged the expansion of orchards since the harvest is scheduled for premium price seasons.
3.2.2.5. Environment: decline of soil fertility and changes in rainfall patterns. Depletion of soil fertility under cropping practices with intensive tillage, mono-cropping, and little (or no) biomass input to the soil is generally reported as the main reason for a decline of annual crop productivity in the study area (Boulakia, Kong, & Eberle, 2013; Kong et al., 2016). Declines of 27, 20 and 16 percent of yield for maize, soybean, and cassava respectively were reported from 2008 to 2012, with more than 50 percent of farmers interviewed attributing the yield drops to soil fertility depletion (Touch et al., 2016). According to the in-depth interviews, in 2008 the maize's yield was on average 6-7 t/ha in dry grain without any fertilizers on newly reclaimed land. But in 2016, the maize yield is only 4 t/ha even with 50–100 USD/ha investment on chemical fertilizers.
and led to adaptations of cropping practices by smallholder farmers. Historical rainfall data from 1920 to 2012 recorded at the Battambang station show that the dry period increased from 1 to 3 months changing the rainfall distribution from a bi-modal (peak in May and September) to a mono-modal (peak in October) pattern (Doch, Diepart, & Heng, 2015). These findings confirm farmers' complains about delayed rainy season, more frequent drought and dry spells (Touch et al., 2017). Such a decline in annual crop yields has had significant negative impacts on the profitability of farming activities. As the price of annual upland crop such as maize and cassava is low, the resource-rich famers switched most of their annual crop to orchards. The majority of resource-poor farmers continue to cultivate the annual crops since they can't afford to invest in orchard; the installation costs are on average 500 USD/ha for mango and 2000 USD/ha for longan. In addition, the stimulation of off-season production costs 3000–5000 USD/ha.
Environmental changes induced by new cropping practices then became a driver of further land use changes, such as abandonment of initial boom crops and conversion to orchards, off-farm employment and migration to Thailand, land consolidation of some big farmers with the departure of smaller ones.
3.3. Interactions between proximate causes and underlying factors We identified three key periods corresponding to relatively stable combinations of proximate causes and underlying factors of LUCC
(Fig. 8). The causes, factors, interactions, and their causal linkages are different in each period, and evolve from simple to more complex sy-nergies over time.
During the first period, the main cause of LUCC was the resources exploitation (timber and gems) driven essentially by the political and institutional factors (civil wars and socio-political instabilities). The Thai companies who exploited timber and gem resources constructed a network of earth roads connecting to Thailand. In turn, the gradual expansion of the road network helped intensify the exploitation. The continuation of civil wars and the progressive withdrawal of foreign support pushed the KR to generate income from further exploitation of the abundant natural resources. The economic driver was thus largely influenced by political and institutional factors, and together ac-celerated the extraction of natural resources.
A major cause of LUCC during the second and third periods was agricultural expansion and intensification, which was reinforced by rapid infrastructure development. However, it was largely supported by demographic movements (in-migration) during the second period in addition to socioeconomic development. During the third period, technological changes, especially through the introduction of agro-chemicals and mechanization, and environmental degradations (ero-sion of soils and biodiversity) triggered most of the changes in land use patterns. It appears that most of the changes in LUCC happened in the area were the influence of different factors combined as shown in the graphic representation inFig. 9.
Fig. 6. Changes in the cultivated area in rainy seasons of the main upland crops in the study area. Sources:PDAFF-BB (2016)andPDAFF-PL (2016)
Fig. 7. Percentage and arrival year of in-migrant population. Source: Census 2008
We identified two turning points in the land use history of the study area corresponding to moments of complete reorganization of the land use systems (Fig. 8). The first turning point was the end of the civil war. Socio-political instability and power competition, together with an embryonic legal framework and law enforcement were the underlying factors of LUCC. The impact on land use was tremendous as displayed in Fig. 9a.
Peace making processes enabled the return of refugees from the camps in Thailand and significant movements of internal migration into the study area. Demobilized soldier families in the district were allo-cated forest land along the road (30 m or 50 m width by 1000 m length). They gradually cleared the land to grow subsistence crops (paddy, sesame, mungbean, peanut, and upland rice) on small area ranging from 0.5 to 1.0 ha per year per family depending on the household size. All land was appropriated by 2002, but not yet cleared. Some families sold or abandoned the land and moved to the town, while the others called to their relatives from the lowlands to move and settle in the Northwestern uplands. Nevertheless, the high risks of malaria and mines has somehow limited these in-migration flows.
The second turning point is associated with the improved border market with Thailand for exporting agricultural produces and im-porting inputs. High profitability of annual upland crops, in particular hybrid maize, drove a massive expansion of agricultural land (Fig. 9b). The expansion depended on the capacity of each household to clear the forest, i.e. family labor force and capital available to hire other mi-grants to work for them. Agricultural intensification, based on soil til-lage, and use of chemicals inputs, rapidly affected the land productivity and the sustainability of intensive monocropping systems. Additional factors such as market fluctuations and rainfall uncertainties, pushed resource-rich famers to diversify their land use with orchards, livestock, and vegetables (Fig. 9c).
4. Discussion: understanding and influencing pathways of land use change
Our study intended to disentangle the complex processes of LUCC and the resulting land use patterns observed in Rotonak Mondol at successive dates over the past decades. This approach responded to a clearly stated need to develop a more refined understanding of drivers of change since indicators such as population growth, poverty, and road construction do not explain sufficiently LUCC in the Mekong Basin (Rowcroft, 2008). Interventions necessary for bending the curve to-wards more sustainable land use required additional insights into proximate causes and how they linked to underlying factors during the successive periods. Our comprehensive approach to LUCC combines qualitative data (literature review, interviews of resource persons and focus group discussions), and quantitative data (official statistical data, in-depth household surveys and remote sensing). It allowed to identi-fying the causes and factors then analyzing their interactions despite the fragmentation of available data (remote sensing and secondary data were not available for all dates or with the same geographic coverage) and inconsistencies across scales and periods. For example, different indicators used by different communes or change in time on data col-lection protocols did not allow for integration into statistical analyzes. While the proposed combination of methods (remote sensing and actor-based interpretations) allowed for LUCC interpretation at com-plementary spatial and temporal scales, it largely relies on the knowl-edge of the resource persons who were involved in the individual in-terviews and group discussions. The participant selection procedure and the facilitation skills of the researchers may therefore influence the results of the overall process. By combining individual and collective data collection processes, we managed the risk of biases due to power imbalance during group discussions. We also repeated the process in Fig. 8. Relations between proximate causes and underlying factors during the three periods (NB: the size of the arrows is related to the strength - strong, medium, weak - of the interactions between factors as expressed by participants during the focus group discussions).
five communes of the study district and took care of including re-dundancy in the profiles of respondents to multiply the perspectives on the causes and factors addressed during the interviews and discussions (Appendix 6).
The rapid forest clearance was mainly driven by (i) the need to secure land tenure before more migrants would arrive and appropriate the land and (ii) the high profitability of hybrid maize during the “maize boom” (Castella, Ornetsmüller, Lestrelin, Verburg, & Lienhard, 2016). As land prices were increasing, the poorest households tempted to sell out the land and searched for other forest tracts to clear in in-creasingly more marginal lands as the expansion reached less favorable soils: stony, hilly, and/or remote.Boulakia et al. (2013)explained this process as a second push-pull factor in which high prices were the pushing factor while the remaining forestlands were the pulling factor.
There was an active movement of land transactions over the whole study period, initially driven by incoming migrants and land expansion by smallholders, then more recently by land speculations and land appropriation by large-scale investors.
The patterns of LUCC associated with maize (2006–2011) and later cassava (2012–2014) that we described here in the Northwest of Cambodia are similar to the maize boom of the 1970s and the cassava boom of the 1980s that were observed in Northeast Thailand. They were also driven by highway roads construction, in-migration, the high profitability of newly introduced agricultural commodities, and avail-able land resources observed (Riethmüller, 1988; Scholz, 1988; Sirisambhand, 1988). Likewise, a maize boom occurred in Northern Vietnam in the 1990s (Keil, Saint-Macary, & Zeller, 2008) and in the 2000s in Laos PDR (Slaats & Lestrelin, 2009). In all cases they were Fig. 9. Graphic representation of the mechanisms of LUCC over three successive periods from 1976 to 2016.
pulled by available forest frontiers, weak land governance and pushed by emerging economic opportunity and access to agro-chemical inputs. Then in all these former marginal landscapes, smallholder farmers continued for a while to shift from one boom crop to another.
After maize, cassava is the second boom crop due to its capacity to utilize the last remaining soil nutrients and to provide better profit-ability (Sopheapa, Patanothaib, & Ayec, 2012;Wenjun, Maofen, Aye, & Srey, 2016). Unfortunately, cassava lasted shorter than maize since its yield dropped significantly after a few year of monocropping (Boulakia et al., 2013). The cassava boom also happened over the same period in Northeast Cambodia as described byMahanty and Milne (2016).
Farmers increasingly invested in the risky business of growing crops that are part of wider capitalist commodity production processes (Bernstein, 1977). High production costs due to increased agro-che-mical inputs, continuous depletion of soil fertility, an uncertain market and climate trapped smallholders in the indebtedness. The household survey in Rotonak Mondol District found that 70 percent of interviewed households had loans with one or more Micro Finance Institutions, with 85 percent of total loans per household ranging between USD 1000 and USD 1500.
The same patterns of boom and bust were experienced in Thailand (Sirisambhand, 1988) and at the global level across the Amazon de-forestation frontier (Rodrigues et al., 2009). The livelihoods of small-holders, that had improved gradually over the period of agricultural expansion and intensification (Touk, 2004), have deteriorated in rela-tion with heavy land degradarela-tion and yield declines (Martin et al., 2013; Montgomery et al., 2017;Touch et al., 2017), that led to in-debtedness, asset de-possession, and labor migration to Thailand (Diepart & Sem, 2018).
These changes marked the end of the agricultural expansion and intensification period. The agricultural frontier was reached long ago and there is no space left for agricultural expansion. The transforma-tions based on mechanization and heavy use of chemical inputs has shown its limits. It is therefore essential to reinvent a new agricultural model. The agrarian system is reaching a new turning point referred to as diversification inFigs. 8 and 9. The causes and factors of future land use changes are recombining again and there may be room for research to influence these changes towards more sustainable pathways.
While turning their former maize fields into orchard plantations, many smallholders are still in the mindset of economic speculation on farming without visible investment in the sustainability of their pro-duction practices. They shift from one high-price crop to another with the same logic although orchards represent much higher initial in-vestments and economic risks. Their capacity to seize the new economic opportunities depends very much on their patterns of capital accumu-lation over the previous period (Diepart & Dupuis, 2014;Mahanty & Milne, 2016). Wealthy farmers can afford to shift to orchards, while resource-poor farmers continue to bet on maize and cassava although some of them also diversify to livestock. The poorest households are left behind with no other option than selling their land and their labor force to the blossoming garment factories. During the recent land rush wave, some wealthy Cambodian from the cities (Battambang and Phnom Penh) and abroad (USA and Australia) as well as high ranking military officers bought large pieces of land and cleared them mechanically to install tree plantations, mainly orchards (Authors' survey, 2016).
Intervention methods need to adjust to the observed economic dif-ferentiation of farming systems. Each farm type has developed its own diversification logic and specific strategies to adapt to their changing environment. It is therefore crucial to understand the diversity of farms and their trajectories in time and space, and more importantly the
farming decision-making process for land use changes and agricultural innovations under complex factors interacting in these rapid dynamics. Specific intervention mechanisms are required to break the cycle of boom-bust development and to enhance the resilience and sustain-ability of the system from the farm to the landscape level.
5. Conclusions
The analysis of remote sensing data showed that 61 percent (208,163 ha) of forest cover was lost to upland crops over the last four decades in the study area. The remaining forest is located in protected areas. The LUCC in the Northwest of Cambodia is not a simple cause-effect relationship related to maize and cassava expansion, but rather a complex dynamic associated with different proximate causes and un-derlying factors interacting on different temporal and spatial scales.
Overall, three proximate causes and five underlying factors were identified. Their importance and their interactions are not the same along the three defined periods of changes. The agricultural expansion is the principal proximate cause of LUCC in the second period driven by market demand and high profitability of hybrid maize, vast available forest land with weak land governance and spontaneous in-migration of poor and landless farmers from populated lowlands. Agricultural transformations through technological innovations: machinery for land preparation and sowing, agro-chemical inputs also marked in the third period. Productivity decline of maize due to environmental degradation drove that third period of the agricultural diversification with a shift from cassava to orchards.
The boom crops engage smallholders in a risky business of growing crops that are part of a wider capitalist mode of production that al-ternately trap them into indebtedness and wage labor or outmigration to Thailand. It tends to broaden social differentiation with wealth ac-cumulated among a minority of privileged farmers. The wealthiest can afford to shift to orchards with off-season production that is considered as the current boom crop, whereas the smallholders continue to bet on uncertain maize and cassava benefits due to weather irregularities and price fluctuations. Without appropriate interventions, farmers will most likely continue to jump from one boom crop to the next and thus face repeated negative consequences that deteriorate their farming economy and degrade the landscape as a whole. Understanding agricultural di-versity and trajectories, as well as land use decisions will definitely help develop the appropriate interventions for resilient and sustainable farming systems.
Acknowledgements
We thank the farmers and the authorities in Rotonak Mondol dis-trict, Battambang province, who participated in this research. We are grateful to the officers of the provincial department of agriculture and planning in Battambang and Pailin province, who provided the agri-cultural and socio-economic data. We acknowledge the support of Ms. Audrey Jolivot at the Maison de la Télédétection in Montpellier, who supervised the first author for the analysis of remote sensing data, and of Ms. Malyne Neang at the ECOLAND research center of the Royal University of Agriculture, who facilitated the research implementation. The Agence Française de Développement (AFD) through the ACTAE project (Towards an Agro-ecological Transition in Southeast Asia) and Agropolis Foundation provided financial support to the research re-ported in this paper. We are very thankful to the journal editor and the two anonymous reviewers who made detailed and constructive com-ments.
Appendixes
Appendix 1. Landsat images used in the study
Year Acquired date Sensor Band and spatial resolution Reference WRS Path/Row Data projection
1976 17/01/1976 Landsat-2 MSS V, R, PIR1 (80 m) 137/51 WGS84-UTM 48N
1997 22/12/1997 Landsat-5 TM B, V, R, PIR (30 m) 127/51 WGS84-UTM 48N
1997 29/12/1997 Landsat-5 TM B, V, R, PIR (30 m) 128/51 WGS84-UTM 47N
2002 23/12/2003 Landsat-5 TM B, V, R, PIR (30 m) 127/51 WGS84-UTM 48N
2002 30/12/2003 Landsat-5 TM B, V, R, PIR (30 m) 128/51 WGS84-UTM 47N
2006 18/02/2005 Landsat-5 TM B, V, R, PIR (30 m) 127/51 WGS84-UTM 48N
2006 27/02/2005 Landsat-5 TM B, V, R, PIR (30 m) 128/51 WGS84-UTM 47N
2010 12/01/2009 Landsat-5 TM B, V, R, PIR (30 m) 127/51 WGS84-UTM 48N
2010 21/01/2009 Landsat-5 TM B, V, R, PIR (30 m) 128/51 WGS84-UTM 47N
2016 26/02/2016 Landsat-8 OLI- TIRS B, V, R, PIR, MIR (30 m)
PAN (15 m) 127/51 WGS84-UTM 48N
2016 14/04/2016 Landsat-8 OLI- TIRS B, V, R, PIR, MIR (30 m)
PAN (15 m) 128/51 WGS84-UTM 47N
Appendix 2. Predetermined LULC classes on the basis of supervised classification
No. Class name Description
1 Dense forest Forest land of native species without visible indication of human activities and significant disturbance of ecological processes. 2 Degraded forest Forest land of native species with a clear visibility of human activities and significant disturbance of ecological process. 3 Bush Wood and shrubland either evergreen or inundated, which also include the bamboo.
4 Grass Non-woody bush, grass, bared land
5 Tree crops Tree crops such as rubber trees, cashew nut, and orchard 6 Annual upland crop Annual upland crops such as cassava, maize, and upland rice 7 Paddy rice Lowland rice both rainfed and irrigated
8 Artificial Residential, commercial, industrial, and roads
9 Water Rivers, leaks, ponds and reservoirs
Appendix 3. Accuracy assessment of classification results based on confusion matrix
Overall Accuracy (%) Kappa
1976 93 0.92 1997 86 0.85 2002 85 0.84 2006 87 0.86 2010 83 0.82 2016 74 0.73
Appendix 4. Matrix of LUCC analysis between 1997 and 2016
1997 2016
Dense forest Degraded
forest Bush Grass Annual up-land crops Paddy rice Tree crops Artificial Water Unclassified 1997
km2 % km2 % km2 % km2 % km2 % km2 % km2 % km2 % km2 % km2 % km2 % Dense forest 643.6 99 157.9 82 92.3 35 29.5 22 941.8 54 8.4 4 86.9 55 4.4 14 0.0 0 4.2 40 1969.1 58 Degraded fo-rest 4.5 1 32.8 17 156.6 60 87.1 64 687.6 40 100.3 53 62.1 39 15.9 51 0.0 0 5.3 50 1152.3 34 Bush 0.1 0 1.0 1 11.3 4 18.6 14 94.0 5 46.3 24 7.5 5 0.1 0 0.0 0 1.0 10 180.1 5 Grass 0.0 0 0.1 0 0.3 0 0.5 0 4.4 0 7.2 4 0.6 0 1.1 4 0.0 0 0.0 0 14.2 0 Annual up-land cr-ops 0.0 0 0.2 0 0.3 0 0.3 0 5.1 0 2.0 1 2.2 1 1.3 4 0.0 0 0.0 0 11.5 0 Paddy rice 0.0 0 0.0 0 0.0 0 0.0 0 0.0 0 25.0 13 0.0 0 0.0 0 0.0 0 0.0 0 25.0 1 Tree crops 0.0 0 0.0 0 0.0 0 0.0 0 0.0 0 0.0 0 0.0 0 0.0 0 0.0 0 0.0 0 0.0 0 Artificial 0.0 0 0.0 0 0.0 0 0.0 0 0.0 0 0.0 0 0.0 0 8.4 27 0.0 0 0.0 0 8.4 0 Water 0.0 0 0.0 0 0.0 0 0.0 0 0.0 0 0.0 0 0.0 0 0.0 0 64 100 0.0 0 63.7 2 Unclassified 0.1 0 0.0 0 0.0 0 0.0 0 0.0 0 0.0 0 0.0 0 0.0 0 0.0 0 0.0 0 0.2 0 2016 Total 648 100 192 100 261 100 136 100 1733 100 189 100 159 100 31 100 64 100 11 100 3424 100 2016 (%) 18.9 5.6 7.6 4.0 50.6 5.5 4.7 0.9 1.9 0.3
Appendix 5. Expansion of road network with different road types
District Road type 2001 2005 2011 2014
Pailin Asphalt (km) 25 2 30 na Sala Krau 0 0 18 na Rotonak Mondol 0 35 34 145 Samlaut 0 0 0 0 Total 25 37 82 145 Pailin Laterite (km) 2 96 4 na Sala Krau 10 29 54 na Rotonak Mondol 53 168 68 421 Samlaut 10 164 43 727 Total 76 458 169 1148 Pailin Dirt (km) 62 163 370 na Sala Krau 98 227 321 na Rotonak Mondol 53 531 728 777 Samlaut 231 457 858 648 Total 443 1378 2277 1425 Total 544 1873 2529 2719
Note: na = not available data.
Source:MPWT & JICA (2003),MLMUPC (2005),LICADHO (2011)andPDLMUPC (2014).
Appendix 6. Presentation of survey methods and sampling procedures conducted in 10 villages of Rotonak Mondol District
Description Survey methods
Semi-structured interview 5 focus group discussions In-depth interview
Respondents Number participants 19 48 95
Female 5 8 19
Age (years) 53 ( ± 9) 49 ( ± 8) 46 ( ± 13)
Education (school
years) 6.5 ( ± 3.3) 7.6 ( ± 2.3) 4.5 ( ± 3.5)
Socio-economic
back-ground Elder villagers and local officials Elder villagers and local officials - Upland crop-based smallholderfarm - Upland crop-based large-scale farm
- Off-farm income dominated farm
- Paddy-based farm
Selection procedure Snowball selection Snowball selection Stratified random sampling
When January 2016 April 2016 December 2016
Duration 1–2 h 3–4 h 1.5–2 h
Contents - Village history
- Land use and land cover: changes and drivers
- In-migration process
- Land access and conversion of forest to agricultural land
- Access to market and credit - Technical and organizational
innova-tions
- Perception on crop productivity and land degradation
- Important changes of land use and land cover - Drivers of changes: causes and factors
- Interactions within and linkages between causes and factors
- Defining levels (strong, medium, weak) of importance for each interaction and linkage
- Migration
- Farm's capital: land, labor, fi-nance, and asset
- Farm's activities and incomes - Land uses
- Farming practices and inno-vation
- Farming constraints - Access to technology, credit,
and market
References
ADB. (2001). Report and recommendation of the president to the board of directors on a
proposed loan to the kingdom of Cambodia for the northwestern rural development projectPhnom Penh: Asian Development Bank.
Belfield, S. C., Martin, R. J., & Scott, J. F. (2013). Alternative cropping systems for north-west Cambodia. International Journal of Environmental and Rural Development, 4(1), 209–214.http://iserd.net/ijerd41/41209.pdf.
Bernstein, H. (1977). Notes on capital and peasantry. Review of African Political Economy, 4, 60–73.https://doi.org/10.1080/03056247708703339.
Boulakia, S., Kong, R., & Eberle, M. (2013). Sustainable farming to sustain Cambodia's future (p. 27mn) Phnom Penh. Retrieved fromhttps://vimeo.com/132231970. Brunet, R. (1980). La composition des modèles dans l ' analyse spatiale. Espace
Géographique, 9(4), 253–265.https://doi.org/10.3406/spgeo.1980.3572. Castella, J. C., Ornetsmüller, C., Lestrelin, G., Verburg, P., & Lienhard, P. (2016).
Mitigating the negative impacts of the maize boom on landscapes and livelihoods in Laos. AC and SD 2016 Agri-Chains and Sustainable Development: linking local and global
dynamics (pp. 10–12). Montpellier: CIRAD CIRAD.
Davis, K. F., Yu, K., Rulli, M. C., Pichdara, L., & D'Odorico, P. (2015). Accelerated de-forestation driven by large-scale land acquisitions in Cambodia. Nature Geoscience, 8, 772.https://doi.org/10.1038/ngeo2540.
Diepart, J. C. (2015). The fragmentation of land tenure systems in Cambodia: Peasants and the formalization of land rights. Country Profile: Cambodia: Vol. 06Paris, France: Foncièr et Développement. Retrieved fromhttps://orbi.uliege.be/handle/2268/ 183306.
Diepart, J. C., & Dupuis, D. (2014). The peasants in turmoil: Khmer Rouge, state for-mation and the control of land in northwest Cambodia. The Journal of Peasant Studies, 41(4), 445–468.https://doi.org/10.1080/03066150.2014.919265.
Diepart, J., & Sem, T. (2015). The Cambodian peasantry and the formalisation of land rights: Historical overview and current issues. Liège: Groupe de Recherches Asie de l'Est et du Sud Est (GRAESE). https://orbi.uliege.be/bitstream/2268/186135/1/DIEPART-SEM_2015_Cambodian-Peasantry-Formalization-Land-Rights.pdf.
Diepart, J., & Sem, T. (2018). Fragmented territories: Incomplete enclosures and Agrarian change on the agricultural frontier of Samlaut District, North‐West Cambodia. Journal of Agrarian Change, 18(1), 156–177.https://doi.org/doi:10.1111/joac.12155. Doch, S., Diepart, J.-C., & Heng, C. (2015). A multi-scale flood vulnerability assessment of
Sangkae River watershed, Battambang province. In J.-C. Diepart (Ed.). Learning for resilience: Insights from Cambodia's rural communities (pp. 19–49). Phnom Penh: The Learning Institute.https://orbi.uliege.be/handle/2268/179169.
Fella, T., Barua, S., Tamminen, L., & Hatcher, J. (2017). Systematic and rapid assessment of concessions using GIS and remote sensing: The case of economic land concessions in Cambodia. Responsible land governance: Towards an evidence based approach. Annual
World Bank conference on land and poverty. Washington DC: World Bank. Forestry Administration (2010). Cambodia forestry outlook study. Working Paper No.
APFSOS II/WP/2010/32Bangkok: Food and Agriculture Organization of the United Nations.
French, L. (2002). From politics to economics at the Thai–Cambodian border: Plus Ça change. International Journal of Politics, Culture, and Society, 15, 427–470.https://doi. org/10.1023/a:1014028510016.
Gao, B. (1996). NDWI—A normalized difference water index for remote sensing of ve-getation liquid water from space. Remote Sensing of Environment, 58(3), 257–266. https://doi.org/10.1016/S0034-4257(96)00067-3.
Geist, H. J., & Lambin, E. F. (2002). Proximate Causes and Underlying Driving Forces of Tropical Deforestation: Tropical forests are disappearing as the result of many pres-sures, both local and regional, acting in various combinations in different geo-graphical locations. BioScience, 52(2), 143–150 https://doi.org/10.1641/0006-3568(2002)052[0143:PCAUDF]2.0.CO;2.
Hall, D. (2011). Land grabs, land control, and Southeast Asian crop booms. The Journal of Peasant Studies, 38, 837–857.https://doi.org/10.1080/03066150.2011.607706. Hameiri, S. (2010). State building, patronage and the anti-pluralist politics of stability in
Cambodia. Regulating Statehood: State Building and the Transformation of the Global Order (pp. 177–207). London: Palgrave Macmillan UK.https://doi.org/10.1057/ 9780230282001_8.
Hansen, M. C., Potapov, P. V., Moore, R., Hancher, M., Turubanova, S. A., Tyukavina, A., et al. (2013). High-resolution global maps of 21st-century forest cover change. Science, 342, 850–853.https://doi.org/10.1126/science.1244693.
Haralick, R. M., Shanmugam, K., & Dinstein, I. (1973). Textural features for image clas-sification. IEEE Transactions on Systems, Man, and Cybernetics, SMC, 3(6), 610–621. https://doi.org/10.1109/TSMC.1973.4309314.
Hirsch, P. (1995). Thailand and the new geopolitics of Southeast Asia: Resource and environmental issues. In J. Rigg (Ed.). Counting the costs: Economic growth and
en-vironmental change in Thailand (pp. 235–259). Singapore: Institute of Southeast Asian
Studies.
Hughes, C. (2003). The Political Economy of Cambodia's Transition, 1991-2001. RoutledgeCurzon. Retrieved fromhttps://books.google.fr/books?id= pwM9mQEACAAJ.
Hun, S. (2006). Closing speech delivered at the Open Academic Forum Commemorating the
Fifteen Anniversary of the Political Settlement on the Cambodian Conflict. Phnom Penh:
Council of Ministers of the Royal Government of Cambodia.
Keil, A., Saint-Macary, C., & Zeller, M. (2008). Maize boom in the uplands of Northern
Vietnam: economic importance and environmental implications. Discussion Paper No. 4/
2008Stuttgart: Universität Hohenheim.
Kem, S. (2017). Commercialisation of Smallholder Agriculture in Cambodia: Impact of the
Cassava Boom on Rural Livelihoods and Agrarian Change. Brisbane: The University of
Queensland.
Kong, R., Sar, V., Leng, V., Trang, S., Boulakia, S., Tivet, F., et al. (2016). Conservation agriculture for climate-resilient rain-fed uplands in the western regions of Cambodia: Challenges, opportunities, and lessons from a 10-year R&D program. In P. E. Sajise, M. C. H. Cadiz, & B. R. Bantayan (Eds.). Learning and Coping with Change: Case Stories
of Climate Change Adaptation in Southeast Asia (pp. 55–81). Los Baños: The Southeast
Asian Regional Center for Graduate Study and Research in Agriculture (SEARCA). Lambin, E. F., Geist, H. J., & Lepers, E. (2003). Dynamics of land-use and land-cover
change in tropical regions. Annual Review of Environment and Resources, 28(1), 205–241.https://doi.org/10.1146/annurev.energy.28.050302.105459.
Lambin, E. F., Turner, B. L., Geist, H. J., Agbola, S. B., Angelsen, A., Bruce, J. W., et al. (2001). The causes of land-use and land-cover change: Moving beyond the myths. Global Environmental Change, 11(4), 261–269. https://doi.org/10.1016/S0959-3780(01)00007-3.
Le Billon, P. (1999). Power is consuming the forest: The political ecology of conflict and re-construction in Cambodia. University of Oxford. Retrieved fromhttps://ora.ox.ac.uk/ objects/uuid:9dd5daa2-704c-4909-850a-d4d64294cce3.
Le Billon, P. (2000). The political ecology of transition in Cambodia 1989–1999: War, peace and forest exploitation. Development and Change, 31, 785–805.https://doi.org/ 10.1111/1467-7660.00177.
Le Billon, P. (2002). Logging in muddy waters: The politics of forest exploitation in Cambodia. Critical Asian Studies, 34, 563–586.https://doi.org/10.1080/ 1467271022000035938.
Le Billon, P., & Springer, S. (2007). Between war and peace: Violence and accommodation in the Cambodian logging sector. In W. De Jong, D. Donovan, & K.-I. Abe (Eds.). Extreme Conflict and Tropical Forests (pp. 17–36). Dordrecht: Springer Netherlands. https://doi.org/10.1007/978-1-4020-5462-4_2.
Lechervy, C. (1996). L'économie des guerres cambodgiennes: Accumulation et dispersion. In F. Ean, & J.-C. Rufin (Eds.). Economie des guerres civiles (pp. 189–232). Paris: Hachette.
LICADHO. (2011). Road database. Phnom Penh: Cambodian League for the Promotion and Defense of Human Rights (LICADHO).
MAFF (2001). Annual report 2001-2002Phnom Penh: Ministry of Agriculture Forestry and Fisheries (MAFF).
MAFF (2015). Annual report 2015-2016Phnom Penh: Ministry of Agriculture Forestry and Fisheries (MAFF).
Mahanty, S., & Milne, S. (2016). Anatomy of a boom: Cassava as a ‘gateway’ crop in Cambodia's north eastern borderland. Asia Pacific Viewpoint, 57(2), 180–193.https://
doi.org/10.1111/apv.12122.
Martin, B., Farquharson, B., Spriggs, J., Fitzgerald, R., Scott, F., El, S., et al. (2013).
Enhancing production and marketing of maize and soybean in north-western Cambodia and production of summer crops in north-eastern Australia. Canberra: Australian Centre
for International Agricultural Research (ACIAR).
McKenney, B., & Prom, T. (2002). Natural resources and rural livelihoods in Cambodia: A baseline assessment. Working paper 23 Phnom Penh: Cambodia Development Resource Institute (CDRI). Retrieved from https://www.cdri.org.kh/publication-page-old/pub/wp/wp23e.pdf.
Mekong Secretariat, & River Commission (1994). Cambodia Land Cover Atlas (1985/87 to
1992/1993). Phnom Penh: Food and Agriculture Organization of the United Nations
(FAO) and United Nations Development Programme (UNDP).
MLMUPC (2005). Road database. Phnom Penh: Department of Geography, Ministry of Land Management, Urban Planning and Construction (MLMUPC).
Montgomery, S. C., Martin, R. J., Guppy, C., Wright, G. C., & Tighe, M. K. (2017). Farmer knowledge and perception of production constraints in Northwest Cambodia. Journal of Rural Studies, 56, 12–20.https://doi.org/10.1016/j.jrurstud.2017.09.003. MPWT, & JICA (2003). Cambodia Reconnaissance Survey Digital Data. Phnom Penh:
Ministry of Public Works and Transportation (MPWT) and Japan International Cooperation Agency (JICA).
NCDD. (2010). Commune Database Online. 2005-2010. Phnom Penh: National Committee for Sub-National Democratic Development. Retrieved fromhttp://db.ncdd.gov.kh/ cdbonline/home/index.castle.
NIS. (2009). Cambodian Demographic Census 2008. Phnom Penh: National Institute of Statistics (NIS).
PDAFF-BB (2016). Provincial agricultural statistics 2002–2016. Battambang: Provincial Department of Agriculture, Forestry and Fisheries in Battambang (PDAFF-BB). PDA-PL (2016). Provincial agricultural statistics 2002–2016. Pailin: rovincial Department of
Agriculture in Pailin (PDA-PL).
PDLMUPC (2014). Update of road database 2014. Battambang: Provincial Department of Land Management, Urban Planning and Construction (PDLMUPC).
PDP-BB (2015). Commune database 2011-2015. Battambang: Provincial Department of Planning in Batttambang (PDP-BB).
PDP-PL (2015). Commune database 2011-2015. Pailin: Provincial Department of Planning in Pailin (PDP-PL).
Pilgrim, J., Ngin, C., & Diepart, J.-C. (2012). Multiple migrations, displacements and land transfers at Ta Kream in Northwest Cambodia. In S. B. Hecht, S. Kandel, & A. Morales (Eds.). Migration, rural livelihoods and natural resource management (pp. 33–56). El Salvador: International Development Research Centre (IDRC) of Canada - Ford Foundation - Fundación PRISMA.
Riethmüller, R. (1988). Differentiation and dynamics of land-use systems in a mountain-valley environment: A case study of new colonization areas in the upper Mae Nam Pa Sak catchment area, Thailand. In W. Manshard, & W. Morgan (Eds.). Agricultural
expansion and pioneer settlements in the humid tropics (pp. 74–94). Tokyo: The United
Nations University.
Rodrigues, A. S. L., Ewers, R. M., Parry, L., Souza, C., Veríssimo, A., & Balmford, A. (2009). Boom-and-bust development patterns across the Amazon deforestation frontier. Science, 324, 1435–1437.https://doi.org/10.1126/science.1174002. Rouse, J. W.,J., Haas, R. H., Schell, J. A., & Deering, D. W. (1974). Monitoring vegetation
systems in the Great Plains with ERTS. Proceedings of the Third ERTS Symposium (pp. 309–317). NASA SP-351 I. Retrieved fromhttps://ntrs.nasa.gov/search.jsp?R= 19740022614.
Rowcroft, P. (2008). Frontiers of change: The reasons behind land-use change in the Mekong Basin. AMBIO: A Journal of the Human Environment, 37(3), 213–218 https:// doi.org/10.1579/0044-7447(2008)37[213:FOCTRB]2.0.CO;2.
Royal Government of Cambodia (1993). Royal Decree on the Protection of Natural Areas,
PRK/1Nov93. Phnom Penh, Cambodia.
Scholz, U. (1988). Types of Spontaneous Pioneer Settlement in Thailand. In W. Manshard, & W. Morgan (Eds.). Agricultural Expansion and Pioneer Settlements in the Humid Tropics (pp. 44–61). Tokyo: The United Nations University. Retrieved fromhttp:// www.unu.edu/unupress/unupbooks/80636e/80636E07.htm#Expansion. Schulz, R., & Huyssteen, S. van (1999). Cambodia Report of the Evaluation Mission on two
projects: Labour-based infrastructure rehabilitation and Labour-based rural infrastructure development component of the Cambodian area rehabilitation and regenerationPhnom
Penh: International Labour Organisation United Nations Development Programme. Sirisambhand, N. (1988). The forest colonization process: Case studies of two
commu-nities in North-East and South-East Thailand. In W. Manshard, & W. Morgan (Eds.).
Agricultural expansion and pioneer settlements in the humid tropics (pp. 62–73). Tokyo:
The United Nations University.
Slaats, J., & Lestrelin, G. (2009). Improving cropping systems by introducing conservation agriculture: Taking stock of the results and methodology of research-development in southern Sayaboury province, Lao PDR. Vientiane: Programme de Capitalisation en Appui à la Politique de Développement Rural (PCADR). Retrieved fromhttp://lad. nafri.org.la/fulltext/3041-0.pdf.
Sopheapa, U., Patanothaib, A., & Ayec, T. M. (2012). Unveiling constraints to cassava production in Cambodia: An analysis from farmers' yield variations. International Journal of Plant Production, 6(4), 409–428. Retrieved fromhttp://www.sid.ir/en/ VEWSSID/J_pdf/124220120403.pdf.
Stier, K. (1993). Log rolling: Thai forestry contracts help to fund Khmer Rouge. Far Eastern
Economic Review, 156, 15–16.
Touch, V., Martin, R. J., Scott, J. F., Cowie, A., & Liu, D. L. (2016). Climate change adaptation options in rainfed upland cropping systems in the wet tropics: A case study of smallholder farms in North-West Cambodia. Journal of Environmental Management, 182, 238–246.https://doi.org/10.1016/j.jenvman.2016.07.039. Touch, V., Martin, R. J., Scott, F., Cowie, A., & Liu, D. L. (2017). Climate change impacts
farms in North-west Cambodia. Environment, Development and Sustainability, 19(5), 1631–1647.https://doi.org/10.1007/s10668-016-9818-3.
Touk, K. (2004). Could Cambodia's farmers be rich? Lessons learned from the northwest former khmer rouge zones. Proceedings of the Seminar on Cambodia's Economy in the
Next Five Years: How WTO Accession Could Help Cambodia Accelerate Reforms and Strengthen the Economy (pp. 4). Phnom Penh: Economic Institute of Cambodia. Turner, B. L., & Meyer, W. B. (1994). Global land-use and land-cover change: An
over-view. In W. B. Meyer, & B. L. TurnerII (Eds.). Changes in land use and land cover: a
global perspective (pp. 3–10). Cambridge, New York, Melbourne: University of
Cambridge.
Wenjun, O., Maofen, L., Aye, T. M., & Srey, S. (2016). Current situation of cassava pro-duction, constraints and opportunities in Cambodia. Agriculture, Forestry and Fisheries, 5(3), 64–70.https://doi.org/10.11648/j.aff.20160503.16.
World Bank. (2015). Cambodian agriculture in transition: Opportunities and risks. Economic
and Sector Work, Report No. 96308-KHWashington DC: Agriculture Global Practice