Supernovae study: Context of the 4-m ILMT facility
Brajesh Kumar
1,2∗, S. B. Pandey
2, K. L. Pandey
1,
G. C. Anupama
1and J. Surdej
31 Indian Institute of Astrophysics, Koramangala, Bangalore 560 034, India
2 Aryabhatta Research Institute of Observational Sciences, Manora Peak,
Nainital 263 001, India
3 Institut d’Astrophysique et de G´eophysique, Universit´e de Li`ege,
All´ee du 6 Aoˆut 19, Bˆat B5C, 4000 Li`ege, Belgium
Abstract: The upcoming 4-m International Liquid Mirror Telescope (ILMT) facility will perform deep imaging (in single scan g0 ∼22 mag.) of a narrow strip of sky each clear night in the Time Delayed Integration mode. A cadence of one day observation will provide unique opportunities to discover different types of supernovae (SNe) along with many other types of variable sources. We present the approach to discover SNe with the ILMT and discuss the follow-up strategy in the context of other existing observational facilities. The advantages of the ILMT observations over the traditional glass mirror telescopes are also discussed.
1
Introduction
The International Liquid Mirror Telescope1(ILMT) will see its first light this year at the newly
devel-oped Devasthal observatory near Nainital (Uttarakhand, India). It is a 4-m diameter non-conventional telescope with a primary mirror consisting of a parabolic shaped rotating container, filled with liquid (mercury). A detailed description of the site advantages, ILMT components and science cases can be found in Surdej et al. (2006), Borra, Hickson and Surdej (2009) and Kumar (2014). In combination with the g0, r0 and i0filters, this facility is mainly dedicated to photometric and astrometric variability studies along with the detection of supernovae (SNe) as one of the major goals.
Supernova (SN) identification and classification (for a review of different types of SNe see Fil-ippenko 1997) require the monitoring of light curves and spectra as some of them show transitional features. For example, Type IIb SNe (Filippenko 1988) closely resemble Type II SNe (presence of hydrogen in the spectra) during the early phases, while at later epochs this feature disappears and they become more similar to Type Ib/c events (hydrogen absent). Therefore, for the proper understanding of these stellar explosions, it is essential to observe them near their peak brightness and also a follow up at later epochs. It is also very important to detect a SN at its early phase of explosion as some of the SNe are expected to emit a short burst of high energy (soft γ-ray, X-ray, see Nakar & Sari 2010)
∗brajesh.kumar@iiap.res.in, brajesharies@gmail.com
1More details about the project can be found at http://www.ilmt.ulg.ac.be
“First Belgo-Indian Network for Astronomy & astrophysics (BINA) workshop”, held in Nainital (India), 15-18 November 2016
radiation at the moment of the shock break-out. Thereafter, the cooling will bring the emission into the UV-optical range. This phase should last at most a few hours, typically less than a day. A dense cadence per field would thus allow to systematically detect the shock break-out cooling tail of such events. These early observations will be crucial to derive the progenitor radius with a good precision (see e.g. Bersten et al. 2013; Taddia et al. 2015).
In the process of detecting SNe, knowing their redshifts, identifying their types, there remain many other challenges (see, e.g. Dahlen & Goobar 2002; Blondin & Tonry 2007; Kim & Miquel 2007; Kunz et al. 2007; Wang 2007). There may be a significant level of contamination by other
stellar objects (see also Sect. 2.1.3), for example, Active Galactic Nuclei (AGN2). AGNs can be
extremely luminous and appear as point sources in imaging surveys. Additionally, they are situated in the center of their host galaxies and may undergo optical variability (e.g. Stalin et al. 2004). In a study of the local SN rate, Cappellaro et al. (2005) found a large number of AGNs situated in the center of their host galaxies. It is possible that they may be mis-identified as SNe in surveys without spectra and with short observation periods.
It is notable that the ILMT will work in a continuous data acquisition mode by looking only towards the zenith. Once a patch of sky has passed over its field of view, it cannot be observed again during the same night. Therefore, a collaborative observation will be helpful for the study of transients like SNe. Furthermore, the filter system of the ILMT is limited, it will not be sufficient enough to measure the colour, light curve information. Also, to examine the spectral features of transients, a spectrum will be required. Accordingly, large aperture size traditional mirror telescopes will be needed as complementary to the ILMT observations. Thanks to the ARIES observational facilities which presently host three optical telescopes namely the 1.04-m Sampurnanand Telescope (ST), the 1.3-m Devasthal Fast Optical Telescope (DFOT) and the 3.6-m Devasthal Optical Telescope (DOT). A guaranteed-time allocation strategy to follow-up newly discovered objects will fulfil our needs, specially in case of any SN discovery.
2
Supernovae study with the ILMT
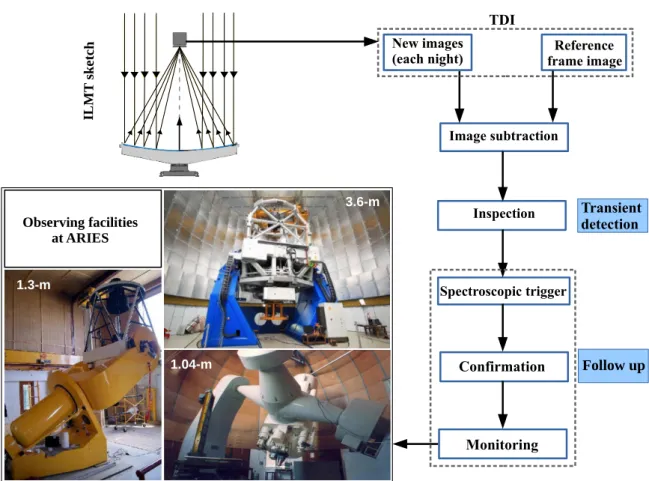
For a reliable and quick source detection in the ILMT images, an automated real time data reduction pipeline will be developed and applied. In this section we describe the SN detection approach and follow-up scheme. A proposed processing data flow is illustrated in Fig. 1.
2.1
SN detection approach
Typically there are two ways for transient detection: i.e. comparison with an exhaustive catalog of celestial objects and image subtraction (see also Schmidt 2012). The catalog method is good where very high precision is required, but it results in poor detection efficiency near the detection threshold, or in crowded regions. Using the image subtraction method, images are matched to a template and the template is subtracted. The latter method is more demanding computationally speaking and has poorer absolute precision, but leads to a much better transient detection efficiency across a survey.
2.1.1 TDI mode imaging
The ILMT will work in the Time Delayed Integration (TDI) mode (for details see Gibson & Hickson, 1992; Hickson & Richardson, 1998; Vangeyte et al., 2002, and references therein). There are several advantages to work in this mode. As the Earth rotates, the passing stars over the zenith can be imaged
New images
(each night) Reference frame image
Image subtraction Inspection Transient detection Spectroscopic trigger Confirmation Monitoring TDI 1.3m DFOT 3.6m DOT Follow up IL M T ske tc h Observing facilities at ARIES 3.6-m 1.3-m 1.04-m
Figure 1: Illustration of the proposed processing data flow for SNe detection and follow-up scheme. Upper left is a sketch of the ILMT and lower left, images of the existing observing facilities at ARIES, Manora peak and Devasthal observatories (1.04-m ST, 1.3-m DFOT and 3.6-m DOT). These tele-scopes will be used for photometric and/or spectroscopic follow-up observations of the ILMT detected SNe and other transient events.
continuously. At the end of the night a single long image of a narrow band sky strip is produced. Although a single integration time is imposed however, as the same strip of sky is observed night after night, these observations can be co-added to increase the limiting magnitude. Additionally, TDI imaging also provides an easy and robust way of data reduction. While in conventional imaging, the sensitivity irregularities of the CCD sensors are corrected by using a two dimensional flat, in TDI mode observations, as the objects go all across the detector along the sensor rows, the sensitivity irregularities are averaged over the detector columns. Consequently, the image reduction is done by dividing each column by a one-dimensional flat field. Furthermore, this flat field can be directly estimated from the scientific data (i.e. the background sky light), contrary to what is done during conventional imaging where flat field images must be taken before and/or after scientific imaging. In this way precious telescope time is saved.
2.1.2 Image subtraction
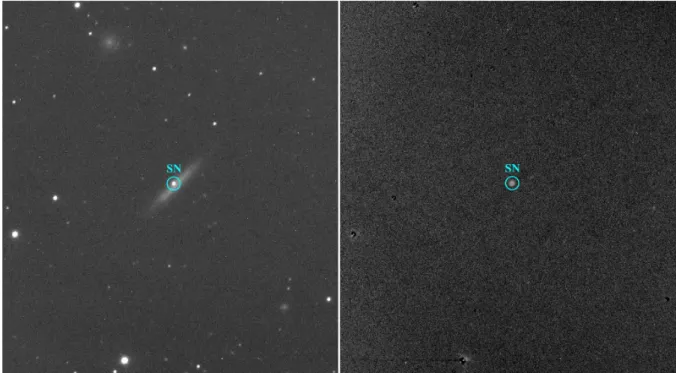
Discovering a SN is not an easy task as in most cases the SN light will be a small part of light measured from the galaxy. Furthermore, for high redshift galaxies, the galaxies themselves will not be fully resolved by ground based observations so a SN will be even less distinct and can be easily missed when looking in the individual search epoch images.
Figure 2: Image subtraction. Left panel: Galaxy IC 3311 image with SN 2004gk. The SN is deeply embedded inside the host galaxy. Right panel: Subtracted image where the SN is clearly visible without galaxy contamination.
observations will be performed under the best seeing conditions by looking at the zenith during each clear night. Then previous night images or a good reference image will be subtracted from the search night images using the Optimal Image Subtraction (OIS) technique presented in Alard & Lupton (1998) and further refined in Alard (ISIS, 2000). This method of image subtraction has already been used to detect SNe in many projects (e.g. Cappellaro et al. 2005; Wood-Vasey et al. 2007; Poznanski et al. 2007b; Botticella et al. 2008).
Fig. 2 demonstrates one example of the image subtraction technique where both images, with and without host galaxy can be seen.
2.1.3 Transient detection and possible contamination
The subtracted images may consist of astrophysical and non-astrophysical sources. However, in other transient surveys which use image subtraction techniques, it has been found that non-astrophysical sources always engulf the real sources (e.g. Bloom et al. 2012; Brink et al. 2013). Non-astrophysical sources include cosmic rays that are not removed by cosmic ray removal software, extended features around very bright saturated stars, and bad subtractions due to a mis-alignment of the images. To remove these false detections, we must exclude the sources around the bright, saturated stars and at the edges of the images.
Variable stars, quasars, active galaxies and moving objects also contaminate the data. We can cross-match the detected object catalog with quasar and AGN catalogs (V´eron-Cetty & V´eron 2010; Pˆaris et al. 2014). Variable stars can be checked from SIMBAD3. The proper motion of asteroids is
large so they will show significant variation in their position and can be removed easily. Furthermore, solar system objects can be checked from the Minor Planet Checker4.
3http://simbad.u-strasbg.fr/simbad/ 4
2.1.4 Detection of supernovae candidates
It should be highlighted that in general the classification of supernovae is done by inspecting the spec-tra and checking for the presence of emission lines. But supernovae, especially at high redshift, may be too faint for spectroscopy, even with the largest class telescopes currently available. In many cases the supernova spectrum is contaminated by the host galaxy light. Furthermore, with the increasing number of survey programs, follow-up spectroscopy will not be possible/practical for all transients detected in these surveys. At the same time unless we confirm that whether a particular event is a core collapse (CC) SN or Type Ia, the scientific usefulness will be affected.
Therefore, in response to this need, many techniques targeted at SNe photometric classification have been developed which are mostly based on some form of template fitting. These include the methods of Poznanski et al. (2002, 2007a); Johnson & Crotts (2006); Sullivan et al. (2006); Rodney & Tonry (2009); Falck et al. (2010); Gong et al. (2010). In each of these approaches, typically the light curves in different filters for the SN under consideration are compared with those from SNe whose types are well established. Usually, composite templates are constructed for each class, using the observed light curves of a number of well-studied, high signal-to-noise ratio SNe (see
Nu-gent et al. 2002). Some of these light curve fitting models are SALT5 (Guy et al. 2005, 2007),
MLCS/MLCS2k26 (Riess et al. 1995, 1996; Jha et al. 2007) and SiFTO (Conley et al. 2008). We
must keep in mind that the light curve fitting method is not very robust for typing determination and it is less accurate than the spectral method. Nonetheless, it is much easier to obtain photometry and construct light curves of faint SNe at high redshift in comparison to obtaining spectra (see Melinder 2011).
Colour information of SNe with the ILMT could be obtained as follows: each night a different filter (g0, r0 or i0) could be used. From the sequence of recorded observations, i.e., g0 (day 1), r0 (day 2), i0 (day 3), g0 (day 4), r0 (day 5), i0 (day 6), ... it should be possible to interpolate the observed magnitudes on a given date to properly estimate the colour of the SNe on that particular day. For instance the g0− r0 colour of the supernova on day 4 would be estimated as g0(day 4) – (r0(day 2) +
(r0(day 5) – r0(day 2))*2/3).
For the classification of SNe, Poznanski et al. (2002) presented a method using multicolour broad-band photometry. Their study is based upon the general assumption that SNe Ic are redder than SNe Ia at a similar redshift (Riess et al. 2001). They found that although rising (pre-maximum) SNe Ic have colours similar to those of older (∼2 weeks past maximum) SNe Ia but near the peak brightness, SNe Ia are typically 0.5 mag bluer in the r − i colour than SNe Ic. Dahlen & Goobar (2002) and John-son & Crotts (2006) also demonstrated similar type determination methods based on colour cuts and colour evolution. Bianco et al. 2014 suggested that the colour evolution trends may permit to identify various stripped-envelope SNe7. If the ILMT observations could be performed in the subsequent g0,
r0 and i0 filters each night, the colour information or template fitting technique could be very much useful to identify the supernova candidates for further follow-up.
2.2
SN Follow-up scheme
The light curves, the absolute luminosity and the colour evolution of SNe have provided major insights to understand their observational properties. Furthermore, the temporal evolution of SNe light curves constitutes one of the major sources of information about the nature of these events. Therefore, obtaining multi-band light curve observations is very important. Through light curves it has been
5Spectral adaptive light curve template 6Multicolour light-curve shape
7In these events, the outer envelopes of hydrogen and/or helium of their progenitors are partially or completely
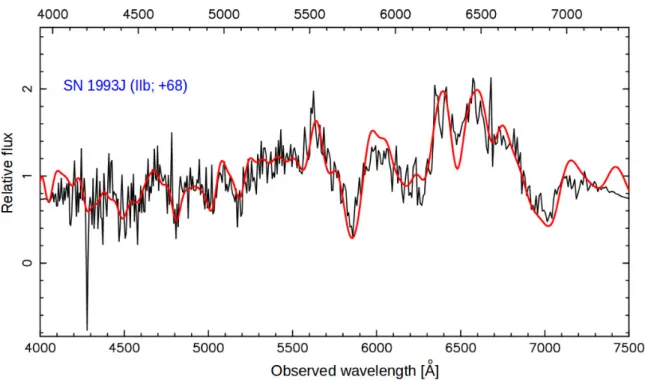
Figure 3: Demonstration of the spectra identification using the SNID code. The flux is in arbitrary units. The observed spectrum of SN 2011fu (Kumar et al. 2013) and template spectrum are, respec-tively shown with black and red colours. The best fitted template is SN 1993J (shown in the top left, blue characters with the estimated phase (+68) relative to the maximum light).
possible to distinguish between progenitor models, infer some aspects of the progenitor evolution, measure the power sources, detail the explosion models, and probe the local environment of the supernova explosions (see Leibundgut & Suntzeff 2003). The spectrum of a supernova contains a wealth of information about the composition and distribution of the elements in the exploding star. It also contains information on its redshift and age (defined as the number of days from maximum light in a given filter). It is very important to launch follow-up (photometric and spectroscopic) observations right after the discovery of any transient.
2.2.1 Spectroscopic trigger
Follow-up spectroscopy of a subset of events will be essential to calibrate the accuracy of the pho-tometric typing (and host redshifts). In particular, spectroscopy will be invaluable in identifying and quantifying catastrophic failures in the typing algorithms; on the basis of these it may be possible to refine the routines. As SNe are random events, i.e. there is no advance knowledge of their occurrence, it is not easy to obtain observing time in advance as in general the time allocation is given on the basis of research proposals written several months in advance. Over that successful proposals are granted only a few nights in a semester on large telescopes. Thanks to the 3.6-m DOT telescope situated near the ILMT site, it can be triggered in the target of opportunity observation mode in case of any detected SN transient. Additionally, we can collaborate with other existing facilities in India and world wide.
2.2.2 Confirmation
The individual emission/absorption lines in the SN spectra provide information about the progenitor system and the new elements created in the explosion. Since the classification of SNe is based on their optical spectra around maximum light (see Filippenko 1997), therefore, for a rapid confirmation we
can use available SN classification codes e.g. GELATO8 and/or SNID9. The SNID tool is developed
to determine the type, redshift, and age of a SN, using a single spectrum. In Fig. 3 we show a use of the SNID tool to estimate different parameters of SN 2011fu (Kumar et al. 2013). The algorithm is based on the correlation techniques of Tonry & Davis (1979) and relies on the comparison of an input spectrum with a database of high-S/N template spectra (for more details see Blondin & Tonry 2007). Furthermore, GELATO is an online software for objective classification of SN spectra. Similar to SNID, it performs an automatic comparison of a given (input) spectrum with a set of well-studied SN spectra (templates), in order to find the template spectrum that is most similar to the given one. The GELATO algorithm is presented in Harutyunyan et al. (2008).
2.2.3 Monitoring
Presently there are three optical telescopes existing at ARIES (cf. Fig. 1). The 1.04-m ST is situated at Manora peak which is equipped with a modern CCD detector. There are two additional telescopes situated at the Devasthal observatory (Sagar et al. 2012), the 1.3-m DFOT and 3.6-m DOT. Since there are multiple observation facilities available at ARIES, our plan is to quickly trigger them once a transient candidate is confirmed on the ILMT images. Up to the bright phase (∼17 mag.) of SN, photometric observations will be performed with different filters using small aperture telescopes (1.04-m and 1.3-m) and when it will become fainter, larger aperture (3.6-m DOT) telescope will be utilized. However, spectroscopic observations will be performed with the DOT and other larger telescopes in India and/or abroad.
3
Conclusions
The ILMT is a unique facility in the context of SNe studies. On each clear night, observation of the same sky strip (except for a 4 min. shift in right ascension) will be very effective to apply image sub-traction and discover new SNe. The ILMT will access ∼72 square degrees of high galactic latitude (|b| > 30◦) in a year. Considering single scan limiting magnitude of ∼22 mag (g0 filter) and several other factors (cf. site photometric nights, maintenance etc.), we estimated that it is possible to detect hundreds of SNe (both CC and Type Ia) up to moderate red-shifts (∼0.5z) every year with this tele-scope. However, careful removal of contaminating sources (e.g. cosmic rays, AGNs, variable stars, asteroids and minor planets) will be must for SN detection. A detail analysis can be found in Kumar et al. (2018). The SN identification and type determination can be confirmed by employing the light curve and/or spectral fitting methods. Once a SN is discovered, rapid monitoring can be performed for more detailed investigation. In this way, the ILMT imaging will provide an unbiased sample of different types of SNe which is an advantage over the targeted SN search programs that frequently scan different sky regions and possibly induce observational biases. Such a contribution will play a significant role to better understand SN physics and stellar evolution.
Acknowledgements
BK acknowledges the Science and Engineering Research Board (DST, Govt. of India) for financial assistance in the form of National Post-Doctoral Fellowship (Ref. no. PDF/2016/001563). JS thanks the Li`ege University, the F.R.S.-FNRS and the R´egion Wallonne (Belgium) for their constant financial support that has allowed the construction of the 4-m International Liquid Mirror Telescope (ILMT).
8GEneric cLAssification TOol https://gelato.tng.iac.es/
References
Alard C., 2000, A&AS, 144, 363
Alard C., Lupton R. H., 1998, ApJ, 503, 325
Bersten M. C., Tanaka M., Tominaga N., Benvenuto O. G., Nomoto K., 2013, ApJ, 767, 143 Bianco F. B., Modjaz M., Hicken M., et al. 2014, ApJS, 213, 19
Blondin S., Tonry J. L., 2007, ApJ, 666, 1024
Bloom J. S., Richards J. W., Nugent P. E., et al. 2012, PASP, 124, 1175 Borra E., Hickson P., Surdej, J., 2009, Optics and Photonics News, 20, 28 Botticella M. T., Riello M., Cappellaro E., et al. 2008, A&A, 479, 49 Brink H., Richards J. W., Poznanski D., et al., 2013, MNRAS, 435, 1047 Cappellaro E., Evans R., Turatto M., 1999, A&A, 351, 459
Cappellaro E., Riello M., Altavilla G., et al. 2005, A&A, 430, 83 Conley A., Sullivan M., Hsiao E. Y., et al. 2008, ApJ, 681, 482-498 Dahlen T., Goobar A., 2002, PASP, 114, 284
Falck B. L., Riess A. G., Hlozek R., 2010, ApJ, 723, 398 Filippenko A. V., 1988, AJ, 96, 1941
Filippenko A. V., 1997, ARA&A, 35, 309
Gibson B. K., Hickson P., 1992, MNRAS, 258, 543 147 Gong Y., Cooray A., Chen X., 2010, ApJ, 709, 1420
Guy J., Astier P., Nobili S., Regnault N., Pain R., 2005, A&A, 443, 781 Guy J., Astier P., Baumont S., et al. 2007, A&A, 466, 11
Harutyunyan A. H., et al., 2008, A&A, 488, 383 Hickson P., Richardson E. H., 1998, PASP, 110, 1081 Jha S., Riess A. G., Kirshner R. P., 2007, ApJ, 659, 122 Johnson B. D., Crotts A. P. S., 2006, AJ, 132, 756
Kim A. G., Miquel R., 2007, Astroparticle Physics, 28, 448
Kumar B., Pandey S. B., Sahu D. K., et al. 2013, MNRAS, 431, 308 Kumar B., 2014, in PhD Thesis, University of Li`ege (Belgium) Kumar B., et al. 2018, MNRAS, submitted
Kunz M., Bassett B. A., Hlozek R. A., 2007, PhRvD, 75, 103508
Leibundgut B., Suntzeff N. B. 2003, in Supernovae and Gamma-Ray Bursters, 598, 77 Melinder J., 2011, in PhD Thesis, Stockholm University (Sweden)
Nakar E., Sari R., 2010, ApJ, 725, 904
Nugent P., Kim A., Perlmutter S., 2002, PASP, 114, 803 Pˆaris I., Petitjean P., Aubourg ´E., et al. 2014, A&A, 563, A54
Poznanski D., Gal-Yam A., Maoz D., Filippenko A. V., Leonard D. C., Matheson T., 2002, PASP, 114, 833
Poznanski D., Maoz D., Gal-Yam A., 2007a, AJ, 134, 1285
Poznanski D., Maoz D., Yasuda N., et al. 2007, MNRAS, 382, 1169 Riess A. G., Press W. H., Kirshner R. P., 1995, ApJ, 438, L17 Riess A. G., Press W. H., Kirshner R. P., 1996, ApJ, 473, 88 Riess A. G., Nugent P. E., Gilliland R. L., et al. 2001, ApJ, 560, 49 Rodney S. A., Tonry J. L., 2009, ApJ, 707, 1064
Sagar R., Kumar B., Omar A., Joshi Y. C., 2012, ASI Conference Ser., 4, 173 Salpeter E. E., 1964, ApJ, 140, 796
Schmidt B. 2012, in New Horizons in Time Domain Astronomy, 285, 9 Shields G. A., 1978, Nature, 272, 706
Stalin C. S., Gopal Krishna Sagar R., Wiita P. J., 2004, JAA, 25, 1 Sullivan M., et al., 2006, AJ, 131, 960
Surdej J., Absil O., Bartczak P., et al., 2006, in SPIE Conference Series, vol. 6267 Taddia F., Sollerman J., Leloudas G., et al. 2015, A&A, 574, A60
Tonry J., Davis M., 1979, AJ, 84, 1511
Vangeyte B., Manfroid J., Surdej J., 2002, A&A, 388, 712 138, 147 V´eron-Cetty M.-P., V´eron P., 2010, A&A, 518, A10
Wang Y., 2007, ApJ, 654, L123