CHRISTELLE LEGAY
DEVELOPPEMENT DE STRATEGIES POUR
L'ÉVALUATION DE L'EXPOSITION DE LA
POPULATION AUX SOUS-PRODUITS DE LA
CHLORATION DANS L'EAU POTABLE
Thèse présentée
à la Faculté des études supérieures de l'Université Laval
dans le cadre du programme de doctorat en Aménagement du Territoire et de Développement Régional
pour l'obtention du grade de Philosophiae Doctor (Ph.D.)
ECOLE SUPERIEURE D'AMENAGEMENT DU TERRITOIRE ET DE DÉVELOPPEMENT RÉGIONAL
FACULTÉ D'AMÉNAGEMENT, D'ARCHITECTURE ET DES ARTS VISUELS UNIVERSITÉ LAVAL
QUÉBEC
2010
Résumé
Cette thèse est consacrée au développement de stratégies pour évaluer l'exposition de la population aux sous-produits de la chloration (SPC) dans l'eau potable. Afin de réaliser cette thèse, l'étude de cas est conduite dans les réseaux de distribution d'eau potable qui desservent la grande région de Québec (Province de Québec, Canada). Le premier chapitre constitue une analyse critique des approches appliquées pour estimer l'exposition de la population aux SPC dans l'eau potable dans les études épidémiologiques axées sur les problèmes de reproduction humaine. Cette analyse permet d'identifier les facteurs à considérer pour estimer l'exposition de la population, et plus particulièrement en intégrant la variabilité spatiale et temporelle de l'occurrence des SPC dans les réseaux de distribution. Le deuxième chapitre compare différentes méthodes pour assigner spatialement des données de SPC à la population afin d'estimer son exposition à ces contaminants. Le troisième chapitre intègre une analyse des risques pour la santé humaine (cancer et non-cancer) associés à l'exposition de la population aux SPC dans l'eau potable. Les caractéristiques des réseaux de distribution influant sur la variabilité spatiale de l'occurrence des SPC sont considérées dans l'analyse. Par conséquent, la distribution spatiale du risque pour la population dans chacun des réseaux de distribution à l'étude est obtenue. Dans le dernier chapitre, une modélisation statistique multi-niveaux est réalisée afin d'estimer l'exposition de la population aux SPC dans l'eau potable à l'échelle de la région à l'étude. Ces modèles font appel à des paramètres facilement disponibles et intègrent la variabilité spatiale mais aussi saisonnière de l'occurrence des SPC dans les réseaux de distribution d'eau potable.
Mots-clés: Eau potable, réseaux de distribution, sous-produits de la chloration, estimation de l'exposition, variabilité spatio-temporelle, problèmes de reproduction, estimation du risque pour la santé humaine, exposition multi-voies, simulations de Monte Carlo, modèles multi-niveaux.
Development of strategies to assess the population
exposure to chlorination by-products in drinking water
Abstract
This thesis focuses on the development of strategies for assessing a population's exposure to chlorination by-products (CBPs) in drinking water. The study is conducted on the drinking water distribution systems supplying the greater area of Québec City (Province of Québec, Canada). The first chapter is an exhaustive and critical analysis of the applied approaches to assessing the population's exposure to CBPs in drinking water for epidemiological studies focused on reproductive outcomes. This analysis leads to the identification of the factors to be considered when estimating the population's exposure, with particular attention paid to the spatial and temporal variability of CBP occurrence within distribution systems. The second chapter compares different methods for the spatial assignment of the CBP data to the population for exposure assessment purposes. The third chapter integrates a human health risk analysis (cancer and non-cancer) associated with a population's exposure to CBPs in drinking water. The characteristics of distribution systems influencing the spatial variability of CBP occurrence are considered in the analysis. As a result, the spatial distribution of human health risks in each distribution system is obtained. In the last chapter, a multi-level statistical modelling is carried out to estimate the population's exposure to CBPs in drinking water within the region under study. These models use parameters which are easily available and integrate the spatial and seasonal occurrence of CBPs in drinking water distribution systems.
Keywords: Drinking water, distribution systems, chlorination by-products, exposure assessment, spatio-temporal variability, adverse reproductive outcomes, human health risk assessment, multi-pathway exposure, Monte Carlo simulations, multi-level models.
Remerciements
La réalisation de cette thèse de doctorat fût une entreprise stimulante, différente des précédentes, mouvementée, exigeante, parfois longue et semée d'embûches. De nombreuses personnes m'ont accompagnée tout au long de ce projet... Je préfère ne pas opter pour de longs paragraphes superficiels pour vous remercier, mais plutôt pour la simplicité. Par conséquent, veuillez accepter juste un nom ou une phrase pour vous dire que ceci n'aurait jamais pu être réalisé sans vous...
Mon directeur, Manuel Rodriguez, pour son soutien intellectuel et personnel..., Mon co-directeur, Jean-Baptiste Sérodes, pour son expertise et sa gentillesse,
Aux membres de mon jury Robert Tardif, Boniface Koudjonou, Shakhawat Chowdhury qui ont permis l'amélioration de ce manuscrit,
Aux partenaires de la chaire de recherche en eau potable de l'Université Laval et organismes qui ont financé ces recherches,
Luis Miranda-Moreno et Rehan Sadiq qui m'ont permis de voir de nouveaux horizons, Patrick Levallois, Suzanne Gingras, Cyril Catto avec qui j'ai travaillé sur divers projets, Ibra et Babacar Seek pour leur aide précieuse,
François Proulx et sa famille...
Christine Beaulieu, Michel Bisping et les personnes du laboratoire d'environnement de l'Université Laval,
Sabrina Simard, Sylvie Leduc, Sonia Poulain, Annick Dion-Fortier, Anna Zattoni pour les travaux de terrain et de laboratoire,
Le personnel des villes et des usines de production d'eau potable de Québec et de Lévis qui m'ont aidé à réaliser les travaux de terrain et à mieux de connaître la région,
Les étudiants, le personnel et les professeurs du CRAD et de l'ÉSAD et plus particulièrement Francine, Lyne, Willem, François, Francis et Louis,
Les étudiants et les professionnels de recherche de la chaire de recherche en eau potable de l'Université Laval,
Moumou,
Mes amis de France dont Gaby, Stéphane, Natou, Marylou, Choupinou et Viviane Mes amis Marion et Poupinou pour m'avoir supporté,
Mon entourage : Annie, Anne, Allison, Cynthia, Fufu, Isabelle, Julie, Manon, Marie-Ève, Sonia, Sylvie, Virginie et William,
Les membres et proches de l'AFAGLEQ dont Christian, Gilles, Arméla, Séverine, Jacinthe, Maude et aux autres...
La famille Bouchard, Cat' d'être là,
Ma maman, ma sœur, même, mes tatas Josette et Annick, mes tontons Christian et Jean-Jacques pour leur amour et leur soutien...Je ne sais vraiment pas comment vous remercier!!!
Mon papa qui est tout le temps dans mon cœur et ma tata Jacqueline qui ne m'aura malheureusement pas vu finir.
Tous ceux qui ont fait un jour partie de ma vie de PhD candidate... Tous ceux que j'ai oubliés...
Avant-Propos
Cette thèse est composée de quatre chapitres; chacun d'entre eux est issu d'un article publié ou soumis à des revues scientifiques avec comité de lecture. Ces revues étant de langue anglaise, les articles, et par conséquent les chapitres de cette thèse, ont été rédigés en anglais. Le premier chapitre a déjà été publié dans une revue scientifique. Les trois autres chapitres ont été soumis pour publication. L'ordre de la présentation suit le développement chronologique des travaux effectués durant cette thèse.
Bien que ces quatre chapitres réunis représentent l'ensemble des recherches de cette thèse, l'organisation de ce manuscrit offre la possibilité aux lecteurs de s'intéresser à un chapitre spécifique sans être obligé de lire le manuscrit en entier. Afin de permettre ceci, certaines redondances ont été introduites délibérément dans plusieurs paragraphes des quatre chapitres.
Les liens entre les différents chapitres sont expliqués par de brefs paragraphes au début des chapitres 2, 3 et 4. Ce manuscrit contient également le résumé de la thèse, en français et anglais, ainsi que pour chacun des chapitres. L'introduction générale, les chapitres ainsi que la conclusion générale sont suivis d'une bibliographie (c.-à-d., références). Diverses annexes ont été insérées dans cette thèse afin de présenter des informations supplémentaires relatives aux travaux de recherches effectués qui n'étaient pas incluses dans les quatre articles.
Pour chacun de ces articles, le premier auteur est l'auteur de la thèse et le deuxième est le directeur de recherche. Le co-directeur de recherche est le troisième auteur des articles 1 et 2 ainsi que le quatrième auteur des articles 3 et 4. Les trois autres auteurs sont des chercheurs qui ont contribué à l'exécution des recherches menées dans les articles spécifiés. Les titres et références de chaque article constituant cette thèse sont présentés ci-dessous.
CHAPITRE 1
Estimation of chlorination by-products presence in drinking water in epidemiological studies on adverse reproductive outcomes: A review
Christelle Legay, Manuel J. Rodriguez, Jean B. Sérodes, Patrick Levallois
Journal Science of the Total Environment, 2010, Volume 408, Issue 3, pp. 456-472
CHAPITRE 2
Comparison of methods to assign chlorination by-product levels in drinking water for population exposure assessment purposes
Christelle Legay, Manuel J. Rodriguez, Jean B. Sérodes, Patrick Levallois Soumis au Journal Environmental Health en Janvier 2010
CHAPITRE 3
Spatial variations of human health risk associated with exposure to chlorination by-products occurring in drinking water
Christelle Legay, Manuel J. Rodriguez, Rehan Sadiq, Jean B. Sérodes, Patrick Levallois, François Proulx
Soumis au Journal of Environmental Management en Janvier 2010
CHAPITRE 4
Multi-level modelling of chlorination by-product presence in drinking water distribution systems for human exposure assessment purposes
Christelle Legay, Manuel J. Rodriguez, Luis Miranda-Moreno, Jean B. Sérodes, Patrick Levallois
Table des matières
Résumé i Abstract ii Remerciements iii
Avant-Propos v Table des matières vii Liste des tableaux x Liste des figures xi
Introduction générale 1 Bibliographie de l'introduction générale 7
CHAPITRE 1 Estimation of chlorination by-products presence in drinking water in
epidemiological studies on adverse reproductive outcomes: A review 9
1.1 Introduction 10 1.2 Methodology 12 1.3 Assessment of CBP occurrence in drinking water in epidemiological studies. 17
1.3.1 Nature of the data used to assess CBP presence in drinking water 17
1.3.1.1 Type of CBP compounds under study 17
1.3.1.2 Data sources 24 1.3.1.3 Range of studied CBP levels in drinking water 25
1.3.2 Methods used to estimate CBP presence in drinking water 26 1.3.2.1 Estimation of CBP occurrence in drinking water based on indirect
measurements 26 1.3.2.2 Estimation of CBP occurrence in drinking water based on direct
measurements 33 1.3.2.2.1 Spatial aspects in the estimation of CBP levels in drinking water.. 33
1.3.2.2.2 Temporal aspects in the estimation of CBP levels in drinking water 34 1.4 Assignment of CBP presence to a subject's tap water in epidemiological studies
36
1.4.1 Determination of a subject's water supply 37 1.4.2 Assignment of CBP levels according to the subject's residence 37
1.4.3 Assignment of CBP levels according to the exposure period 38 1.4.4 Categorization of CBP presence in a subject's drinking water for exposure
assessment purposes 39 1.5 Discussion and conclusion 39
1.6 References 46 CHAPITRE 2 Comparison of methods to assign chlorination by-product levels in
drinking water for population exposure assessment purposes 52
2.1 Introduction 54 2.2 Materials and method 56
2.2.1 Case under study 56 2.2.2 Description of data 60
2.2.2.1 Population under study 60 2.2.2.2 CBP data collection 61
2.2.3 Assessment of CBP levels in the subject's tap water 62
2.2.3.1 Methods applied at the sub-system scale 62 2.2.3.2 Methods applied at the distribution system-scale 65
2.2.4 Data analysis 65 2.3 Results and discussion 66
2.3.1 CBP occurrence in the area under study 66 2.3.2 Comparison of methods used to spatially assign CBP data to the subjects 75
2.3.2.1 Comparison of methods considering the entire area under study 75 2.3.2.2 Comparison of methods for each individual distribution system 79
2.4 Conclusion 84 2.5 References 87 CHAPITRE 3 Spatial variations of human health risk associated with exposure to
chlorination by-products occurring in drinking water 89
3.1 Introduction 91 3.2 Methodology 93 3.2.1 Case study 93 3.2.2 CBP data collection 95 3.2.3 Exposure assessment 96 3.2.4 Risk/hazard characterization 100 3.2.5 Uncertainty analysis 101 3.3 Results and discussion 102
3.3.1 CBP occurrence in drinking water 102 3.3.2 Human health risk assessment 107
3.3.2.1 Cancer risk 107 3.3.2.1.1 Cancer risk assessment with chloroform: Scenario 1.... 107
3.3.2.1.2 Cancer risk assessment without chloroform: Scenario 2 111
3.3.2.2 Non-cancer risk 113
3.3.3 Risk management 116
3.4 Conclusion 118 3.5 References 119 CHAPITRE 4 Multi-level modelling of chlorination by-product presence in
drinking water distribution systems for human exposure assessment purposes.... 123
4.1 Introduction 125 4.2 Methodology 126
4.2.1 Study cases 126 4.2.2 Sampling strategy 129
4.2.2.1 Database for development models (Database 1) 129 4.2.2.2 Database for validation models (Database 2) 129 4.2.2.3 Sampling procedure '. 129
4.2.3 Analytical procedure 130 4.3 CBP portrait in the study area 131
4.3.1 Seasonal variations of CBP occurrence 131 4.3.2 Variability of CBP presence between DS 135 4.3.3 Variability of CBP presence intra-DS 136
4.3.3.1 Surface water DS 136 4.3.3.2 Mixed water DS 138
4.3.3.3 Ground water DS 139 4.4 Modelling of TTHM and HAA5 occurrence within DS for exposure assessment
139
4.4.1 Previous modelling of CBP within DS 139
4.4.2 Model development 140 4.4.3 Model results 143
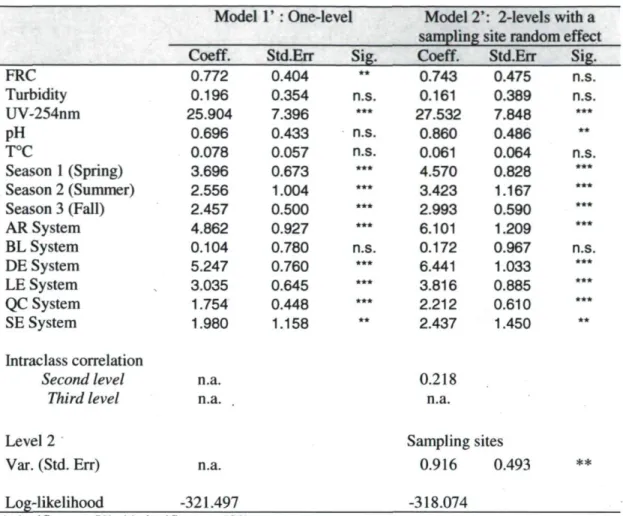
4.4.3.1 Models for TTHM occurrence in DS 143 4.4.3.2 Models for HAA5 presence in DS 147
4.4.4 Validation of models 149 4.4.4.1 Models for TTHM presence in DS 149
4.4.4.2 Models for HAA5 presence in DS 150
4.5 Conclusion '. 152
4.6 References 153 Conclusion générale et recommandations 156
Bibliographie de la conclusion générale 163
ANNEXES 164 ANNEXE A 165 ANNEXE B 167 ANNEXE C 170 ANNEXED 172 ANNEXEE 174 ANNEXE F 176 ANNEXE G 177
Liste des tableaux
Table 1.1. General description of previous epidemiological studies focusing on adverse
reproductive outcomes 14 Table 1.2. Nature of data used to assess CBP presence in drinking water distribution
systems in epidemiological studies 20 Table 1.3. Methods applied to estimate and to assign CBP presence to a subject's tap
water in epidemiological studies 28 Table 1.4. Advantages and limits of methods applied to estimate CBP presence in a
subject's tap water for exposure assessment in epidemiological studies 42 Table 2.1. Characteristics of the nine distribution systems under study 59 Table 2.2. Description of methods applied to assess CBP levels at the subject's tap water
64
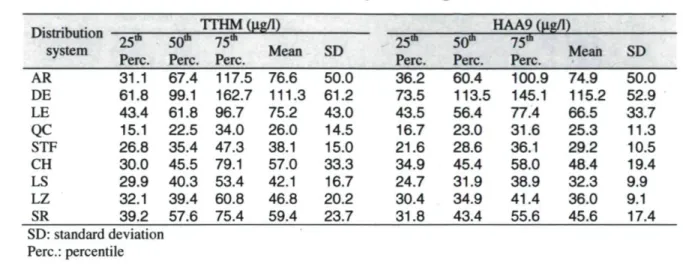
Table 2.3. CBP levels measured in each distribution system during 2006-2008 67 Table 2.4. CBP levels measured in each sub-system of the distribution systems of Québec
City during 2006-2008 71 Table 2.5. CBP levels measured in each sub-system of the distribution systems of the city
of Levis during 2006-2008 72 Table 2.6. Recommendations to spatially assign the available CBP data to the subjects in
epidemiological studies 86 Table 3.1. Toxicity values (SF and RfD) of each studied CBP compounds 92
Table 3.2. Characteristics of the zones under study 95 Table 3.3. Input parameters in exposure assessment of the population to CBPs in drinking
water 99 Table 3.4. Average CBP levels in zones of Québec City distribution systems (jxg/1).... 105
Table 3.5. Average CBP levels in zones of the city of Levis distribution systems (jxg/1) 106
Table 4.1. Characteristics of the eight DS under study 128 Table 4.2. Physico-chemical characteristics of distributed water for each DS during
2005-2006 (annual averages) 136 Table 4.3. Results of single-level and multi-level multivariate regression models to
estimate categories of TTHM presence 145 Table 4.4. Results of single-level and multi-level multivariate regression models to
Liste des figures
Figure 2.1. Location of the nine distribution systems under study (north shore: Québec
City; south shore: City of Levis) 57 Figures 2.2. Monthly TTHM levels measured in distribution systems during 2007-2008
(a) Québec City; (b) City of Levis (monthly levels based on average of all sampling sites
in each system) 68 Figures 2.3. Monthly HAA9 levels measured in distribution systems during 2007-2008
(a) Québec City; (b) City of Levis (monthly levels based on average of all sampling sites
in each system). 69 Figures 2.4. Quarterly average of TTHM levels measured in the nine distribution systems
under study during 2007: (a) 1st trimester; (b) 2nd trimester; (c) 3rd trimester; (d) 4th
trimester 73 Figures 2.5. Quarterly average of HAA9 levels measured in the nine distribution systems
under study during 2007: (a) 1st trimester; (b) 2nd trimester; (c) 3rd trimester; (d) 4th
trimester 74 Figures 2.6. Distribution of all subjects of the area under study in the CBP exposure
categories obtained from each assignment method: (a) TTHM; (b) HAA9 78 Figures 2.7. Distribution of the subjects of each distribution system in the TTHM
exposure categories obtained from each assignment method 80 Figure 2.8 Distribution of the subjects of each distribution system in the HAA9 exposure
categories obtained from each assignment method 81 Figure 3.1. Spatial sub-division into zones in the water distribution systems under study
94 Figures 3.2. Maps of probabilistic carcinogenic risk assessment considering chloroform (Scenario 1) in the cities of Québec and Levis (a) 5th percentile RT-C; (b) median RT-C;
(C) 95th percentile RT-C 110
Figures 3.3. Maps of probabilistic carcinogenic risk assessment without considering chloroform (Scenario 2) in the cities of Québec and Levis (a) 5th percentile Rj-NC; (b)
median RT-NC; (c) 95th percentile RT-NC 112
Figures 3.4. Maps of probabilistic non-carcinogenic hazard assessment in the cities of Québec and Levis (a) 5th percentile HIj; (b) median HIj; (c) 95th percentile HIj 115
Figures 4.1. Mean CBP levels measured in each DS supplied by surface water (a) TTHM;
(b)HAA5 133 Figures 4.2. Mean CBP levels measured in each DS supplied by mixed and ground water
(a) TTHM; (b) HAA5 134 Figures 4.3. Example of spatial variations of CBP occurrence within QC system (a)
TTHM;(b)HAA5 138 Figure 4.4. Hierarchical structure of data relative to CBP presence within DS 141
Figure 4.5. Comparison of field data and estimated probabilities of a measurement being
in one of the five categories of TTHM presence 150 Figure 4.6. Comparison of field data and estimated probabilities of a measurement being
Introduction générale
La désinfection constitue une étape essentielle du traitement de l'eau potable afin de préserver la santé publique. En 1884, le chlore fut le premier désinfectant chimique utilisé pour le traitement de l'eau potable. Son efficacité dans l'inactivation et la destruction de microorganismes a permis une réduction importante des maladies d'origine hydrique (Richardson, 1998). De nos jours, la chloration constitue encore la technique de désinfection la plus utilisée.
En 1974, J.J. Rook a démontré que l'interaction entre le chlore et la matière organique (MO) naturellement présente dans l'eau entraîne la formation de produits organochlorés appelés communément les sous-produits de la chloration (SPC) (Rook, 1974). Principalement sous la forme d'hypochlorite de sodium, la chloration engendre donc la formation de SPC, ce qui peut être illustrée de la façon suivante (Singer, 1994):
HOCl + M O ^ S P C
Dans la famille des SPC, les trihalométhanes (THM) constituent le groupe chimique le plus présent dans l'eau potable et ont fait l'objet de nombreuses études (Boorman et al., 1999). Les quatre principaux composés constituant ce groupe sont le chloroforme, le bromodichlorométhane (BDCM), le dibromochlorométhane (DBCM) et le bromoforme (Singer, 1994). Dans cette thèse, la somme de ces quatre composés représente les trihalométhanes totaux (TTHM), laquelle n'inclut donc pas les autres composés de ce groupe tels que les THM iodés. Les acides haloacétiques (AHA) peuvent être présents à une concentration non négligeable dans l'eau distribuée et constituent ainsi le deuxième groupe des SPC. Parmi eux, on retrouve principalement les acides monochloroacétique (MCAA), dichloroacétique (DCAA), trichloroacétique (TCAA), monobromoacétique (MBAA) et dibromoacétique (DBAA) (Singer, 1994). Les haloacétonitriles, les halocétones, les chlorophénols, la chloropicrine, l'hydrate de chloral, le chlorure de cyanogène, les N-organochloramines et le 3-Chloro-4-(dichlorométhyl)-5-hydroxy-2(5H)-furanone (MX) sont également des SPC, mais ne sont généralement présents qu'à
l'état de trace dans l'eau potable (concentrations inférieures à 1 ug/1 selon les composés) (Nieuwenhuijsen et al., 2000).
La formation, la spéciation, la distribution et le niveau des SPC retrouvés dans l'eau potable dépendent de divers facteurs :
• Caractéristiques de l'eau brute : nature et concentration du matériel précurseur organique, concentration en ions bromures et, par conséquent, du type de source (eau de surface ou eau souterraine) (Singer, 1994; Bove et al., 2002; Liang and Singer, 2003).
• Paramètres opérationnels : type et efficacité du traitement (primaire et secondaire), pH et température de l'eau traitée (Singer, 1994; Rodriguez and Sérodes, 2001; Bove et al., 2002; Liang and Singer, 2003; Rodriguez et al., 2004). La technique de chloration utilisée, la dose et le point d'application du chlore jouent également un rôle important sur l'occurrence des SPC. Par exemple, l'utilisation du chlore combiné engendre une formation minime de sous-produits additionnels durant la distribution à l'inverse du chlore libre (Singer, 1994; Adams et al., 2005; Crittenden et al., 2005; Speight and Singer, 2005).
• Caractéristiques des systèmes de distribution : nature et taille des canalisations, présence de biofilms, conditions hydrauliques, taille et maintenance du réseau, présence de réservoirs de stockage ou de stations de rechloration, concentration et temps de contact du désinfectant résiduel avec les précurseurs de formation des SPC (Aschengrau et al., 1993; Singer, 1994; Liang and Singer, 2003; Rodriguez et al., 2004; Baribeau et al., 2005; Speight and Singer, 2005).
Vers la fin des années 1970, l'effet cancérigène potentiel du chloroforme a été mis en évidence (NCI, 1976). Ainsi de nombreuses recherches toxicologiques (c.-à-d., études animales) et épidémiologiques (c.-à-d., études humaines) ont été réalisées afin d'étudier la relation entre les SPC et les problèmes de santé humaine (Boorman et al., 1999; Tardiff et al., 2006; Richardson et al., 2007). Les études épidémiologiques ont tout d'abord été axées sur le risque de développement de cancers (vessie, colon et autres) (Villanueva et al., 2003; Hrudey, 2009). Plus récemment, les chercheurs se sont intéressés aux effets à court terme des SPC sur la santé humaine, tels que les problèmes de reproduction
(mort-nés, faible poids du nourrisson à la naissance, avortements spontanés) (Aschengrau et al., 1993; Bove et al., 1995; Dodds et al., 2004; Nieuwenhuijsen, 2005; Lewis et al., 2007). L'un des principaux défis de ces études humaines est d'évaluer de façon adéquate l'exposition de la population étudiée aux SPC dans l'eau potable et plus particulièrement, de déterminer les niveaux de ces substances au robinet durant la période d'exposition étudiée (ex., quelques mois pour les problèmes de reproduction, plusieurs dizaines d'années pour les cancers) (Nieuwenhuijsen et al., 2000). En effet, les conditions opérationnelles et les caractéristiques de l'eau qui interviennent dans la présence des SPC varient dans le temps (variations saisonnières, annuelles, etc.) et dans l'espace (variations entre les régions, inter-réseaux et intra-réseaux de distribution municipaux) (Arbuckle et al., 2002; Rodriguez et al., 2003; Rodriguez et al., 2004; Symanski et al., 2004). En conséquence, ces variations spatio-temporelles additionnées à la variabilité des processus qui conditionnent la formation des divers SPC (cinétique de formation et de dégradation, conditions hydrauliques, etc.) engendrent de nombreuses difficultés dans l'étude de leur occurrence dans un réseau de distribution d'eau potable.
L'obtention de données suffisantes pour représenter les variations spatiales et temporelles de l'occurrence des SPC dans les réseaux de distribution d'eau potable génère de nombreuses difficultés (coût, temps, etc.). Des données non représentatives du niveau réel de SPC dans l'eau potable risquent donc d'être utilisées pour estimer l'exposition de la population. Par conséquent, des erreurs et imprécisions dans la mesure de l'exposition aux SPC des sujets participant à des études épidémiologiques peuvent engendrer un biais dans les conclusions des dites études. En général, l'estimation des niveaux de SPC dans l'eau potable au robinet du consommateur est plus précise dans les études d'exposition à court terme (ex., période de grossesse pour les problèmes de reproduction) en comparaison aux études à long terme (ex., de nombreuses années ou toute une vie pour les cancers). En effet, l'obtention de données précises est plus aisée sur une période de quelques mois que sur une période de dizaines d'années (Savitz et al., 2005). En général, dans les études d'exposition à court terme, une précision plus importante dans l'estimation de l'exposition de la population étudiée est requise.
Actuellement, les effets sur la santé humaine des SPC présents dans l'eau potable constituent encore un important sujet de débat en santé publique. L'amélioration de la précision et de l'efficacité dans l'estimation des niveaux de SPC dans l'eau potable, au robinet, s'impose. Par conséquent, le principal objectif de cette thèse est de développer des stratégies pour évaluer l'exposition de la population aux sous-produits de la chloration dans l'eau potable. Un intérêt plus particulier est porté aux variations spatiales et temporelles de l'occurrence des SPC dans les réseaux de distribution d'eau potable. D est important de noter, que le terme « exposition » dans cette thèse fait uniquement référence aux niveaux de SPC dans l'eau potable. Par conséquent, les notions de doses externe (quantité de SPC qui est en contact avec l'être humain par les multiples voies d'exposition) et interne (quantité de SPC qui a pénétré dans l'organisme) ne sont pas intégrées. Étant donné que les THM et les AHA sont les composés les plus présents dans l'eau potable et les plus documentés, cette thèse est principalement consacrée à l'étude de ces deux groupes de SPC.
Cet objectif principal est réalisé par l'entremise des objectifs spécifiques suivants:
1. Identifier les facteurs qui influencent la précision de l'estimation des niveaux de SPC dans l'eau potable au robinet du consommateur (axée sur les dimensions spatiale et temporelle).
2. Développer une base de données spatio-temporelle robuste concernant les deux principaux groupes de SPC (c.-à-d., les THM et les AHA) en réseau de distribution. 3. Améliorer les connaissances sur les variations spatio-temporelles des THM et des
AHA dans les réseaux de distribution.
4. Développer des stratégies pour assigner les données de SPC à la population afin d'estimer leur exposition en considérant les variations spatiales de ces composés dans les réseaux de distribution d'eau potable.
5. Estimer la variabilité spatio-temporelle du risque pour la population, associé à la présence de SPC dans l'eau potable
6. Développer des modèles pour estimer l'exposition de la population aux THM et aux AHA.
L'étude de cas est conduite dans la grande région de Québec (Province de Québec, Canada), en particulier dans les territoires des villes de Québec (la rive nord) et de Lévis (la rive sud). Quinze réseaux qui distribuent l'eau potable dans cette région (eau ayant subi au moins une chloration, en désinfection ou post-désinfection) sont considérés (Annexe A). Parmi ceux-ci, neuf réseaux alimentés par de l'eau de surface (dont cinq réseaux desservant la ville de Québec et quatre la ville de Lévis) constituent les principaux lieux d'étude. Les six autres réseaux (trois réseaux pour chacune des deux villes) alimentés par de l'èau souterraine font également partie de l'étude, mais de manière moins importante. Deux bases de données relatives à l'occurrence des THM et AHA dans la région à l'étude sont utilisées dans cette thèse. La première base de données a été générée pendant cette thèse en 2006-2008 (Annexe B). La seconde est issue d'un projet réalisé dans le cadre des activités de la Chaire de Recherche en Eau Potable de l'Université Laval (2005-2006).
Comme indiqué précédemment, cette thèse est composée de quatre chapitres correspondant à un article publié et trois soumis à des revues scientifiques avec comité de lecture. Le premier chapitre présente une revue et critique des méthodes appliquées pour estimer l'exposition de la population aux SPC dans l'eau potable. Les méthodes étudiées sont celles qui ont été utilisées dans les études épidémiologiques axées sur les SPC et les problèmes de reproduction. Elles intègrent divers aspects tels que la nature des données utilisées ainsi que les approches appliquées pour estimer la présence des SPC dans les réseaux de distribution d'eau potable et l'assigner aux sujets. Pour chaque étude, ces aspects sont identifiés et comparés avec un intérêt plus particulier pour les dimensions spatiale et temporelle de l'occurrence des SPC dans les réseaux de distribution d'eau potable.
Dans le deuxième chapitre, différentes méthodes utilisées pour assigner les niveaux de SPC mesurés dans les réseaux de distribution d'eau potable à la population dans les études épidémiologiques sont comparées. La variabilité spatiale des SPC dans les réseaux de distribution est considérée différemment dans chacune de ces méthodes. Les résultats de ce chapitre sont utiles au processus d'assignation des données disponibles aux sujets
participant à des études épidémiologiques. Par conséquent, une meilleure estimation de l'exposition aux SPC de la population étudiée pourrait être obtenue.
Le troisième chapitre intègre une analyse des risques pour la santé humaine (cancer et autres problèmes de santé) associés à l'exposition des SPC dans l'eau potable dans la région à l'étude. L'objectif de ce chapitre est d'étudier la variabilité spatiale du risque lié à l'exposition des THM et des AHA. Dans ce but, la variabilité spatiale de l'occurrence des SPC inter et intra-réseaux de distribution est intégrée à l'analyse. De ces résultats, des recommandations pour améliorer l'évaluation du risque pour la santé humaine sont émises.
Le dernier chapitre traite de la modélisation de l'exposition de la population aux SPC dans l'eau potable. Jamais utilisée dans le domaine des SPC, une approche statistique multi-niveaux est appliquée pour estimer la présence des THM et AHA dans l'eau potable et plus particulièrement à des fins de mesure d'exposition. Les facteurs pouvant influencer la variabilité temporelle et surtout spatiale de l'exposition de la population aux SPC dans les réseaux de distribution d'eau potable sont intégrés.
Bibliographie de l'introduction générale
Adams, C , Timmons T., Seitz T., Lane J., Levotch S. Trihalomethane and haloacetic acid disinfection by-products in full-scale drinking water systems. Journal of Environmental Engineering, 2005; 131(4): 526-534.
Arbuckle, T.E., Hrudey S.E., Krasner S.W., Nuckols J.R., Richardson S.D., Singer P., Mendola P., Dodds L., Weisel C , Ashley D.L., Froese K.L., Pegram R.A., Schultz LR., Reif J., Bachand A.M., Benoit F.M., Lynberg M., Poole C , Waller K. Assessing exposure in epidemiologic studies to disinfection by-products in drinking water: Report from an international workshop. Environmental Health Perspectives, 2002; 110: 53-60.
Aschengrau, A., Zierler S., Cohen A. Quality of Community Drinking-Water and the Occurrence of Late Adverse Pregnancy Outcomes. Archives of Environmental Health, 1993; 48(2): 105-113.
Baribeau, H., Krasner S.W., Chinn R., Singer P.C. Impact of biomass on the stability of HAAs and THMs in a simulated distribution system. Journal American Water Works Association, 2005; 97(2): 69-81.
Boorman, G.A., Dellarco V., Dunnick J.K., Chapin R.E., Hunter S., Hauchman F., Gardner H., Cox M., Sills R.C. Drinking water disinfection byproducts: Review and approach to toxicity evaluation. Environmental Health Perspectives, 1999;
107: 207-217.
Bove, F.J., Fulcomer M.C., Klotz J.B., Esmart J., Dufficy E.M., Savrin J.E. Public Drinking-Water Contamination and Birth Outcomes. American Journal of Epidemiology, 1995; 141(9): 850-862.
Bove, F.J., Shim Y., Zeitz P. Drinking water contaminants and adverse pregnancy outcomes: A review. Environmental Health Perspectives, 2002; 110: 61-1 A.
Crittenden, J., Tchobanoglous G., Hand D.W., Trussell R.R., Howe K.J., Harza M.W. Water treatment principles and design. Second edition. Hoboken, N.J.: John Wiley & Sons, Inc., 2005.
Dodds, L., King W., Allen A.C., Armson B.A., Fell D.B., Nimrod C. Trihalométhanes in public water supplies and risk of stillbirth. Epidemiology, 2004; 15(2): 179-186. Hrudey, S.E. Chlorination disinfection by-products, public health risk tradeoffs and me.
Water Research, 2009; 43(8): 2057-2092.
Lewis, C , Suffet I.H., Hoggatt K., Ritz B. Estimated effects of disinfection by-products on preterm birth in a population served by a single water utility. Environmental Health Perspectives, 2007; 115(2): 290-295.
Liang, L., Singer P.C. Factors influencing the formation and relative distribution of haloacetic acids and trihalométhanes in drinking water. Environmental Science & Technology, 2003; 37(13): 2920-2928.
National Cancer Institute (NCI). Report on Carcinogenesis Bioassay of Chloroform, National Cancer Institute (NCI), National Institutes of Health, Bethesda, MD, USA. (NIH) 76-1279, 60pp, 1976.
Nieuwenhuijsen, M.J., Toledano M.B., Eaton N.E., Fawell J., Elliott P. Chlorination disinfection byproducts in water and their association with adverse reproductive outcomes: a review. Occupational and Environmental Medicine, 2000; 57(2): 73-85.
Nieuwenhuijsen, M.J. Adverse reproductive health effects of exposure to chlorination disinfection by products. Global Nest Journal, 2005; 7(1): 128-144.
Richardson, S.D. Drinking water disinfection by-products. In R.A. Meyers (ed), The Encyclopedia of Environmental Analysis & Remediation, Vol. 3, New York, NY: John Wiley & Sons, 1998; 1398-1421.
Richardson, S.D., Plewa M.J., Wagner E.D., Schoeny R., DeMarini D.M. Occurence, genotoxicity, and carcinogenicity of regulated and emerging disinfection by-products in drinking water: A review and roadmap for research. Mutation Research, 2007; 636: 178-242.
Rodriguez, M.J., Serodes J.B. Spatial and temporal evolution of trihalométhanes in three water distribution systems. Water Research, 2001; 35(6): 1572-1586.
Rodriguez, M.J., Vinette Y., Serodes J.B., Bouchard C. Trihalométhanes in drinking water of greater Quebec region (Canada): Occurrence, variations and modelling. Environmental Monitoring and Assessment, 2003; 89(1): 69-93.
Rodriguez, M.J., Serodes J.B., Levallois P. Behavior of trihalométhanes and haloacetic acids in a drinking water distribution system. Water Research, 2004; 38(20): 4367-4382.
Rook, J.J. Formation of haloforms during chlorination of natural waters. Water Treatment and Examination, 1974; 23(2): 234-243.
Savitz, D.A., Singer P.C., Hartmann K.E., Herring A.H., Weinberg H.S., Makarushka C , Hoffman C , Chan R., Maclehose R. Drinking water disinfection by-products and pregnancy outcome. Denver, CO: American Water Works Association Research Foundation; 2005.
Singer, P.C. Control of Disinfection by-Products in Drinking-Water. Journal of Environmental Engineering, 1994; 120(4): 727-744.
Speight, V.L., Singer P.C. Association between residual chlorine loss and HAA reduction in distribution systems. Journal American Water Works Association, 2005; 97(2): 82-91.
Symanski, E., Savitz D.A., Singer P.C. Assessing spatial fluctuations, temporal variability, and measurement error in estimated levels of disinfection by-products in tap water: implications for exposure assessment. Occupational and Environmental Medicine, 2004; 61(1): 65-72.
Tardiff, R.G., Carson M.L., Ginevan M.E. Updated weight of evidence for an association between adverse reproductive and developmental effects and exposure to disinfection by-products. Regulatory Toxicology and Pharmacology, 2006; 45(2):
185-205.
Villanueva, CM., Fernandez F., Malats N., Grimait J.O., Kogevinas M. Meta-analysis of studies on individual consumption of chlorinated drinking water and bladder cancer. Journal of Epidemiology and Community Health, 2003; 57(3): 166-173.
CHAPITRE 1
Estimation of chlorination by-products presence in
drinking water in epidemiological studies on adverse
reproductive outcomes: A review
Abstract. Chlorination of drinking water is essential to prevent waterborne disease. However, chlorine reacts with organic matter present in water to form various by-products. In the last decade, several epidemiological studies have been conducted to determine the connection between exposure to these chlorination by-products (CBPs) and human health defects, such as adverse reproductive outcomes. However, the methods used to assess exposure of pregnant women in these studies had serious limitations, particularly in relation to determining CBP presence in the subject's tap water. The purpose of this paper is to critically review the methods used to evaluate the CBP presence in a subject's tap water for exposure assessment purposes in epidemiological studies focused on adverse reproductive outcomes and CBPs in drinking water. Interest is directed more precisely at space-time features related to CBPs for an optimal estimation of their presence in a subject's tap water.
Keywords: Drinking water, chlorination by-products, adverse reproductive outcomes, exposure assessment, spatio-temporal variations, distribution system.
R é s u m é . La chloration de l'eau potable constitue une étape essentielle dans la prévention des maladies d'origine hydrique. Cependant, le chlore réagit avec la matière organique présente naturellement dans l'eau pour former différents sous-produits. Dans les dernières décennies, de nombreuses études épidémiologiques ont été réalisées afin de déterminer la relation entre l'exposition à ces sous-produits de la chloration (SPC) et les problèmes de santé humaine tels que les problèmes de reproduction. Néanmoins, les méthodes utilisées dans ces études pour estimer l'exposition des femmes enceintes possèdent de nombreuses limitations, et plus particulièrement dans l'estimation des niveaux de SPC dans l'eau potable à la résidence des consommateurs. Cet article consiste
en la revue critique des méthodes utilisées pour estimer la présence des SPC dans l'eau potable à la résidence des sujets dans un contexte d'évaluation de l'exposition dans les études épidémiologiques axées sur l'exposition des SPC dans l'eau potable et les problèmes de reproduction. Un intérêt plus particulier est porté à la variabilité spatiale et temporelle de l'occurrence des SPC dans l'eau potable.
Mots-clés: Eau potable, sous-produits de la chloration, problèmes de reproduction, estimation de l'exposition, variations spatio-temporelles, réseaux de distribution.
1.1 Introduction
Disinfection is a major process in the treatment of drinking water. It is essential to prevent waterborne disease. However, chlorine and other disinfectants react with natural organic matter (NOM) and/or inorganic substances occurring in water to form various disinfection by-products (DBPs) such as trihalométhanes (THMs), haloacetic acids (HAAs) and other compounds (Rook, 1974; Singer, 1994; Richardson et al., 2007). At the end of the 70's, toxicological studies emphasized the potential carcinogenic effect of chloroform (THM species) (NCI, 1976). Since then, various toxicological and epidemiological studies have been carried out to determine the links between some chlorinated DBPs (CBPs) and health outcomes. More recently, epidemiologists have focused on reproductive outcomes such as stillbirth, spontaneous abortion and intra-uterine growth retardation (IUGR) (Reif et al., 1996; Nieuwenhuijsen et al., 2000a; Graves et al., 2001; Nieuwenhuijsen, 2005; Tardiff et al., 2006).
In epidemiological studies on adverse reproductive outcomes, several aspects need to be considered to characterize a subject's exposure to CBPs in drinking water. Knowledge of various fields such as chemistry, environmental engineering, toxicology, biostatics, epidemiology and modelling are required (Arbuckle et al., 2002). Generally speaking, the assessment of individual total exposure to CBPs in drinking water is carried out in three stages:
• Evaluation of CBP presence in the tap water used by the subject (in this case; pregnant women) during the period of interest (Swan and Waller, 1998).
• Determination of the contribution of each exposure route such as ingestion, inhalation and dermal absorption by evaluating personal water use behaviour (e.g., tap water consumption, duration and type of water use). This serves to estimate the external dose of CBPs (Weisel et al., 1999; Nieuwenhuijsen et al., 2000b).
• Estimation of the internal dose of CBPs. This stage is based on physiologically-based tools such as pharmacokinetic models (Nieuwenhuijsen et al., 2000a; Lévesque et al., 2002; Haddad et al., 2006).
This paper is focused on methodologies used to evaluate the CBP presence in tap water for the subject's exposure assessment (i.e., the first stage). The assessment of exposure to CBPs during pregnancy involves consideration of shorter periods of time than cancer-related studies (i.e., pregnancy period versus numbers of years or decades). As a result, CBP presence in tap water must also be estimated in a more accurate way to represent the short-term exposure of pregnant women. The precision and the validity of such assessment greatly depend on the quality of available data.
The representativeness of estimated CBP presence in the subject's tap water depends on the accuracy of results from this first stage. However, the estimation of CBP presence in the tap water of pregnant women still currently constitutes a major weakness in exposure assessment of epidemiological surveys on adverse reproductive outcomes and CBPs (Reif et al., 1996; Nieuwenhuijsen et al., 2000a; Bove et al., 2002; King et al., 2004). An important limitation is the methodology used to determine the occurrence of these compounds in water distribution systems and ascribing to them the presence of CBP in the subject's tap water (Bove et al., 2002). In fact, the formation, speciation and concentration of CBPs in drinking water vary according to several factors related to the characteristics of the water source, operational parameters during treatment and the specificities of the distribution system (Rodriguez et al., 2004a). Consequently, the occurrence of CBPs in water can vary spatially (from system to system and within each system) and temporally (Arbuckle et al., 2002; Rodriguez et al., 2004a). Generally
speaking, it is difficult and expensive to obtain sufficient data representing these spatio-temporal variations.
Various reviews focus on epidemiological studies of CBPs in drinking water and adverse reproductive outcomes (Reif et al., 1996; Nieuwenhuijsen et al., 2000b; Graves et al., 2001; Bove et al., 2002; Nieuwenhuijsen, 2005; Tardiff et al., 2006). However, scant attention has been paid to the methodology used to establish the CBP presence in drinking water to which pregnant women are exposed, except in some cases (Nieuwenhuijsen et al., 2000a; Nieuwenhuijsen et al., 2000b; Arbuckle et al., 2002).
The objective of this paper is to discuss the factors that affect the accuracy of estimation of CBP presence in a subject's tap water in epidemiological studies linking adverse reproductive outcomes to CBPs in drinking water. This analysis is based on a critical review of methodologies used to estimate CBP presence in a subject's tap water in published epidemiological studies.
1.2 Methodology
In this article, methodologies applied to estimate and to attribute the CBP presence in a subject's tap water used in epidemiological studies on reproductive outcomes and CBPs are studied.
In this aim, we initially identify and review the principal epidemiological studies conducted on the relation between the CBPs in drinking water and adverse reproductive outcomes. These studies are presented in Table 1.1. Studies reviewed differ according to the reproduction outcome under consideration (e.g., stillbirth, preterm delivery, low birth weight), regional scale used (e.g., regions, towns, specific networks), study period and length, the characteristics of the drinking water systems under study (e.g., number and size of studied systems, type of water supply sources and water disinfection methods).
The methodology used to assess CBP presence in drinking water also differed from one epidemiological study to another, depending primarily on the availability of CBP data. In
this paper, a detailed analysis of the origin, nature and quality of the data used in these studies to assess CBP occurrence in drinking water distribution systems is conducted. Thus, the importance of various parameters to be considered to obtain the most accurate estimation of CBP presence in distribution systems is outlined.
Moreover, this review focused on strategies used to assign CBP presence in drinking water to subjects (i.e., to obtain CBP presence in a subject's tap water), and more particularly to the approach used to integrate spatial and temporal variations of CBPs. Also, the review examines the advantages and limitations of various approaches applied to adequately consider the spatio-temporal variations when establishing CBP levels at a subject's tap water (i.e., estimation and assignment of CBP presence).
The paper concludes by identifying potential improvements that might be applied in future research to improve the estimation of CBP presence in a subject's drinking water in epidemiological studies focused on reproductive outcomes.
£ > 1 s s o o •= ■ a ï- °-S 3 O 3 O 11 > 'S u 3 ■a o u a. V E > T! es e o M S 3 es u Et s a 3 O C S a u L. a a = ô c ? Ë £ S E
!si
o g © c > ^ o a> o o S 5 5 £ >r «ï «J o £ = 5 S ô « 5 '5 2 5 5 > ï fe _ L: O I Î T S 73 73 C C C CO 3 3 — o o œ o i o> — o Ô S? m C/ï » -o © v co2t $ 5 e en ai 9 w en ï o 73 en ï o w 73 = CD C CD S o o * î z § , ï 3 Q . " a . ° » 9 — © y .41 S I S to S « 2 5 o ï j ~ Z « 2 « J 2 « œ E Q. Œ) 2 Q. E n « a T J J ! • • 2; n o 3 $ zu
s c ï o s S v i j a o i « E (71 t o o * S © * S © Q . (D C C _ t / ) E S I CD 5 town s s e D m p a nie s 1 Brve d b y a ■s. CD > Q . OH
11
N OW ^ m Q. ■= o E ©si
en 73 ï 73 7 ; 3 eniï
w g. 2 >■ « <D a » toi°i
£ a. 2 © © ~ O) c ?IIP
i w d O ? S J3 k f= i i f i s S." Q 2 7 3 5 - E C 3 CMTJ i» a •C S 73 3 n 3 cn 3 cn1
Ë ow § M 21 3 1
O) © . _ . 1 1 ^ o ±r (D « § E ^ E œ en Q m 2 » co o ï 3 1 8 :<J §I!
C\J O ■" O) to . c ir 09 CO > 3 Osis
S co •o t~ ifl O) tD y ■c * CD to = Oïco 2 3 « Q < SS2 « ; e ë c o o 21st s
■° != ~* s to CD o CD O CJ) © t F » « © © * " to 2* H c l i -=r ©- C *EZ 3 CD © O . m o o c n < > O 3 ro CO 5 Z> c ■ o co z ID a E = o 3 O f, 3 S s i 0 S £• CD J : > > . Ç 7 3I*
l
i •g 5 © 5 © . O ) i a . £ ■ © S î a 2 c ro * .2 E j E j 2 co c co c © « a i8*
0 © © ^ ' œ U O ) î S 3 © î £ Ç i l S o 73 O) 11 .© coII
o co 5 S ■ « o co . O) c o ' » œ s c? ro c o E Ï o to i l <» >; ï 3 t o o œ S c > > ,8. i l
en 0 . 0 io _ 1 s * 73 © © . 2 ? S I g g c © E •c to o O B) O o | 2 o r S s s © © CO r . 5 t° a.
S? E Tf O r^ o S ïs
© 73 CD © ©s
© c co 0 0 CD © © 3 3 ro co 0 en en 5 î 3 © © 0 o> O) O ï a i en en a © J 3 % S » Ln © © b CD k Q E T © CD ' C CD LO en cn V) © CI © . ^ en > ^ > 3 CD ^ > > > ^i i
© C CD O CD C CD a . CD "5 TJ c © 73 I ï Q co Q co 0 : Q ~3 3 CD' m Q 0 CD Q cô =) >. ©i
ro O co >. 7 3 ro 0 £ 0 CD > ro c © 3 re È ro 0 "rô 0 ro © 0 O O z o z z o « C Ô 2 E if -• 2 ï » » c * g Se e 3 2 frII
<X> ( D ^ 9 o B p jk
. 1
5 pi e sa m ai l pi e sa m ai l 3 0 » O > 3-gl e o r rr he cas e lurces . t is use d 5 gle o r rr he cas e lurces . t is use di
3 ! erve d b y a si n urces . Bu t in t b y multipl e s c o n metho d W E to O 73 r i to 2-1 i tf) © 1 2 &■£ CJ 1 2 &■£ 3 o ço g-.to o K 3 0) 73 tf) 3 E T3 3 © 85II
to -3 ™ S 4 2 & O ! CJ! CJ!■ J
CJ! O CJ! C . c:Is
ço © — O o Z tf) © 3iii
& 73.1 s § s 2 2 2 •Ç O) 3 co o S © tf) 3 C C3! co' S re icie s wer e dominant , h e 2" " area , minate d sp i dominant . CO S © icie s wer e dominant , h e 2" " area , minate d sp i dominant . 1 co £ icie s wer e dominant , h e 2" " area , minate d sp i dominant . 1 co ç S. £ 2 £ to 5 . 2 ^ o. S u ; CD S ^ 8 5 i i? o © CM 3 Ë 73 73 © © © CO ôiî
1 1
© ■ 2 2 . g | Sfg 2 3 | 3 | 9 cn a. c» o 2 cj> © to ÇJ © 73 2 3 « o 3 3 7 5 . t 2 E S !=co co 2 • — 3 i o c © 2 .2 3 . 2 2 >• 3 3 .^ I - Q. a 7 3 = £ CD 2 © o = to o o ro ? c © •c © & 3 © S JS 3i i
m >fs
Q co O) O) O) ro 9 i CJ! 1 o> ,_ » TJ- m 7K Ç U) > . 1 £ S 5> © 2 * J » 2J ^ tfï CD CD o E (À ECO CD U) Ë °Ë s » — ^ . p ° -5 .2 o > s c ■_ ' 5 î oficl « o © o ^ » r j S J3 Ici:! H O 73 © O r l O œ 5 | S $ to . © © .^..£3 ■ c C c © CO S > 3 © — c © i M BIS
O CD 5D S£ CD ^ ,«If
fill
P Œ £ > 3 S ®IIII
i l
se o .2 O CL J3 3 a 7 3 © £ tf) ^ co a. © Q. ■ Q Q 73 E LT) a) o ID C . .9 ca ca "câ ! » © CJ) l C co S CO 3 3 o £• © > C3) O £ 1 *+ <D = S « « a ÇD E CD £L H
H s!
— 5 73 © © S c > 73 * © Ëli il
S cj) c?? 5 . o 1? "g to tf) 1? "g to ? CO o 2 | O © * 5 *- (0 g i 3 =■II
. © 2 73 . © U r -2 ro © © © 5 © to 73 £ © > . ■o c? 2 ë c 2 (Oi l
15 a. (O 3 2 — to < £ 73 © 2 § re co 2 => re 3 .2 -O S -P re n § §ri
= cail
CD CO jr I « 2 — c o O ro 2 co S to cz co ta Z LU O £ L T ,ii
u 3 Ss
i
O z CO ^ c 2ill
Ë E ço O co 73 o 2 ô et Ë 2 ! Q © © CO £ 5 © Q. U) Q. l ! CD CDfi
(fl ï "S <D t n LO C 5 o21
co © "S <D t n LO C 5 o Q tf) O CD "S <D t n LO C 5 o 73 — 3 3 . £ 2 tfï CD T 3 C "S <D t n LO C 5 o un serv e h subje c panies) . Cl Û. en s « N • O T to >. c c O CO ô) 2 © E ~ o 73 c S O k © CM & 3 © i § M 77fi
© co ■o 3 © i § M 77fi
© co 3 3 © i § M 77fi
© co en 3 © i § M 77fi
© co > co 2 cj) Q i 73 E Q O CDII
Q co TT (—1 G co CD CDII
o o S . E CO 73 >. > ° 7 3l
-£ ro S ") to © t o ' E . 2 o .ÎI
CC o SI . c 5 = œ ' olit
© S « . 2 Q . O g cj) .E © 2 "g ©E 8 © 5 . 2 © m P co » i , S C J «I S Ë ~ © © c © © r . c o « c Q — g © — m S o Q . 2 U 0 m O H © 7 3 CO _ E Ë 7 3 O © S2.È . o a 2 O) c œ toil
^ o C\J o « en CD co « E > 3 CD = en cj CD 3 0 Q < Q F CD tn CD tn V, t-o D ■O.T3 sC CO 3 > - C o m c CJ CO V ) N 2 . =5 < 3 o © CJ) £-re co « =) CJ) E 73 c ^ T3 © O © o £• ro C CO CM 5 _> 5 =) re en 2 ro U .c oeo Z 3 © © T S S S 2 S • 9 3 rao.E c= œ c m ^ J8 | S § Ef
C J > : O) oII
" . S £• © © o . © > d ) © ro © © 73 ro t? © F 0 > m (I ifi n a CJ) O cr s C CD > co © ™ CM1.3 Assessment of CBP occurrence in drinking water in
epidemiological studies
The nature of data and the methodology applied to estimate CBP occurrence in drinking water distribution systems differ according to epidemiological studies on reproductive Outcomes.
1.3.1 Nature of the data used to assess CBP presence in drinking water
To assess CBP presence in drinking water distribution systems, previous epidemiological studies on adverse reproductive outcomes have been based on various kinds of CBP data. Table 1.2 summarizes the characteristics of data used in the studies, including compounds under consideration, data source, frequency of data collected and CBP levels measured (in cases where data were available).
1.3.1.1 Type of CBP compounds under study
More than 500 DBPs in drinking water have been detected and divided into several groups of compounds (Richardson, 1998; Richardson et al., 2000): halogenated organic by-products (e.g., THMs, HAAs), inorganic by-products (e.g., chlorate, chlorite, bromate and iodate ions, ammonia) and organic oxidation by-products (e.g., aldehydes, carboxylic acids, assimilable organic carbon). Several DBPs result from chlorine disinfection (i.e., CBPs) such as THMs, HAAs, haloacetonitriles (HANs) and other halonitriles (i.e., cyanogen chloride), haloketones (HKs), halophenols (i.e., 2-chlorophenol, 2,4-dichlorophenol, 2,4,6-trichlorophenol), halonitromethanes (i.e., chloropicrin), haloaldehydes (i.e., chloral hydrate) and MX (3-chloro-4-(dichloromethyl)-5-hydroxy-2(5H)-furanone) (US.EPA, 1999; Richardson et al., 2000). These compounds are formed under different conditions of pH and temperature, nature and amount of NOM and/or inorganic substances in raw and treated water, contact time between water and the disinfecting agent and biological degradation for some compounds (Singer, 1994; Chen and Weisel, 1998; Williams et al., 1998; Rodriguez and Serodes, 2001; Liang and Singer, 2003; Baribeau et al., 2005). This variability of conditions related to the formation of
these CBPs in drinking water makes it difficult to study their occurrence in drinking water distribution systems (Rodriguez et al., 2004a).
THMs and HAAs are the most prevalent and most documented CBP classes in drinking water, and thus the most considered in epidemiological studies on reproductive outcomes (Column 2 of Table 1.2). THMs include chloroform, bromodichloromethane (BDCM), dibromochloromethane (DBCM) and bromoform (Singer, 1994). The sum of these four individual THMs is referred to as total trihalométhanes1 (TTHMs). HAAs include nine
substances (the sum represents HAA9) of which the most common are monochloroacetic (MCAA), dichloroacetic (DCAA), trichloroacetic (TCAA), monobromoacetic (MBAA) and dibromoacetic (DBAA) acids. HAA5 is obtained by the sum of these five individual HAAs (Singer, 1994). Other CBPs generally occur at low levels in drinking water and are rarely considered in epidemiological studies (Nieuwenhuijsen et al., 2000a).
Difficulties (e.g., field or analytical costs and time) related to the measurement of all these by-products in drinking water favours the eventual use of a surrogate for CBP exposure (Column 2 of Table 1.2). Thus, some researchers have based the subject's exposure assessment on TTHM levels as markers of CBPs (Bove et al., 1995; Savitz et al., 1995; Dodds et al., 1999; Cedergren et al., 2002; Wright et al., 2003). However, several studies have indicated that TTHMs are not always correlated with individual THMs, in particular brominated compounds (King et al., 2000; Toledano et al., 2005; Nieuwenhuijsen et al., 2008). Since some brominated compounds could be more detrimental than other CBPs (from a toxicological point of view), they should be considered separately (WHO, 2005). Consequently, some studies have considered the levels of individual THMs (Kramer et al., 1992; Swan and Waller, 1998; Waller et al.,
1998; King et al., 2000; Shaw et al., 2003; Infante-Rivard, 2004). The relevance of using THMs as markers for other CBPs such as HAAs was also questioned (King et al., 2004; Toledano et al., 2005; Hinckley et al., 2005b; Nieuwenhuijsen et al., 2008). Some research uses the measurement of total organic halides (TOX), which is the sum of all
1 Iodo-THMs and other unregulated THMs (e.g., dichlorométhane, bromochloromethane, dibromomethane) are not considered in TTHMs.
2 monochloroacetic (MCAA), dichloroacetic (DCAA), trichloroacetic (TCAA), monobromoacetic (MBAA) and dibromoacetic (DBAA), tribromoacetic (TBAA), bromochloroacetic (BCAA), dibromochloroacetic (DBCAA), bromodichloroacetic (BDCAA) acids.
organo-halogenated DBPs, as a surrogate for CBP exposure (Kramer et al., 1992; Savitz et al., 2006). TOX levels have been correlated with CBP compounds such as THMs (Kramer et al., 1992). However, TOX have no toxicological meaning and do not allow differentiation of the presence of chlorinated and brominated compounds. As a result, an evaluation of the independent influence of specific CBPs on reproductive outcomes is not feasible (Wright et al., 2003; Savitz et al., 2005). Given the complexity of various mixtures of by-products resulting from chlorinated water, it would be relevant to study and identify the effects of these chemical compounds separately (i.e., THMs, HAAs, HANs, HKs and other CBP classes) (Swan and Waller, 1998; Jaakkola et al., 2001). In this way, compounds other than THMs, including HAAs, HANs and MX have been measured to improve the evaluation of CBP presence in drinking water (Klotz and Pyrch,
1999; Lynberg et al., 2001; Wright et al., 2004; King et al., 2005; Porter et al., 2005; Hinckley et al., 2005a; Savitz et al., 2006).
a. S j j « § Q . m a. m U "S >. o c s S 7? O (A Q . m u ■o • ■o
I
LO s S m £ C ■ * o 1 ' X 6 a £ ui g 0) CO!l
c » s « m c f o § o . CD O CD O T r^ d 5 » . çg 5 <D . m cn Q O) TTH I elati v e 1. 3 7 3 CL TT H elati v e 1. 3 6 CM Ô «■£ C Q CJ ° «s L O T C CO rang e egori e 4of T O Z rang e egori e 4of T C O C\J 7 3 CD ° S | A. ° E O Œ C C7> Q TJ E 9 • a S » = CO CO 7 3 Mc S ° 5 ô Mc « O 3 Ô tf) Q Sil*
j Rc 7 3 X _ CD U O Z CO o 2 n mean , m e esenc e o f e h presente e ri mean , m e esenc e o f e h presente d CO CD 5 2 tion o butp r rwhi c a tion o but p r rwhi c CO CO . CD CO CO C D 7 3 Q m O 5 T infor m Dlishe d apwa t 73 0 CD O O . C * c !2 O. — o CO 2 X o z t i i i 2 Oi l l
t o z z S co n: 7 3 73 o_ Q . m CD U O o O z a. CL m m o o u o £ S cb 5 5 5 o 5 2 2ils
P c j C O o Ô O ) co .£ c | | [/) 7 3 * S £ 7 3* I
S v) O ë r ÇO 0) o a CO 2 c ilit
2 g ra t _ S CD CO tf) 5 > . » CD s< S ? S 2 § § c ? CO CO B > . ^ CD U ' O O COîiï
L i l J ) r CD CO : § c Çjh è i
I î
fill
CD 7 3 CM E C tf) tf) 2 = 5 ™ '" " S° H £ « x « 2 « 7 3 Ô>« a CD c £ o S i °> E co S e " C « 7 3 £ P < enR
• CD I < CD S ~ < CO 7 3 . g 7 3 n i g S CD Q ° - ^ CD £ ■ § ■ § c o 3 3 O U tf) tf)s?
ï x * h O £ CL CD CJ 5 I 5 x £ Zï
Q . CQ U O 5 I 5 X 5 I 5 w m 0 0 m CQ u U o O z z 5 Is 1 a. S ç § S Q. 03 O S 73 Q. a u Ô 03 5» CD a CJ c • Q . 5 Cl ? CO k Ô l i . z. a. o U 73 1 x i —, ■ "O CD T3 3 O LO CD m CD co csj C CO c CO c * ~ co c 1 1 © 73 S 5 5 5 » 1 CM ï 5 œ CO çç CD GO i n lO ~ c 73 0 CQ m 73 0 . CD ç C\j O) C CO C re an 12 . a n 2. 4 Medi a O O o o CD > CD _ ) 1 1 œ œ Q Z z CD > CD _ ) 5 5 5 5 Z CL CQ CJ CL CD CJ tf) .. I l O CD tf) C CL 5 CQ * O co
i
£ U) CO CD CD r .? I
5 o t c g ) i nI
5 o t "S LOI
5 o t — CD CM ° to" m — CD c ° c 00 CM — CD CO ° c 00 CM 2 ! co t : 1 2 to x x CO CD CO C0 S i 5 Q 5 5 5 tf" en Q 1 85 c ri O CM CJ CO O C re ra re CD Q 2 , n CM o <n ■ * co CO Q co c\i d fflûûû . C O CO CO S V eo" co" ^ J CM O CO »■ V c\i d c c c c (0 <0 (D C0 CD CD CD CD 5 5 5 5 0 0 CQ CQ CJ U i E o o P O co Q mîi
Ç3) toII
7T> <D _ Q T s CD co 2 73 JS Q. CD CQ > CJ C0 5 x •2? S? CJ) 73 0 ) 7 3 Q . E ô . " E ,=? 2 7 3 C0 3 î î ) Q . . C C0 O — C0 * CD S w m 5 Si. ° >. S fe * CD CD >il
5 <D t 3 <o <D (O s § . Ô E ! o i m J .E *" co ' o. o ÇD » E , r co » 2«fi
C CD _ c tf> § 3 CD _| il
i!i
w c _ £• o aïill
m
y) Q . * 73 E | C0 ï Q. S o . co o co o — co — co . CD CD S 7 3 CO CD ï 7 3 C I S 2 S 1 tf) 3 . O CD ° tf) O J CD E S" y) _ CO * r: cas co1*11
CA c _ „ S S S E co co E £ co u) $ o cô S? 8 s o> fi TS E .2 _ S c S i 7= œ g o co >? i |
i j E tf) £ ^ D j - o C CD ° 7 S C ë S I CD ts 9 > E a S 5 ^ 2 tf) 0) — 4 = i o ° « co g co 7 3 E CD co g co 7 3 E CD S > ? E § 8 = '■= Tï ° JD 2 2 73 <D Li_ W Q CD CL CO CQ 5 5 «> O o CD CDli
z CO K X CD CD C O C0 5 x CD CD CO 5 x P 5 x 5 x 5 I CB _ _ •I
Q . m u Ô >• u c s ? F P s CO 7 0 o CD • i . 3 0 Cl) co m a. m o TJ CO LO co co Cp Q LO h » O ï CO Cp Q LO h » O ï CO CC CO S x CO CM x CC CO S CO X X 03 o'co" S 1^ oï c C tS 19 C . E E . o'co" S 1^ oï c co eo o'co" S 1^ oï c C O ^ ^ C M CM CM ^ TJ r m 7, Q Q s O Û Û Û C0COQ co co co coCO* LO*C0 d OÏ 10" d
CO CM . eo T^ ~~ CM c e " * * " c c: c c co ai c re re re re Q "B J t > T î ^ T 3 CD CD "O E E | Q} (D O (D CD CD "O E E | E E E E
CM'O" . V 0>" co" co"
CO co cô •r CO LO ^ CO co cô CO * » CM c c c C C C C (0 CO CO CB CQ CQ CO CD CD CD CD CD CD CD 5 5 5 5 5 5 5 LL. U T i CD CD 17) ra C CD >-£ 5 CD cr> CD
s
en tf) CM O _ O CO I 1 ^ CO I Q 5 CQ CQ (O CO Q 5 5 5 : f ^ T j ^ L o a i ^ ^ 0 0 5 o i i s CO * ^ ^ CM « ? c o ^ * ^ » c c c c c c c c c c recocorerecorccorerere J co C D C D C D C D C D C j ï C D C D r D C D C D m <D 5 5 5 5 5 5 5 5 5 5 5 > S CD ' c?8 > O ) M . CO 2 c o> S. 13 c o © co 5 5 C T 5 2 5 I O Ç J I S QSSSf
f o g x 5 x S X 1 Q t- mil I
CQ C COil!
1
lïïî
= * o •£ I & 7 3 c E 2 o o 73 E 8 | o S ■ 7= . £ ' c CD 73 CD S O a S O 7 3 O CO CO 1 c 13 ; T 3 . 2 o cg co £ co >, . 7 3 C ■P CD E CD | | 8 | 0 3 s m S I C3)73 co 3> $ Q . 5 5 5 x 3 O 2 ■ 0 £ ^ ■ — CD ■ S CT © re CD o " D ^ <D f c | CD ~ > C Q . 7 3 § E 3 5 co o O tf) o 1 m E 2 8 | O ) tf) = 7 3 75 E ■ o S î _ 7 3 ^ 5 ° 5 | ;« °> .. * » o m rfi si
S 5*f wc o ® 2 " CJ) > , f tf) -» 5 CNJ 2 C\J * S2 E1 2 28 co "O 1 "S s t1 co 3 7 3 tf) 3 2 ■ CO O S £1 S.t ô 2 £ 73 . ï » & ■ 73 CO 1 S 8 u >_ CD CD LZ * — CO O CD CJ) * " ç " "5.3 E oiT co 73 r ts s i
i r co 3 O o » ço 2 2 co ça t o 7 3 î —iii
CM H s CM N <T> t — y — F F 0 0 m u ■0 C I r i 2 e CD Q1 I
.2 sII
II
I X SS i a) . 0) ço § ■7 5 CNJ co 0 CJ) CJ) O ) O) CD T C E ? E 2 8 2 * 8 2 n s •sg ën
& e > 2!f
S CD U CD 1 °I
icipa l lengt h aany) . Mu n an d com | C 5 5S s5 t x 5i ? 5 I 5 xs i a. S ç a $ CL m u Q . CD U S
1
s» 3 « a. m o ® (O Oï h CO OJ t o r ^ C M C O ^ ^ ^ c b O Ï T ^ T j -• g ^ ' O J ' C D ' ' O j T i i " c c c c c c c c c S c o t o c o c o c o c o c o c o c o ( O C D < D < D < D ( D C D C D C D C D Q 5 5 5 5 5 5 5 5 5i 5
i- i o « œ _ Ô .E œ .E 5 C J O E E < E X f= Z û c o 2 2 < 2 o hOCQQCOCOXCQH ro ro ■o > . > o o "CD 2 O) CD g . S o — o S = " c" CD 0.73 g CD P CD 2 1 s ï e. ^ ; t/ï co > . Oï CD (DII
: Œ CD ■ *- T »- ^ in up ^-d 6 ci 5 x h-i l
O CO Ô E E E 2 2 CQ CQ CM 3 u 2 ° 5 . ^ CD ro 2 Ôf ?1
CD : = > C O.T3 § E 3 o S 8 1? cy ~ pifi
S CD « OJ » S CJ)11!
co e S TJ ' P p .2 o ô) o 0*5 « CD Q. > , C P 73 ,2 S 3 »>• 73 E P O co o x < x t x £ m r i 73 2 Eiii
co œ E i f s1.3.1.2 Data sources
Toxicological studies focusing on the carcinogenic potential of THMs on human health (NCI, 1976) resulted in the promulgation of standards for these compounds in drinking water (US.EPA, 1998; UE, 2001). Although several countries regulate THMs only, the US has also established standards for HAAs. In order to comply with regulations on CBPs in drinking water, THMs (or HAAs) are sampled routinely in public water systems. The monitoring approach for CBPs in drinking water differs from one country or region to another; therefore, resulting data may be very different (e.g., monitoring frequency, required number of sampling sites). However, these regulatory values are generally based on the annual average of quarterly measurements (minimum of 1 to 4 sampling locations per system). As shown in Table 1.2 (Column 3), in the majority of epidemiological studies (approximately 60%) focusing on adverse reproductive outcomes, CBP presence in distribution systems was estimated by monitoring data available through regulatory compliance (Bove et al., 1995; Dodds et al., 1999; Gallagher et al., 1998; Hinckley et al., 2005a; Infante-Rivard, 2004; Kramer et al., 1992; Lewis et al., 2006; Nieuwenhuijsen et al., 2008; Porter et al., 2005; Savitz et al., 1995; Shaw et al., 2003; Toledano et al., 2005; Waller et al., 1998; Wright et al., 2004; Wright et al., 2003).
As indicated in Column 3 of Table 1.2, other sources of CBP data differing from those resulting from regulatory monitoring were used to estimate CBP presence. Some authors used information concerning the characteristics of the water treatment plant (e.g., type of treatment or type of disinfectant) (Aschengrau et al., 1993; Kanitz et al., 1996; Magnus et al., 1999; Kallen and Robert, 2000; Yang et al., 2000). Other researchers used data obtained from a previous epidemiological study on cancer (Cedergren et al., 2002) or generated their own database through sampling campaigns within water distribution systems under study (Lynberg et al., 2001; Savitz et al., 2006). In some epidemiological studies, water samples were taken directly at a subject's residence tap and sometimes combined with regulatory monitoring data (Klotz and Pyrch, 1999; Lynberg et al., 2001; Dodds et al., 2004; King et al., 2005).