HAL Id: dumas-01230455
https://dumas.ccsd.cnrs.fr/dumas-01230455
Submitted on 9 Dec 2015HAL is a multi-disciplinary open access
archive for the deposit and dissemination of sci-entific research documents, whether they are pub-lished or not. The documents may come from teaching and research institutions in France or abroad, or from public or private research centers.
L’archive ouverte pluridisciplinaire HAL, est destinée au dépôt et à la diffusion de documents scientifiques de niveau recherche, publiés ou non, émanant des établissements d’enseignement et de recherche français ou étrangers, des laboratoires publics ou privés.
Pixel characterization for the MFT upgrade of the
ALICE experiment
Audrey Francisco
To cite this version:
Audrey Francisco. Pixel characterization for the MFT upgrade of the ALICE experiment. High Energy Physics - Phenomenology [hep-ph]. 2015. �dumas-01230455�
MASTER SCIENCES DE LA MATIERE
D
EUXIÈME
A
NNÉE
S
PÉCIALITÉ
: Physique des Particules
RAPPORT DE STAGE
Pixel characterization for the MFT upgrade of
the ALICE experiment
par
Audrey FRANCISCO
Responsables de stage : Gines MARTINEZ & Guillaume BATIGNE
!
Juin 2015
!
UFR Sciences et Technologies
Abstract
The first collisions from the run II of the Large Hadron Collider (LHC) have started with a p-p energy of 13TeV. By the end of this second run, the initial physics goals of the ALICE experiment will be reached. The foreseen high-luminosity upgrade of the LHC in 2020 will enhance the Pb-Pb collision rate up to 50kHz. In order to fully exploit this future potential, the ALICE collaboration is preparing for a major detector upgrade in 2018. The experiment focuses on the study of strongly interacting matter in extreme conditions of energy and density and in particular the quark gluon plasma (QGP), a new state of matter in which quarks and gluons are no longer bound like in hadrons but can roam freely. The strategy of the collaboration is to extend its physics program for fundamental studies of QCD. This requires high statistics and high precision measurements and will contribute to discriminate between theoretical models.
Rare probes play an important part in the physics program and the study of their coupling with the medium and hadronization processes is a major direction in the QGP understanding. The existing Muon spectrometer has produced very interesting results on the production rates of quarkonia and heavy flavor in p-p, Pb-Pb and p-Pb collisions and the second run is expected to deliver even more data. However multiple scattering in its frontal absorber originates a bad spatial resolution on vertices. This results in a high background level in both single muon and dimuon analyses coming from semi-muonic decays of light hadrons and also in limited possibilities to disentangle open charm and open beauty contribution to muon production.
To overcome this limitation and to better exploit the unique kinematic range accessible at the LHC by the Muon Spectrometer, the Muon Forward Tracker (MFT) is proposed in the context of the ALICE upgrade plans. Made of 912 pixel silicon sensors in 5 discs surrounding the beam-pipe, the detector is designed to measure tracks between the interaction point and the frontal absorber in order to be matched with the tracks of the muon spectrometer with an expected resolution lower than 100µm. It is foreseen to share the same sensor technology designed for the upgrade of the Inner Tracking System (ITS) : ALPIDE which is based on a new silicon pixel technology. This internship focuses on the sensor characterization to optimize the settings in respect to detection efficiency, noise and spatial resolution from the beam test analyse of the latest prototypes.
Résumé
Les premières collisions proton-proton à l’énergie de 13 TeV ont eu lieu avec le début du run II au Large Hadron Collider (LHC). A la fin de cette seconde prise de données, l’expérience ALICE aura atteint les objectifs initiaux du programme de physique qu’elle s’était fixés. Avec l’augmentation de la luminosity du LHC en 2020, le taux d’interactions des collisions Pb-Pb sera augmenté à 50kHz. Afin de tirer parti de ce futur potentiel, la collaboration ALICE se prépare pour une importante mise à jour de son détecteur en 2018. Cette expérience porte sur l’étude des propriétés physiques de la matière soumise à l’interaction forte, dans des conditions d’énergie et de densité extrêmes. Un nouvel état de la matière se forme alors, le plasma de quarks et de gluons (PQG), dans lequel les quarks et les gluons ne sont plus confinés au sein des hadrons mais peuvent évoluer librement. La stratégie de la collaboration est d’étendre son programme de physique pour des études fondamentales de chromodynamique quantique. Cela nécessite à la fois beaucoup de statistiques et des mesures très précises. Les résultats contribueront à affiner les modèles théoriques.
Les sondes rares jouent un rôle majeur dans l’étude du PQG. L’observation de leur interaction avec le milieu ainsi que les processus d’hadronisation qui y ont lieu sont des points clés dans sa compréhension. Le spectromètre à muons actuellement présent au sein du détecteur a fournit des résultats très intéressants sur les taux de production de quarkonia et de saveurs lourdes dans les collisions p-p, Pb-Pb et p-Pb. On peut s’attendre à ce que la deuxième période d’exploitation fournisse encore plus de données. Cependant, les diffusions multiples qui ont lieu dans l’absorbeur frontal induisent une mauvaise résolution sur les vertex. Cela se traduit par un bruit de fond élevé dans les canaux muon simple et dimuon, provenant principalement de désintégrations semi-muoniques des hadrons légers. Les possibilités d’isoler les contributions du charme et de la beauté ouverts du spectre muonique sont également limitées.
Afin de surmonter ces limitations et d’exploiter au maximum l’intervalle cinématique du spectromètre à muons, le Muon Forward Tracker (MFT) est proposé dans le contexte de la mise à jour d’ALICE. Constitué de 912 capteurs à pixels en silicium répartis sur 5 disques autour du faisceau, il est conçu pour détecter les particules entre le point d’interaction et l’absorbeur frontal. Les traces obtenues seront associées avec celles du spectromètre à muons. et la résolution attendue est inférieure à 100 µm. Il est prévu de s’aligner sur la même technologie que le futur Inner Tracking System (ITS) avec les capteurs ALPIDE. Ce stage porte sur la caractérisation de ces futurs capteurs et l’optimisation de leurs réglages par rapport à l’efficacité de détection, le niveau de bruit et la résolution spatiale au travers des tests sous faisceaux des derniers prototypes.
Contents
1 Introduction 5
2 Physics motivations 7
2.1 The Standard Model and the strong interaction . . . 7
2.2 Studying the Quark Gluon Plasma (QGP) with heavy ion collisions . . . 9
2.2.1 Heavy-ion collision evolution . . . 9
2.2.2 QGP probes . . . 10
2.2.3 Quarkonia (J/ψ and Υ) . . . 11
3 The ALICE detector 13 3.1 Detector overview . . . 13
3.2 The Muon Spectrometer . . . 13
4 The Muon Forward Tracker Upgrade 15 4.1 Detector description . . . 15
4.1.1 Limitations of the current Muon Spectrometer . . . 15
4.1.2 Main performance studies . . . 16
4.1.3 MFT layout . . . 17 4.2 MFT pixel detectors . . . 18 4.2.1 Semiconductor physics . . . 18 4.2.2 Pixels detectors . . . 19 4.2.3 pALPIDE chips . . . 20 5 ALPIDE characterization 23 5.1 Tests . . . 23 5.1.1 Laboratory tests . . . 23 5.1.2 Test beam . . . 25 5.2 Data analysis . . . 27
5.2.1 The EUTelescope framework . . . 27
5.2.2 Comments on irradiated chip results . . . 28
6 Conclusion 30 6.1 Characterization results . . . 30
1
Introduction
The LHC The Large Hadron Collider (LHC) is the world’s largest and most powerful particle accelerator ever built. Based at the European particle physics laboratory dedicated to the pursuit of fundamental science CERN, it lies in a 100m depth tunnel beneath the Franco-Swiss border near Geneva in Switzerland. The accelerator consists in a 27-kilometre ring of superconducting magnets where particles are accelerated at close to the speed of light and collide at four different locations around the ring where detector experiments (ALICE, ATLAS, CMS and LHCb) stand. LHC works by firing two beams of particles in opposite directions and forced to collide, releasing massive amounts of energy (proton-proton collisions at 7TeV for run I and 13TeV for run II). It uses some of the most powerful dipoles and radio-frequency cavities in existence. Figure 1 shows the LHC facility and the tunnel with two separate vacuum tubes channelling particles.
Figure 1: Overall view of the LHC facility and LHC under assembly
The accelerator complex is a succession of machines each injecting the beam into the next one with an increasing energy. The proton synchrotron is one of the key accelerator at LHC. It usually accelerates protons delivered by the Proton Synchrotron Booster or heavy ions from the Low Energy Ion Ring (LEIR) and injects these into the LHC ring. But it also provides beam for experiments and test-beam time can be requested for testing prototypes and calibrating detectors. Each of the four main detectors sits in huge caverns around the LHC ring to detect the products of the colliding particles. The first studies for the project were performed in 1982 for a machine cost of 5 billion CHF [14]. The first beam circulated successfully in 2008.
The LHC aims to answer some of the fundamental questions in high energy physics by testing the predictions of the Standard Model and looking for physics beyond the Standard Model.
The project is supported by an international community of scientists and engineers with more than 100 nationalities. Multinational teams all over the world work together, building and testing equipments and software as well as participating in experiments and analysing data.
Main experiments at the LHC
• ATLAS (A Toroidal Lhc ApparatuS) and CMS (Compact Muon Solenoid) are general pur-pose detectors designed to investigate a wide range of physics including the search for the Higgs boson, supersymmetry, extra dimensions and evidence for dark matter. Both exper-iments follow the similar scientific goals but use different design and technical solutions. • ALICE (A Large Ion Collider Experiment) is dedicated to study the properties of the state
quark-gluon plasma (QGP). ALICE has complementary capabilities with respect to ATLAS and CMS, both in pp and in Pb-Pb collisions, such as the low-pt reach. A more detailed
presentation is given in the next section.
• LHCb (Large Hadron Collider beauty) is specialized in investigating the differences between of matter and antimatter trough B mesons study. A series of sub-detectors surrounding the collision point stretches 20 meters in length. The experiment provides high quality measurements in p-p and p-Pb collisions but does no cover Pb-Pb collisions due to the unacceptably high occupancy that would be produced in the tracking detectors.
The LHC and experiments connected to it contain about 150 million sensors. Those sensors collect data and send it to various computing systems. The staggering volumes of collected data (approximately 1050Mb per second of rawdata is generated [9]) are processed by the Grid, a computing system built to handle it by connecting systems all over the world.
Status and upgrades The LHC finished its first run (2009 - 2013) successfully and delivered 30f b−1 of proton-proton collision data at 7 TeV and 8 TeV centre of mass energy. Two years of machine maintenance prepared it for the high energy run at 13 TeV which has already started. After this two-year overhaul, it will first reach 13 TeV and can potentially be cranked up to a maximum 14 TeV. Proton beams circulated at the beginning of May 2015 and the first collision attempts happened successfully. LHC operators will spend the coming weeks testing and checking all of the accelerator’s many subsystems from the CERN Control Centre. The experiments worked on detector upgrades to prepare for the high-luminosity upgrade (HL-LHC) in 2020. The instantaneous luminosity is expected to reach 6.1027cm−2s−1 for Pb-Pb collisions, which corresponds to an interaction rate of 50kHz. The detector upgrades aim to increase read-out rate, improve the quality of track reconstruction and extend the physics program.
2
Physics motivations
ALICE (A Large Ion Collider Experiment) is one of the four experiments at LHC. It focuses on heavy ion collisions and in particular the quark gluon plasma (QGP) properties study. The experiment was designed to investigate the physics of strongly interacting matter and to work in the high charged particle multiplicity environment of Pb-Pb collisions. The purpose of this experiment is to study how elementary particles are organized under the action of the strong interaction. It aims to answer some open questions about the parton–hadron transition and the nature of confinement, and about the nature of quantum chromodynamics matter at high temperature.
The ALICE experiment contributes to the resolution of one of the latests challenges in fun-damental physics by recounting the birth of matter. Such conditions of high temperature and density prevailed in the early Universe within a billionth of a second after the Big Bang, when the Universe is believed to have started with an explosion of energy and matter around 13.7 billion years ago. During these first moments all the particles and forces that shape our Universe came into existence, defining what we now see.
2.1 The Standard Model and the strong interaction
The Standard Model describes what matter is made of and how it holds together. It rests on two basic ideas: all matter is made of particles, and these particles interact with each other by exchanging other particles associated with the fundamental forces.
The matter is made of fermions and the force carriers are bosons (see figure 2).
Figure 2: Standard Model families
Quarks and leptons Elementary fermions come in two families : leptons and quarks. There are three generations of leptons : the electron (e−) with the electron neutrino (νe), the muon (µ−)
with the muon neutrino (νµ) and the tau (τ−) with the tau neutrino (ντ). The twelve fermions are the building blocks of matter. Each quark and lepton comes with its corresponding antiparticle. They are subject to the three fundamental interactions: gravitation, electromagnetism (excluding neutrinos, which are electrically neutral), and the weak interaction.
There are six types of quarks, known as flavours: up, down, charm, strange, top, and bottom. For every quark flavour there is a corresponding type of antiparticle, known as an antiquark. These can successfully account for all known mesons and baryons. Quarks are observed to occur only in combinations of one quark and one anti-quark (mesons) or three quarks (baryons). The most familiar baryons are the proton and neutron, which form the most ordinary matter and are each constructed from up and down quarks. Each of the six flavours of quarks can have
three different colours (conventionally red, green, and blue) playing the role of charge in the strong interaction. Quarks interact only in "colourless" combinations of three quarks or quark-antiquark pairs and experience all four elementary interactions : electromagnetism, gravitation, strong interaction, and weak interaction. In hadronic matter we ordinarily find around us, the quarks are confined : they are bound together inside hadrons by the strong interaction.
Interactions and mediating bosons The universe exists because fundamental particles in-teract. There are four fundamental interactions between particles. Within the Standard Model all interactions of fermions are mediated by the exchange of a boson.
The electromagnetic force is mediated by a single boson called the photon (γ), which couples to the charge of other particles. Only charged particles feel the effect of the electromagnetic force. This boson is massless and chargeless.
The weak force is the only force that couples to all the fermions. It has three mediating bosons : Z0 (chargeless) and W± (charged). The W± bosons couple to the weak isospin of par-ticles and the Z0boson couples to a combination of both weak isospin and charge. A property of the weak force is that its bosons can couple to each other. CMS and ATLAS discovered in 2012 a new particle around 126 GeV consistent with the Higgs boson (H) predicted by the Standard Model (no spin, electric charge nor colour charge). This discovery could prove the existence of the Higgs mechanism responsible for giving mass to particles.
The strong interaction is mediated through eight bosons called gluons. These are massless, electromagnetically neutral and couple to the colour charge of particles and among themselves. The strength of strong interaction increases with distance, thus no unbound quarks are seen in ordinary matter. The strong interaction is described in quantum chromodynamics with the SU (3)COLOU Rsymmetry group. The QCD potential is given at short distances by a Coulombian
term and a confining term, arising because of the self-interaction property of the colour field, as V ∝ 1r + r [4]. When the energy between two quarks becomes higher than the mass of a quark-antiquark pair, the interaction breaks up and creates two pairs of quark-antiquark. In 1973 David J. Gross, Frank Wilczek and H. David Politzer were awarded of the Nobel price for showing that the attraction between quarks grows weaker as the quarks approach one another more closely, and stronger as the quarks are separated.
This effect, known as asymptotic freedom, is illustrated on the figure 3 by the running coupling constant αs decreasing with the energy scale of the system.
2.2 Studying the Quark Gluon Plasma (QGP) with heavy ion collisions
Strongly-interacting matter at very high temperature and density is expected to exist in a state called the Quark–Gluon Plasma (QGP).
At low energy the confinement dominates, giving that the quarks can only be seen within hadrons and cannot be pulled apart since the potential energy between them increases with the distance. At high energy the interaction weakens giving an asymptotic freedom, quarks and gluon become quasi-free and the state of matter formed is a quark-gluon plasma which can be seen as a soup of quarks and gluons.
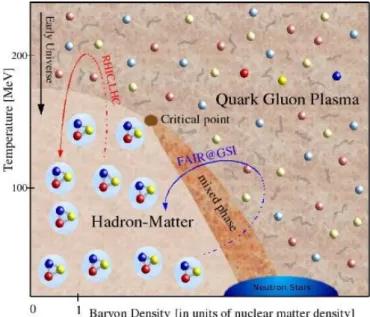
An early discovery was that the quark-gluon plasma behaves like a perfect fluid. Ultra-relativistic heavy-ion collisions aim to create this state moving from hadronic matter (on left bottom in the phase diagram fig. 4) to high temperature and vanishing baryon density.
Figure 4: Phase diagram of hadronic matter
The size of the QGP is expected to be of the order of a few fm and its life-time of few fm/c. Since 20 years several accelerators have been built aiming at reproducing the QGP: AGS, SPS, RHIC, and LHC.
Nucleus-nucleus collisions have been carried out for the last 20 years by the Super Proton Synchrotron at CERN and by the Relativistic Heavy Ion Collider at Brookhaven to study this state of matter in a laboratory. The experimental results confirm the production of a deconfined system that reaches a thermal equilibrium and behaves like an almost perfect fluid, following the equations of hydrodynamics, until it cools down and hadrons are produced again. The proper-ties of such a medium can be studied via probes coming from the interaction itself, namely the final-state detected particles.
2.2.1 Heavy-ion collision evolution
After the collision, the system expands and cools down. The evolution of heavy-ion collision is represented on figure 5.
Figure 5: Schematic view of heavy-ion collision evolution
During the first instants of the collision (t=0), hard interactions take place between the partons and this results in the production of high-momentum jets and heavy quarks. A very hot and dense medium is formed (pre-equilibrium). This QGP reaches a thermal equilibrium (1f m/c < t < 10f m/c) and expands under pressure gradients. Particles interact and quarks and gluons recombine into hadrons. The hadronization ends when the chemical freeze-out occurs : inelastic interactions cease and the particle abundance is established. After being formed, hadrons continue to scatter elastically until the thermal (or kinetic) freeze-out is reached.
2.2.2 QGP probes
The properties of the QGP are investigated through several probes. • The nuclear modification factor defined as RAA= d
2N
AA/dptdη
< Ncoll > d2Npp/dptdη
, with < Ncoll > begin the number of binary collisions, is the particle production ratio in nucleus-nucleus collisions and p-p collisions. A unity value indicates no effect of the nuclei and the plasma but any deviation spots a specific behaviour of nuclei-nuclei collisions.
• The strangeness enhancement is a signature of the QGP. The production of s¯s pairs requires a lower energy if a QGP is formed and the strange quarks can recombine into hadrons as the plasma cools down.
• The suppression of quarkonia is due to the colour screening of charged quarks. In a medium of charged particles, the interactions of one charge will be reduced or cancelled out by the surrounding charges. This effect is known as Debye screening. Within the Debye radius, the attractive interaction between the q ¯q constituents is effective but beyond this range it becomes so small that it is impossible for the pair to form a bound state, the quarks from the c¯c pair separate and hadronize by combining with light quarks. The colour screening radius decreases when the temperature raises.
• Jet quenching occurs during the production of a back-to-back particle jets from a quark pair. If it is produced in a peripheral region of the plasma, one jet can escape the medium without energy loss whereas the second one crosses it, interacting with the medium thus producing a less energetic jet. The effect of the plasma can then be directly observed by comparing the jets.
• Azimuthal anisotropy is observed when measuring transverse particle production. In the case of non-central collisions, the overlap zone is anisotropic and the fireball has an almond shape as illustrated on figure 6.
Figure 6: Reaction plane in nucleus-nucleus collisions
This originates larger pressure gradients and higher particle momenta along one axis. This is reflected by a preferential direction for particle emission in respect of the reaction plane. The particle anisotropy distribution can be expressed by a Fourier expansion. The coeffi-cient v1 is defined as the direct flow and v2 as the elliptical flow. The latter corresponds to
the pressure gradient in xz plane vs yz plane. When the elliptical flow is different from zero, it indicates a fast medium thermalization and gives access to hydrodynamical properties such as temperature and viscosity.
2.2.3 Quarkonia (J/ψ and Υ)
Quarkonia refer to bound states of a heavy quark with its antiquark. Several states of different quantum numbers have been discovered, starting with the vector states J/ψ and Υ.
The J/ψ particle is the first c¯c excited state with a mass mJ/ψ = (3096.916 ± 0.011)M eV /c2.
It was discovered by Burton Richter and Samuel Ting in 1974.
It mostly decays into hadrons (87.7 ± 0.5 %) and leptons (e+e−5.93 ± 0.10%, µ+µ−5.88 ± 0.10%). In the case a QGP formation, an anomalous suppression of J/ψ is expected : the c¯c pair becomes unbound in the plasma (Debye screening) and hadronizes by combining with light quarks. This is a signature for the quark-gluon plasma and must be dissociated from the normal suppression of J/ψ coming from its interactions with hadrons.
Matsui and Satz described in 1986 the suppression of charmonia by colour screening [7]. A sequential suppression pattern corresponding to the different state dissociation temperatures should also be observed. This effect is specific to the formation of a quark gluon plasma. A second origin to charmonia suppression lies in comover collisions, the states can be dissociated trough interactions with other particles independently of a QGP formation. It was recently suggested that regeneration of charmonia takes place during the hadronization stage of the QGP. It is believed this could explain the lower quarkonia suppression observed at LHC with comparison to RHIC results. Because of the higher energy level more recombinations of c¯c pairs should statistically occur.
The existence of b quark was established in 1977 at Fermilab with the Υ system made up of a bottom quark-antiquark pair (b¯b) with a mass mΥ= 9460.30 ± 0.26M eV for the 1S state.
bottom quark is heavier than the charm quark, the regeneration in the plasma should be lower in for Υ than for the charmonia.
These quarkonia as well as ηc, χ and ψ’ states for the charmonium spectrum and are stable under strong interactions and cannot decay into open charm or beauty because these decays are inhibited by the lack of phase space (mc¯c<< 2mD and mb¯b << 2mB).
Open charm (D) and open beauty (B) mesons are made of a heavy quark bound (respectively c and b) with a lighter quark. The resulting masses are about 1.9 GeV and 5.3 GeV for the lightest open mesons.
Quarkonia are particularly interesting to study as their mass main contribution comes from the quark masses, in contrast with lighter meson which masses arise almost entirely from the interaction energy. Heavy-flavor particles are believed to provide valuable probe for the QGP. They are abundantly produced in early stages of the collisions at LHC and can therefore expe-rience the full lifetime and evolution of the medium itself. Therefore quarkonia act as a deep insight into the mechanisms at work inside the plasma.
3
The ALICE detector
3.1 Detector overview
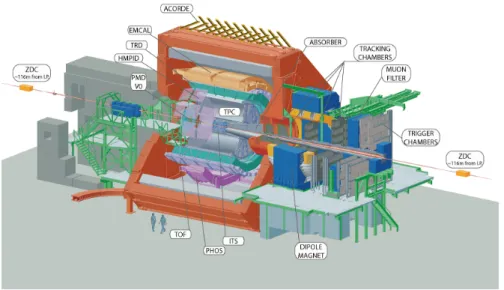
The quark gluon plasma can be seen as a fireball which instantly cools down. At this moment, the partons (quarks and gluons) hadronize into a multitude of particles speeding away in all directions. Much can be learned by studying the distribution and energy of these particles and their decay products. This is role of the ALICE detector : a 10,000-tonne, 26 m long, 16-m high, and 16-m wide apparatus. It sits in a vast cavern 56 m below ground receiving beams from the LHC. An international collaboration of more than 1,000 physicists, engineers and technicians from 30 countries is working on the experiment.
The apparatus is composed of a central barrel, a forward muon spectrometer and several small detectors for triggering and recording data (see figure 7).
Figure 7: The ALICE detector
Some detectors are dedicated to the tracking of charged particles. The passage of each particle within the acceptance (|η| < 0.9 for the central barrel) is measured in many points so its trajectory can be reconstructed in the ITS (Inner Tracking System) and the TPC (Time Projection Chamber) for example. Other detectors allow to identify the particle nature or are dedicated to one specific type of particle, such as the Muon Spectrometer.
3.2 The Muon Spectrometer
The Muon Spectrometer was designed to study open heavy flavor and quarkonia production (J/ψ, ψ ’ and Υ(1S), Υ(2S) and Υ(3S)) via the muonic channel. At the beginning of nucleus-nucleus collisions heavy quarks (c,b) are produced in hard partonic scattering processes which can form quarkonia (b¯b or c¯c mesons). Hard probes provide an useful tool to study the first and hottest stages of heavy-ion collisions. The modifications of the probe properties when crossing the plasma appear in the final state of the parton. The medium can be characterized by computing their production cross-sections and interactions, investigating parton energy loss in the plasma, studying phase transition and probing the medium temperature via the production rates of J/ψ and ψ ’.
The spectrometer covers the pseudo-rapidity region −4 < η < −2.5. It is composed of a frontal absorber, 5 tracking stations, a muon trigger system and a dipole magnet (fig : 8). The
Figure 8: Schematic of the Muon Spectrometer [4]
frontal absorber is made of iron, concrete, steel and tungstene and about 4m long. It filters muons for p & 4GeV /c. The tracking stations stand between z = −5.2m and z = −14.4m and detect particle hits with a resolution of 100 µm. The trigger systems is located after the trackers and consists of two planes of resistive plate chambers with a 2ns time resolution. A 5m length dipole magnet bends muon tracks by providing a magnetic field of up to 0.7 T in the horizontal direction. A thick iron wall (1.2m) is placed behind the tracking stations and stops electrons and eventual hadrons before the trigger chambers.
4
The Muon Forward Tracker Upgrade
After the first long shutdown (LS1) in 2014, the collision energy raised to 13TeV for pp and 5,1 TeV for Pb-Pb collisions. The luminosity will gradually increase during the next shutdowns, eventually reaching an interaction rate of about 50kHz.
The upgrade strategy of the ALICE collaboration is to reach a higher detection efficiency in Pb-Pb collisions and a better track reconstruction. The most affected detectors by this upgrade are the Inner Tracking System (ITS), the Time Projection Chamber (TPC) and the Muon Forward Tracker (MFT).
4.1 Detector description
The Muon Forward Tracker (MFT) is a new detector proposed to add vertexing capabilities to the current muon spectrometer. This silicon pixel tracker will stand between the interaction point and the hadron absorber (fig. 9).
Figure 9: MFT planes and position [1]
4.1.1 Limitations of the current Muon Spectrometer
The detector aims to address the main design limitations of the current muon arm, in particular: • the high level of background from π/K decays : high systematic uncertainties induced by background subtraction for all physics topics. Open heavy flavour analysis in single muons cannot access below pT = 4 GeV/c. ψ’ is hardly observed.
• the impossibility to determine muon production vertex. The muon spectrometer doesn’t separate charm from beauty. There is no J/ψ from B measurement. This could be an important source of information for the study of beauty. It is also not possible to disen-tangle prompt and displaced J/ψ production (its production from b-hadrons accounting for around 10% of the prompt cross section at low pT)
• the limited mass resolution (with a non-negligible impact at low mass)
The frontal absorber of the muon spectrometer suppresses all particles except muons and decreases the particle flux in order the minimize the muon decay background. However due to multiple Coulomb scattering processes, it induces an uncertainty on the vertex resolution.
Muon tracks in the spectrometer will be extrapolated and matched to the MFT clusters before the absorber. The MFT will thus allow a high pointing accuracy.
4.1.2 Main performance studies
The MFT will open new possibilities for ALICE in muon physics at forward rapidity. A vertex detector will enhance the muon spectrometer capabilities in precision measurements down to very low pT and give access to new measurements [5]. The main contribution will be the identification
of prompt and displaced J/ψ.
The current J/ψ spectra measured with the muon spectrometer includes a combinatorial background of semi-muonic decay from light hadrons and non-prompt correlated sources. The extraction of ψ(2S) signal will significantly benefits from this new detector. In particular, the sig-nal over background ratio (around 0.2-0.5% with the current muon spectrometer) is expected to improve by a factor up to 10. B hadron cross section down to pT = 0 will also be accessible
with-out extrapolation. Low-mass dimuon measurements will be considerably improved, especially for the mass resolution of ω and φ resonances. The MFT will enable to discriminate muons from charm and beauty decays down to very low pT (pT = 0 for charmed hadrons) and allow the
study of heavy flavour production in single-muon and dimuon channels. This will have many consequences from total charm and beauty cross section extractions to precision measurements for the energy loss of charm and beauty quarks as well as probing the charmonium regeneration theoretical models.
It will also provide a precious tool for studying the production of beauty meson in heavy-ion collisions. The secondary vertex for B decay is around 500µm from the primary vertex and the measurement of displaced J/ψ production is not possible without a vertex tracker.
Figure 10: Pseudo-proper decay time distributions of prompt and displaced J/ψ samples, based on the measurement of the longitudinal distance between the primary and the J/ψ vertices for 0-10% Pb-Pb collisions at √N N = 5.5T eV
The measurement of J/ψ production from beauty mesons is not currently accessible but the analysis of pseudo-proper decay length and time distributions (fig. 10) through prompt and displaced J/ψ vertices will allow it.
The MFT upgrade will significantly improve precision measurements in muon detection at forward rapidity and new observables will be accessible to study in-medium charmonium dynam-ics, study dissociation and regeneration mechanisms (with prompt J/ψ and ψ(2S) production), in-medium parton energy loss and beauty meson production measurements [6].
4.1.3 MFT layout
The MFT detector will be located between the ITS inner barrel and the frontal absorber of the muon spectrometer along the beam axis. Two half-cones surround the beam pipe and consist of 5 half-disks at a distance z = −460mm, −493mm, −531mm, −687mm, −768 mm from the interaction point with external radii of 92.6 mm for the first disk and 143.5 mm for the last one and staggered at 25.0 mm to 39.2 mm from the center of the beam pipe. The pseudo-rapidity coverage is −3.6 < η < −2.45.
The material budget of the disk is around 0.6%X0. About 300W heat needs to be extracted (mainly dissipated by the sensors and the read-out electronics). Studies are undergoing to find the optimal cooling system, water being the current fluid choice.
Particle detection is carried out by 912 silicon pixel sensors soldered with aluminium strips to a flex printed circuit.
The table 1 lists some expected features for the pixel sensors to meet the MFT specifications.
Parameter value spatial resolution 5µm pixel pitch 25µm detection efficiency >99.5% integration time < 20µs sensor thickness 50µm power dissipation < 150mW/cm2 Table 1: MFT requirements for the pixels
A pixel detector based on CMOS monolithic pixel sensor technology has been selected. The R&D on monolithic pixel detectors is ongoing in a common effort with the ITS group, as the same technology will be used for the new ALICE ITS detector. Monte-Carlo simulations predict a maximum radiation level of 380krad.
4.2 MFT pixel detectors
This section introduces the technology of future MFT pixel sensors. 4.2.1 Semiconductor physics
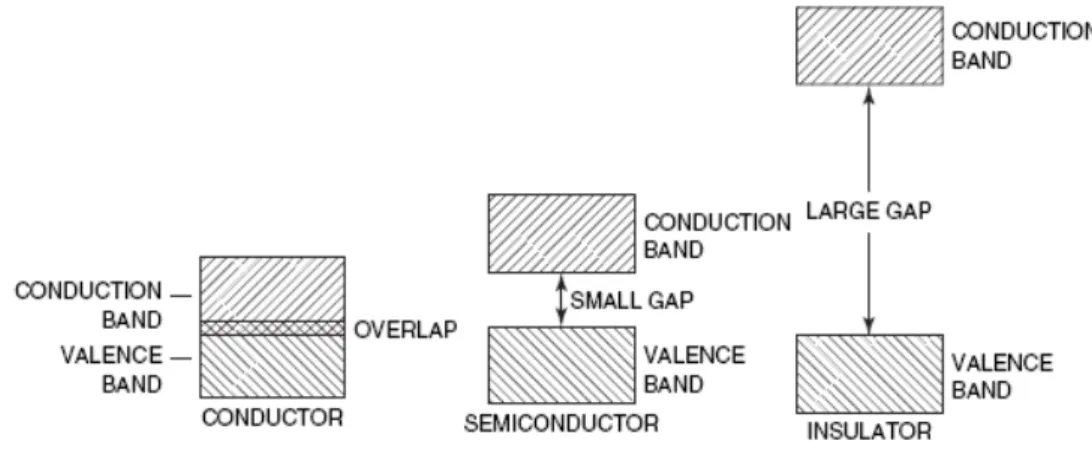
Detection of particles begins by interacting with a sensor material. A large number of materials have semiconducting properties. It is determined by an intermediate electrical conductivity between a conductor (ex: metal) and an insulator (ex: glass) caused by a specific band structure of the electrons (fig. 11). Silicon and germanium are widely used in semiconducting materials.
Figure 11: Comparison of conductor, semiconductor and insulator valence and conduction bands The level of conductivity of a material can be modified by the process of doping. It consists of introducing impurities into the crystal structure. Semiconductors doped with electron donor impurities are called n-type, while those doped with electron acceptor impurities are known as p-type.
A charged particle passing through a semiconductor material produces electron-hole pairs along its path. Holes and electrons transport is induced by diffusion and drift. Applying an electric field prevents charge recombination by sweeping the charge carriers to the electrodes and induces an electrical current. The absorbed energy can be obtained by integrating the signal current because it is proportional to the number of electron-hole pairs. The deposited energy in the sensor is converted into an electrical signal. The signal induced in a detector volume can be collected on electrodes and provide information on the path of the traversing particle with a clever segmentation. We will focus here on charged particles.
Energy loss of charged particles Charged particles loss energy through many scattering processes in the absorbing material. In the case of charged particle heavier than the electron (this is the case for muons as mµ ≈ 200me), the mean rate of energy loss is described by the Bethe-Bloch formula : − < dE dx >= Kz2 ZA 1 β2(12ln 2mec2β2γ2Tmax I2 + ...)
with < dEdx > is the energy loss, K = 4πNAvre2mec2 = 0.307075M eV cm2,NAvAvogadro constant,
z the charge of the incident particle in terms of electron charge, A and Z are the atomic mass and number of the absorber, methe electron mass, c the speed of light, β = vc the particle velocity in speed of light unit , γ = √1
1−β2 the Lorentz factor, I the mean excitation energy [eV] and Tmax the maximum kinetic energy transferred to a free electron in a single collision.
The energy loss is a discrete stochastic process. It depends on the particle type and momen-tum. The formula can be corrected with additional terms such as density and shell corrections not considered here.
pn-junction A pn-junction is formed by joining p-type and n-type regions in a single crystal semiconductor material (fig 12). Holes from the p-side diffuse into the n-side and electrons from the n-side diffuse into the p-side. Next to the junction, this process leads to a negative space charge in the p-side and a positive space charge in the n-side. It originates a depletion region and creates an electrical field. It is relevant to note that this effect is achieved without applying any external voltage to the junction. The width of the depletion layer can be decreased or increased depending on the sign of the voltage applied between the two ends of the junction. If the junction is forward biased (positive current), it allows the current to flow. Alternatively, if a junction is reverse biased (negative current), it acts like an open circuit blocking any current flow.
Figure 12: space charge density approximation for a pn-junction
A charge entering the depletion region will be removed by the electric field. A reverse biased pn-junction is the basic building block of silicon sensors. The built-up electric field collects the signal charge and reduces noise background by suppressing the leakage current.
Metal Oxide Semiconductor Field Effect Transistor (MOSFET) MOSFET transistors are widely used in microelectronics. Negative-channel metal-oxide semiconductor (NMOS) con-sists of a p-type semiconductor substrate covered by a thin oxide layer into which two n-type doped regions, the source and the drain have been embedded (respectively denoted with p+ and n+ symbols on fig. 13). A gate electrode lays on top of the insulating oxide layer between the source and the drain and a ground electrode is at the bottom of the substrate.
A MOSFET controls the electrical current flowing between the source and the drain by applying a voltage to the gate. The substrate is lightly doped with p-donors and its electrical resistance is very high so there is no current between the source and the drain if the gate voltage is zero. But if the gate voltage is high enough, charges can flow through the oxide layer between the n-type doped regions. In the case of positive-channel metal-oxide semiconductors (PMOS), the substrate is n-type doped and the regions in the oxide layer are p-type doped. The applied voltage must then be negative for the current to flow.
PMOS and NMOS capacitors act in a complementary way and are used to form CMOS transistors.
4.2.2 Pixels detectors
Semiconductor detectors consist of reverse biased pn-junctions with segmented electrodes. In-coming particles create charges in the depleted volume of the diode which are collected by the
Figure 13: Schematic cross-section of a MOSFET structure [10]
electric field and brought to contacts where it is processed by read-out electronics. Monolithic devices are formed by single chip where readout electronics is located on the surface and bulk is used as the sensor. The pixel detector is composed of matrix of such semiconductor detectors (pixels). Each pixel of the matrix is connected to its own electronic chain performing most of signal processing. The intrinsic spatial resolution of the reconstructed track points is determined by the segmentation of the detector.
Radiation damages on silicon : Detectors in high energy physics have very demanding re-quirements in terms of radiation hardness. The most commonly used material for tracking is silicon. Its atoms have four valence electrons and are arranged in a definite symmetrical pattern making them a solid structure. The energy for producing an electron-hole pair in silicon is only 3.6eV. The crystalline structure is sensitive to radiation damages but those were deeply inves-tigated and are thus predictable. Damages can be divided in two categories : bulk and surface effects [3]. Bulk damages are caused by crystal structure modifications. Atom displacements create imperfections which can be electrically active and thus modify electric properties of the material. The consequences include a higher leakage current, a modification of space charge in the depleted region and charge trapping resulting in a depletion voltage modification. The radia-tion scale is the NIEL (non-ionizing energy loss) and corresponds to the non-ionizaradia-tion deposited energy. The unit is often given in 1MeV neutron reference.
4.2.3 pALPIDE chips
Most of current particle trackers involve silicon microstrip and pixel sensors with read-out elec-tronics based on CMOS technology (application-specific integrated circuits, ASICs). This tech-nology offers great technical characteristics in terms of granularity, material thickness, read-out speed, power consumption and radiation hardness. The CMOS Monolithic Active Pixels Sen-sors (MAPS) may allow to go further by integrating both sensor and read-out electronics into a single detection device. It overcomes several CMOS limitations and in particular the interface optimization between the sensor and the read-out electronics.
Research have been conducted on this technology over the last 15 years and it has already been implemented on a large scale with the STAR PXL detector at RHIC, which is the first vertex detector based on MAPS. The STAR HFT (Heavy Flavor Tracker) has been successfully installed in time for the 2014 RHIC run. However the ALICE detectors do not have the same
specifications as the HFT, a different sensor was thus chosen to meet ITS and MFT requirements : the TowerJazz 0.18 µm CMOS Imaging Process [2].
The operation principle of this technology is similar to other semiconductor based sensors.
Figure 14: Schematic cross-section of CMOS pixel sensor using TowerJazz 0.18 µm CMOS Imaging Process
Electron-hole pairs created by a charged particle crossing the sensor volume are collected by the diode electrodes (the depletion volume is represented in white on the schematic cross section fig. 14).
The TowerJazz technology provides a high resistivity epitaxial layer (1-6 kΩcm) with a 18 µm thickness which can be increase up to 40 µm. These features contribute to enlarge the depletion layer and the tolerance to radiation damages. A deep p-well approach can also be considered (see figure) and improve charge collection efficiency and signal to noise ratio.
Several designs were implemented during the R&D phase. We will focus here on the ALPIDE (ALice PIxel DEtector) architecture which has an in-pixel discriminator and an in-matrix spar-sification read-out. This pixel chip was collaboratively developed by CCNU (Wuhan, China), CERN, INFN (Italy), and Yonsei (South Korea). It provides the best integration time (only 4µs) and power consumption (< 50mW/cm2) with a 28µmx28µm pitch. The sensors are thinned to 50 µm which corresponds to 0.054 % of radiation length.
Prototypes were developed at small and full scales to investigate and characterize the different architectures in order to to determine the best suited functionalities for the detectors. PALPIDE-fs is the first full scale prototype. The first version was operational in May 2014 and one year later, the second version pALPIDE-2 is ready for testing. The chip consists of an array of 1024x512 pixels divided into 4 sectors with different pixels. Every single pixel is designed using an octagonal-shaped collection electrode. The electrode is few µm wide and is surrounded by a p+ ring.
Figure 15: pALPIDE-1 chip (30mmx15mm) and pixel geometry
The differences between the sectors are sum up in the table 2. The reset structure details are given in the appendix (figures 29 and 30)
Sector Nwell diameter Spacing Pwell Reset
0 2µm 1µm 4µm PMOS
1 2µm 2µm 6µm PMOS
2 2µm 2µm 6µm diode
3 2µm 4µm 10µm PMOS
Table 2: Pixel differences between the sectors
From September and December test beams, the pixels with the diode reset (sector 2) seem to give the better performances with a higher detection efficiency and a better resolution but all sectors have correct performances with respect to the detectors requirements. The next prototypes will have more sectors to investigate deeply the differences in the pixel geometry before the final design.
5
ALPIDE characterization
The work presented here focused on testing the full scale pixel chip prototype pALPIDEfs. The main goal is to determine several parameters such as pixel by pixel threshold variation, noise behaviour, charge collection efficiency (using radioactive sources), detection efficiency, spatial resolution (via test beam) and environment effects on the performance (radiation TID and/or NIEL, temperature, high particle multiplicity...) to understand, predict and optimize the chip behaviour.
5.1 Tests
5.1.1 Laboratory tests
Once the chips are produced, tests are performed in the laboratory to first check if they are properly working. The chips are mounted on carrier board by wire bonding. The carrier cards are then connected to read-out boards linked by USB cable to a computer (fig. 16).
Figure 16: DAQ card read-out connected to the chip
These DAQ (Data AcQuisition) boards provide all readout and control functionality as well as ADCs for current measurements. A software was developed to perform chip functionality tests via the command line interface [17] [13].
• Powering test : measurement of power consumption
• FIFO scan : quick test to check the communication with the chip by writing and reading back 3 different bit patterns in each cell of the pixel matrix.
• DAC scan : measurement of the output values for onboard voltage values by looping over the values from 0 to 255 injected charges for each digital-analog converter (DAC).
• Threshold scan : analogue injections by looping over the charge. It is generally limited to 1% of the pixels due to the speed of the threshold scan and the resulting time length (several hours for 100%).
• Reset scan : charge injection in each pixel to determine the reset voltage to apply.
• Noise scan : evaluation of the number of noisy pixels by recording of a big number (100k) of events
Many other tests are also available depending on which chip functionality is investigated. This step is crucial as it checks the communication of the chip and allows to go through a detailed study of the chip analogue front-end and the differences in pixel design for each sector. Problems leading to a given pixel being not functional can be on different levels: the diode, analog or digital circuitry, digital readout, etc. If there is a significant fraction of non functional pixels, this leads to inefficient areas in the detector.
The most important biasing parameters are the IT HR current and the VCASN voltage (see
the schematic view of the analogue front-end figure 27 in the appendix). For example, decreasing the IT HR value reduces the electron threshold and leads to a higher efficiency and a larger cluster size. The figure 17 indicates that the threshold increases as a function of the IT HR current. The
Figure 17: IT HR impact on threshold [15]
threshold corresponds to the minimum charge collection for a pixel to be registered as a hit. On the other hand, a lower VCASN voltage leads to the same result but does not impact the pulse
duration. Applying an additional reverse bias (VBB) influences the charge collection process by
expanding the depletion zone. These tests help to determine which values of IT HR and VCASN to use for each back bias voltage.
5.1.2 Test beam
After checking if the chips are working, these can be used in one of the beam facilities. An intensive irradiation campaign was carried out for the characterization of the first ALPIDE full scale prototype. Several test beams were performed at PS (CERN) with 5-7 GeV π−, at SPS(CERN) with 120 GeV π−, at PAL(Korea) with 60 MeV e−, at BTF (Frascati) with 450 MeV e− and at DESY (Germany) with 5.8 GeV e+. I will here describe the followed procedure at PS for the test beam of May 2015.
Beam settings First the beam profile must be set. Using different magnet configurations, it is possible to modify the beam focus to get the required one (corresponding to the experiment distance from the beam outlet). In order to do so, several focuses were used and the beam profile was set up with a scintillator. The figure 18 is the beam profile in x and y coordinates for a focus of +7m.
Figure 18: Beam profile
Then the chips can be settled. There are seven chips : the middle three are under testing (called DUT for Device Under Testing) and the others are used for the alignment. The figure 19 shows the chips in the telescope with the DAQ boards sitting on the top of it.
The red cables are used for the chip power supply and the black ones on the top are USB cables
Figure 19: EUDET telescope with the chips and the DAQ
alignment with the beam is checked. The hitmaps for each chip are plotted.
Figure 20: Hitmap example
The preceding figure (fig. 20 is an example of hitmap obtained during the PS test beam of December 2014. The different chip sectors are separated by double dead columns and will be analysed separately.
Experimental setup The chips are surrounded by two scintillators at the front and at the back of the scintillators which are used as a trigger for the data taking. On the figure 21 the beam is coming from the left, crosses the two scintillators (in black), the telescope and the final scintillator (only one was used during this data taking).
Figure 21: Experimental setup for test beam at PS in May 2015
Noise run are also taken by moving the telescope away from the beam (in x and y in transverse plane) and turning around so it is not facing the beam anymore.
The EUDAQ software It is designed for data taking during test beam. It provides a run control window to control chip powering and configuration and a log window displays information on the current run status. The data taking is automatic and the setting files indicate the parameter values to use for each run. It stops and goes to next run when the specified number of events is reached. Some plots are updated online such as hitmaps so the user can check if data is recorded.
5.2 Data analysis
5.2.1 The EUTelescope framework
The EUTelescope framework was implemented in the context of the EUDET project. This group of processors is used for DUT measurements. Its purpose is to provide a full-featured infrastructure for analysis and reconstruction of data taken with pixel beam telescopes. The software was originally created for MIMOSA pixel characterization. The algorithm package is designed and supported by the DESY collaboration. The test beam analysis is performed within this framework.
The analysis steps are the following : The rawdata files created with the EUDAQ environ-nement are analysed by the software to evaluate if the run is noise or data. If it is a noise run, then noise occupancy is calculated and raw hitmaps including hot pixels are plotted. If it is a data run, then it goes through the following procedure :
• Dead double columns are found (a double column is considered as dead if a pixel address appears twice or if the number of hits in double column is lower than 70 % of hits in the neighbouring columns).
• Hot pixels are searched for. Several parameters can be optimized for this step such as the maximum allowed firing frequency or the considered number of events.
• Pixels are grouped into clusters and correlations between clusters are plotted. • Hit centres of gravity are calculated.
• A prealignement followed by a precise alignment step is performed by calculating shifts in x and y and rotation around z. The alignment is calculated from straight tracks. Here again many parameters can be tuned up to optimize the reconstruction.
• Hotpixel, clustering and hitmaker steps are performed once more. • Tracks are fitted to the hits.
• The analysis step itself is performed by calculating efficiency, resolution and cluster size. The chain is run by one script and plots are automatically saved. Two alignment procedures are available by using a run by run alignment or a common alignment. Combining runs is a valid option if the planes did not move between the runs and can be useful in some cases with few statistics to help with track reconstruction. Scripts have been written to compare runs with dif-ferent settings into one file for the plotting. These produced plots are used to compare efficiency, noise occupancy, cluster size, residuals and resolution as a function of biasing parameters IT HR
and VCASN. As an example, the following pictures (fig. 22 and 23) show the results from the test beam at PS in December 2014. The results refers to 50 µm thinned chips with the indicated irradiation levels (non irradiated, 0.25x10¹³ MeV neq/cm2 and 1x10¹³ MeV neq/cm2).
Figure 22: Detection efficiency and spatial resolution vs IT HR [15]
Figure 23: Cluster size vs position within cluster [15]
5.2.2 Comments on irradiated chip results
Transient and permanent effects are caused by electromagnetic radiations passing through sili-con detectors and the device properties are affected. The noise level is increased by the higher leakage current and the signal is reduced due to charge trapping in the epitaxial layer.
Irradiated chips were already investigated but with a lower irradiation level of 1x10¹³ MeV neq/cm2. It is useful to remember here the requirements for ITS and MFT detectors of 1.7x10¹³
MeV neq/cm2. This includes a safety factor of 10 and corresponds to a 10-year lifetime of the
detectors. The chips were irradiated at the Jozef Stefan Institute (Ljubljana) with neutrons from the Triga Mark II reactor.
Three chips were available for this test beam. These were first tested with the correspond-ing software at the laboratory. The first idea was to use different back bias voltages down to VBB = −6V as it was done for the previous chips but it was not possible because of the
re-sulting current in the chip. The maximum allowed value varies chip by chip from -2V to -5V. The performed scans reveal different behaviour of the sectors. In particular the sector 3 is very noisy. On the figure 24 are plotted the results of a reset scan. Charge is injected through the injection capacitance present in each pixel. This capacitance is connected to the preamplifier input. By applying a voltage step dV to the capacitance, a charge Q= C ∗ dV is deposited into the preamplifier. It can be done for all pixels, each line represents one pixel and the colours stand for the different sector. Few pixels were tested here (0,06%) but it already gives an idea of the pixel response. Enhancing the IRESET current (PMOS active reset current, see fig.27 in the appendix) revealed to be the key parameter to reduce the noise (fig. 24). A systematic check was performed for each chip and each back bias voltage until the result of the scan was satisfying
Figure 24: Impact of IRESET on Reset scan for VBB = −3V
within a range of [50mV,150mV] for IRESET.
Then the chips were moved to the test beam area and several runs were taken during two days.
The first analysis have started and will be carried out during the next weeks. The next plots (fig. 25) show preliminary results in one chip for efficiencies and cluster size.
(DAC units) thr I 0 10 20 30 40 50 60 70 80 Ef fic ie n cy ( %) 84 86 88 90 92 94 96 98 100 Sector 2 = 57 casn V = 83 casn V = 109 casn V (DAC units) thr I 0 10 20 30 40 50 60 70 80 Av e ra g e c lu s te r s iz e ( p ix e ls ) 1 1.2 1.4 1.6 1.8 2 2.2 2.4 Sector 2 = 57 casn V = 83 casn V = 109 casn V
Figure 25: Efficiency and cluster size and for sector 2 in 1x10¹³ MeV neq/cm2 irradiated chip
The efficiencies are lower than for the non- or lower irradiated chips and this was expected in regard of the very high irradiation level. This indicates how important the values for the parameter VCASN and IT HR are and how these influence the chip efficiency. Only the sector 2 is plotted here but there is big differences between the different sectors. The sector 3 in particular is revealing an unexpected trend. This has to be checked and linked with the results of the laboratory tests. The cluster size and residuals seem comparable with previous results but some fluctuations still need to be investigated. The next step will be to perform noise scans and analyse the noise runs taken at PS to verify the coherence of the results.
6
Conclusion
6.1 Characterization results
The beam test campaign carried out on pALPIDE chips was intense and covered around 200 different configurations. The analysis of the data indicates very satisfying results with a spatial resolution lower than 5 µm including a sufficient operational margin. In the optimal cases, the requested efficiency of 99% is safely covered as well as the noise occupancy range below 10−5/event/pixel for the sector 2 and a back bias VBB= −3V , even for irradiated chips. Besides,
few chip by chip fluctuations were observed.
Figure 26: Resolution and efficiency vs IT HR [15]
These preliminary results (see figure 26) seem promising and the analysis of the chip with the highest irradiation level will complete the investigation of pALPIDE-V1.
6.2 Future developments
During this first period I got familiar with the pixel technology, the software environment and the experimental setup. The next months of this internship will also be dedicated to the pixel characterization, starting with a deeper analysis of the irradiated chip results.
The next version of the chip pALPIDE-V2 is also ready for testing. This prototype is also a full scale chip and is featured with the final interface which allows to integrate it into the modules. Another prototype should be ready by the end of the summer 2015 and will be the last one before the final chip planned for February 2016. Another architecture, MISTRAL, was also deeply investigated with good performances. It is currently optimized for the outer layers of the ITS with a spatial resolution of 10µm and a power consumption of 100mW/cm2.
List of Figures
1 Overall view of the LHC facility and LHC under assembly . . . 5
2 Standard Model families . . . 7
3 Evolution of the strong coupling constant αs as function of the the energy scale E 8 4 Phase diagram of hadronic matter . . . 9
5 Schematic view of heavy-ion collision evolution . . . 10
6 Reaction plane in nucleus-nucleus collisions . . . 11
7 The ALICE detector . . . 13
8 Schematic of the Muon Spectrometer [4] . . . 14
9 MFT planes and position [1] . . . 15
10 Pseudo-proper decay time distributions of prompt and displaced J/ψ samples, based on the measurement of the longitudinal distance between the primary and the J/ψ vertices for 0-10% Pb-Pb collisions at√N N = 5.5T eV . . . 16
11 Comparison of conductor, semiconductor and insulator valence and conduction bands . . . 18
12 space charge density approximation for a pn-junction . . . 19
13 Schematic cross-section of a MOSFET structure [10] . . . 20
14 Schematic cross-section of CMOS pixel sensor using TowerJazz 0.18 µm CMOS Imaging Process . . . 21
15 pALPIDE-1 chip (30mmx15mm) and pixel geometry . . . 22
16 DAQ card read-out connected to the chip . . . 23
17 IT HR impact on threshold [15] . . . 24
18 Beam profile . . . 25
19 EUDET telescope with the chips and the DAQ . . . 25
20 Hitmap example . . . 26
21 Experimental setup for test beam at PS in May 2015 . . . 26
22 Detection efficiency and spatial resolution vs IT HR [15] . . . 28
23 Cluster size vs position within cluster [15] . . . 28
24 Impact of IRESET on Reset scan for VBB= −3V . . . 29
25 Efficiency and cluster size and for sector 2 in 1x10¹³ MeV neq/cm2 irradiated chip 29 26 Resolution and efficiency vs IT HR [15] . . . 30
27 ALPIDE front-end electronics for diode reset . . . 2
28 ALPIDE front-end electronics for PMOS reset . . . 2
29 Pixel cross section with diode reset structure . . . 3
30 Pixel cross section with PMOS reset structure . . . 3
List of Tables
1 MFT requirements for the pixels . . . 17Appendix
Figure 27: ALPIDE front-end electronics for diode reset
Figure 29: Pixel cross section with diode reset structure
References
[1] ALICE Collaboration, B. Abelev et al., Technical Design Report for the Muon Forward Tracker, CERN-LHCC-2015-001, ALICE-TDR-018
[2] ALICE Collaboration, B. Abelev et al., Technical Design Report for the Up-grade of the ALICE Inner Tracking System, J.Phys. G41, 087002 (2014), doi:10.1088/0954-3899/ 41/8/087002.
[3] L. Rossi, P. Fischer, T. Roher, N. Wermes, Pixel Detectors, From Fundamentals to Applications, Springer (2010)
[4] Antoine Lardeux. Etude de la production inclusive de J/ dans les collisions Pb-Pb àp(sN N )=2,76 TeV avec le spectromètre à muons de l’expérience ALICE au LHC. Other. Ecole des Mines de Nantes, 2014. French. <NNT : 2014EMNA0129>. <tel-01044653>
[5] ALICE, Letter of Intent for the Upgrade of the ALICE Experiment, CERN-LHCC-2012-012 (2012)
[6] ALICE Collaboration, Addendum to the Letter of Intent, CERN-LHCC-2013-014 [7] T. Matsui and H. Satz, J/ψ Suppression by Quark-Gluon Plasma Formation,
Physics Letters B 178, 416 (1986), doi:doi:10.1016/0370-2693(86)91404-8.
[8] J. Jakubek1, Institute of Experimental and Applied Physics, Czech Technical University in Prague,Horska 3a/22, CZ 12800 Prague 2, Czech Republic
[9] http : //home.web.cern.ch/about/computing/processing − what − record [10] http : //www.electronics − tutorials.ws/transistor/tran6.html
[11] Michal SZELEZNIAK, Development of pixel detectors with integrated microcir-cuits for the Vertex Detector in the STAR experiment at the RHIC collider, Uni-versité Louis Pasteur I, 2008
[12] Chaosong GAO (CCNU), Jerome ROUSSET (MIND), INVESTIGATOR0 CHIP,CERN dec 2013
[13] Jan Fiete Grosse-Oetringhaus, Broken Pixels in pALPIDEfs-1, V1.0 – January 29, 2015
[14] CERN, CERN faq LHC the guide, 2003 version, http://multimedia-gallery.web.cern.ch/multimedia- gallery/Brochures.aspx
[15] Monika Kofarago, Upgrade of the Inner Tracking System of ALICE, 24th Inter-national Workshop on Vertex Detectors, June 2015
[16] Luciano Musa, Upgrade of the ALICE Inner Tracking System, PHDetectorSemi-nar, CERN,17 April 2015
[17] Markus Keil, pALPIDEfs software - Installation and command line interface rev. 1, August 7, 2014


![Figure 8: Schematic of the Muon Spectrometer [4]](https://thumb-eu.123doks.com/thumbv2/123doknet/5617401.135419/15.892.217.683.122.368/figure-schematic-of-the-muon-spectrometer.webp)
![Figure 9: MFT planes and position [1]](https://thumb-eu.123doks.com/thumbv2/123doknet/5617401.135419/16.892.150.755.459.687/figure-mft-planes-and-position.webp)