Anatomy of the White Bear Suppression Inventory
(WBSI): A Review of Previous Findings and a New
Approach
Ralph E. SCHMIDT,1,2 Philippe GAY, 1,2 Delphine COURVOISIER,2 Françoise JERMANN,3 Grazia CESCHI,2 Melissa DAVID,2 Kerstin BRINKMANN,4 AND Martial VAN DER LINDEN1,2
1Swiss Center for Affective Sciences, University of Geneva, Switzerland
2Cognitive Psychopathology and Neuropsychology Unit, Department of Psychology, University
of Geneva, Switzerland
3University Hospitals of Geneva, Switzerland
4Geneva Motivation Laboratory, Department of Psychology, University of Geneva, Switzerland
ABSTRACT
The White Bear Suppression Inventory (WBSI; Wegner & Zanakos, 1994) was originally designed to assess people’s inclination toward thought suppression. In this article, we provide a detailed review of previous findings on the structure of this instrument and present a study that took a new statistical approach. It involved an exploratory factor analysis of the French WBSI using the weighted least squares mean and variance estimator as well as parametric item response theory analyses. Results clearly supported a 2-factor structure with a “suppression” and an “intrusion” dimension. Follow-up regression analyses revealed that intrusion significantly predicted anxiety and depression scores, whereas suppression did not.
Everybody experiences unwanted intrusive thoughts once in a while. If they persist, they may grow more and more distressing and contribute to psychopathological states such as generalized anxiety disorder, obsessive–compulsive disorder, depression, posttraumatic stress disorder, or insomnia (for a review, see Clark, 2005). A considerable body of evidence suggests that unwanted intrusive thoughts may paradoxically be fueled by attempts to suppress them (for reviews, see Najmi & Wegner, 2008; Rassin, 2005). This line of research was sparked by Wegner, Schneider, Carter, and White’s (1987) discovery of a suppression-induced rebound effect: Participants instructed to try not to think of a white bear indicated more white-bear thoughts during a subsequent expression period than did participants during an initial expression period followed by a suppression period. In 1994, Wegner proposed ironic
= =
process theory to account for paradoxical effects of thought suppression. According to this theory, any attempt at suppression sets into motion an interplay between two processes: (a) a controlled distracter search that is on the lookout for contents other than the to- be-suppressed target thought to divert attention away from it; and (b) an automatic monitoring process that scans the mental environment for intrusions of the target thought to renew, if necessary, the first process. The rebound of the target thought is explained by the fact that if the controlled distracter search is voluntarily relinquished or disabled by other resource-demanding tasks, the automatic and therefore less resource-dependent monitoring lingers on, thereby enhancing the accessibility of the target thought.
To assess people’s general tendency to suppress unwanted thoughts, Wegner and Zanakos (1994) developed the White Bear Suppression Inventory (WBSI), a 15-item self-report questionnaire. Using a principal axis extraction with varimax rotation, Wegner and Zanakos found that a one-factor solution accounted for 55.0% of the variance. Across several large student samples, internal consistency of the WBSI was high, with Cronbach’s alpha ranging from .87 to .89. Furthermore, the WBSI scores evidenced acceptable levels of temporal stability, suggesting that this instrument captures a trait-like chronic suppression tendency.
Wegner and Zanakos (1994) assumed that the consequences of chronic suppression should parallel those found for experimentally induced suppression. More specifically, repetitive suppression attempts should result in a state of vigilance and preoccupation with the recurring thoughts. That is, chronic suppression should be associated with obsessional thinking. Furthermore, given that “anxiety-producing thoughts and de- pressing thoughts . . . represent two broad classes of thinking that could often prompt suppression in a person so inclined,” Wegner and Zanakos (1994) expected that “chronic thought suppression should be related to hypersensitivity to depressing and anxiety-producing thoughts” and should contribute to a “magnification of both depression and anxiousness” (p. 619).
In support of their predictions, Wegner and Zanakos established that the WBSI was significantly correlated with the Maudsley Obsessive–Compulsive Inventory (MOCI; Rachman & Hodgson, 1980; range of r = .38–.40), the trait version of the State–Trait Anxiety Inventory (STAI–T; Spielberger, Gorsuch, & Lushene, 1970; r =.53), and the Beck Depression Inventory (BDI; Beck, Rush, Shaw, & Emery, 1979; range of r = .44–.52).
Since its publication, the WBSI has been widely used as attested by a total of 189 references to Wegner and Zanakos’ (1994) article in the ISI Web of Knowledge (2008). However, the factorial structure of this questionnaire has increasingly come under debate, with some studies that have suggested two- or three-factor solutions instead of the initially proposed single dimension of suppression. Hereafter, we review previous investigations into the structure of the WBSI in the following sequence: first, studies using principal component analysis (PCA); second, studies using exploratory factor analysis (EFA) or confirmatory factor analysis (CFA); and third, the only previous study to use item response theory (IRT).
INVESTIGATIONS INTO THE STRUCTURE OF THE WBSI USING PCA
Five investigations of translated versions of the WBSI have used PCA to explore the structure of this instrument. In three of these studies, scree plots have pointed to a one-factor solution (Dutch WBSI: Muris, Merckelbach, & Horselenberg, 1996; Spinhoven & van der Does, 1999; Icelandic WBSI: Rafnsson & Smari, 2001). Despite their defense of a one factor solution on statistical grounds, the two mentioned groups of Dutch researchers have surmised on the basis of semantic interpretations that several items of this questionnaire assess intrusiveness of unwanted thoughts rather than suppression efforts. As a consequence, they have proposed “corrected WBSI versions” comprising 10 (Muris et al., 1996) and 5 items (Spinhoven & van der Does, 1999), respectively (see Table 1). In support of the researchers’ semantic hunch, two subsequent studies that have used PCA and scree plots have made a two-factor solution appear more adequate, with one factor capturing suppression efforts and the other intrusion susceptibility (German WBSI: Höping & de Jong-Meyer, 2003; Dutch WBSI: Rassin, 2003; see Table 1). With regard to criterion validity, the three studies that have suggested a one-factor solution (Muris et al., 1996; Rafnsson & Smari, 2001; Spinhoven & van der Does, 1999) have largely replicated the results obtained by Wegner and Zanakos (1994).
Specifically, the WBSI was significantly correlated with measures of anxiety (STAI–T: r = .57; Symptom Checklist-90 [SCL-90, Derogatis, 2000]: r =.40), depression (BDI: r =.54; SCL–90: r =.57), and obsession compulsion (MOCI: range of r = .35–.43). However, the two studies that have suggested a split of the WBSI into a suppression and an intrusion subscale (Höping & de Jong-Meyer, 2003; Rassin, 2003) have presented a more complex pattern of findings. Höping and de Jong-Meyer (2003) observed that the intrusion factor was moderately to strongly correlated with measures of anxiety (STAI–T: r =.59), depression (BDI: r =.44), and obsessive–compulsive tendencies (MOCI: r = .42), whereas the suppression factor was not substantially linked to these measures (STAI–T: r =.11; BDI: r = .15; MOCI: r = .11). This finding led Höping and de Jong-Meyer to conclude that the well-established association between the WBSI and measures of psychopathology is essentially driven by items that capture the frequency of intrusive thoughts. In defense of their two-factor proposal, Höping and de Jong-Meyer pointed out that a high frequency of intrusions is not necessarily synonymous with a high level of suppression. For instance, a high recurrence of intrusions may just as well result from a very low level of suppression, either because the person does not choose to suppress unpleasant thoughts in the first place or because of a breakdown of suppression efforts.
Table 1 - Summary of studies proposing modifications to the original structure of the White Bear Suppression Inventory (WBSI).
Note. S = suppression; I = intrusion; D = self-distraction; L = low factor loading (≤ .35); C = cross loading (≥ .35 on another factor); Q = (marginally) significant Q index; [ ] = item removed; * = modification solely based on semantic analysis. Items are presented in the order found in Wegner and Zanakos (1994); in the French WBSI, items are presented in a slightly different order corresponding to the English WBSI available on Daniel M. Wegner’s homepage at Harvard University (http://www.wjh.harvard.edu/∼wegner/wbsi.html).
Rassin (2003) explored the criterion validity of the WBSI in two different samples. In a sample of high school and university students, multiple regression analyses revealed that the intrusion factor significantly predicted anxiety (STAI–T: β =.28), obsession compulsion (MOCI: β = .30), and general psychopathology scores (SCL–90: β = .31), whereas the suppression factor did not. In contrast, suppression significantly predicted depression (BDI: β = .47), whereas intrusion did not. In a clinical sample of mental health care patients, intrusion likewise predicted obsession–compulsion scores (MOCI: β = .49), whereas suppression did not. However, the reverse was true for general psychopathology: with this sample, suppression was a significant predictor (SCL–90: β = .49), whereas intrusion was not. Rassin (2003) concluded that these findings yielded further support for the
idea that the WBSI assesses both thought suppression and intrusive thoughts as well as for the notion advanced by Höping and de Jong-Meyer (2003) that the intrusion items may inflate the correlation between the WBSI and measures of psychopathology
Finally, it is worth mentioning that Muris et al. (1996) also explored the associations between suppression as assessed by the WBSI and the use of other thought control strategies as evaluated by the Thought Control Questionnaire (TCQ; Wells & Davies, 1994). The relations were positive between the WBSI and TCQ distraction (r =.21), punishment (r =.33), worry (r =.22), and reappraisal (r = .15) but negative for social control (r = –.17). In accord with Wells and Davies’ (1994) theoretical framework, the latter findings suggest that the goal to stop thinking about something can be pursued using different strategies that may prove more or less efficacious in reducing levels of unwanted intrusions. The fact that intrusions may be paradoxically fueled by different thought control techniques constitutes a conceptual reason for clearly distinguishing between questionnaire items that refer to a specific control technique and items that relate to control outcome in terms of intrusions.
INVESTIGATIONS INTO THE STRUCTURE OF THE WBSI USING EFA AND CFA
In the first investigation apart from Wegner and Zanakos’ (1994) study to use latent-variable modeling, Blumberg (2000) had a large sample of students complete the original English version of the WBSI. For analytical purposes, Blumberg then split the sample into two groups and conducted a maximum likelihood (ML) EFA using promax rotation on the WBSI scores of the first group.Even though the scree plot suggested a one-factor solution, eigenvalues and additional goodness-of-fit criteria suggested a three-factor solution with intercorrelations ranging from .45 to .52. Based on the wording of the respective items, the three factors were labeled “Unwanted Intrusive Thoughts,” “Thought Suppression,” and “Self-Distraction.” Taken together, the three factors accounted for 63.6% of the variance. Follow-up CFA on the WBSI scores of the second group of students corroborated that the three-factor solution provided a better fit to the data than did the two alternative models. A limitation of Blumberg’s study resides in the fact that he did not assess external correlates of the three WBSI subscales.
More recently, Luciano et al. (2006) administered a Spanish version of the WBSI (Lucero, 2002) to a large sample encompassing students and nonstudent adults from the general population. By means of a series of CFA using the ML estimation method with a robust correction, Luciano et al. then compared the fit of six alternative models: the original one-factor model (Wegner & Zanakos, 1994), three previously tested two-factor models (Blumberg, 2000; Höping & de Jong-Meyer, 2003; Rassin, 2003), a new two-factor model that combined Blumberg’s (2000) Factors 2 and 3 into one single dimension, and Blumberg’s three-factor model. Although none of these models provided a good fit to the data, the three-factor model emerged as the best relative solution.
Luciano et al. (2006) nevertheless settled on the newly pro- posed two-factor model because (a) its fit was almost equivalent to that of the three-factor model; and (b) in the three-factor model, the
correlation between the second (Suppression) and third (Self-Distraction) factor was extremely high (r =.92), suggesting a strong overlap between the two dimensions. In the two-factor model, the correlation between the factors was also high (r = .86). Regarding validity, both WBSI subscales were significantly correlated with measures of depression (BDI–II; Beck, Steer, & Brown, 1996; r = .46 [intrusive thoughts]; r = .40 [suppression]), obsessive–compulsive symptoms (MOCI; r = . [intrusive thoughts]; r =.39 [suppression]), and pathological worry (Penn State Worry Questionnaire [PSWQ]; Meyer, Miller, Metzger, & Borkovec, 1990; r =.47 [intrusive thoughts]; r =.43 [suppression]). A limitation of Luciano et al.’s (2006) study is that, in contrast to Rassin (2003), they did not pit intrusions and suppression against each other in a multiple regression analysis with psychopathological measures as outcome variables.
INVESTIGATION INTO THE STRUCTURE OF THE WBSI USING IRT
The most recent investigation of the psychometric properties of the WBSI conducted by Palm and Strong (2007) differed in three respects from all previous studies: (a) a principal axis EFA was conducted on polychoric correlations, (b) the reported factor solution was unrotated, and (c) the WBSI was further analyzed using nonparametric IRT methods. A scree test and the relative size of the eigenvalues suggested a one-factor solution, accounting for 80.0% of the variance. However, an item-by-item analysis using item and option characteristic curves led Palm and Strong to discard nine items because of their ineffectiveness in discriminating varying levels of thought suppression. When compared with the whole scale, the resulting six-item version of the WBSI retained almost identical correlations to measures of depression (BDI–II: r =.52 [WBSI]; r = .50 [short WBSI]), worry (PSWQ; r =.54 [WBSI]; r = .53 [short WBSI]), and emotional avoidance. Even though Palm and Strong explicitly referred to the latent trait as “thought suppression,” they conceded that the wording of the six items captures both suppression efforts and the experience of intrusions. Palm and Strong acknowledged that the poor performance of the nine dropped items might be explained by the fact that they tap into a different latent trait. In conclusion, Palm and Strong suggested that future studies should investigate the psychometric properties of the WBSI using a parametric IRT approach to see if it concurs with their nonparametric approach
With the exception of the study by Palm and Strong (2007), a problem with all previously reported investigations is that they relied on analyses that assumed continuous observable variables; answers to the WBSI items, however, represent categorical (ordinal) variables. To overcome this problem, in this study, we followed a new approach. We analyzed the WBSI using methods specifically adapted to ordinal observable variables, namely, the weighted least squares mean and variance (WLSMV) estimation technique and IRT. Taking up the suggestion of Palm and Strong, we used a parametric IRT approach that allowed (a) estimation of the relative fit of several models for the WBSI, (b) evaluation of the items’ appropriateness to measure underlying constructs, and (c) identification of latent trait levels that are “underrepresented” by the WBSI items. To explore the associations between the WBSI and psychopathology, we included two measures that have frequently been used in previous research and
that cover highly prevalent symptoms, namely, the BDI–II (depression) and the STAI–T (anxiety).
METHOD
PARTICIPANTS AND PROCEDURE
A first sample of 197 participants (176 female, 21 male; M age = 22.84 years, SD = 5.47) completed the French WBSI and the French versions of the BDI–II (Beck, Steer, & Brown, 1998) and the STAI–T (Spielberger, Gorsuch, Lushene, Vagg, & Jacobs, 1993). A second sample of 117 participants (99 female, 18 male; M age = 24.71 years, SD= 4.97) completed the same questionnaires. Participants were 1st-year students (first sample) and 3rd-1st-year students (second sample) from the Faculty of Psychology and Educational Sciences at the University of Geneva and were collectively assessed during classes.
INSTRUMENTS
The WBSI (Wegner & Zanakos, 1994) comprises 15 items that were originally developed to evaluate chronic thought suppression tendencies (see Table 1 for the wording). Answers are given on a 5-point Likert scale ranging from A (strongly disagree) t o E (strongly agree). The French version of the WBSI was developed as follows: (a) The fourth author of the present study (F. Jermann) translated the English WBSI into French; (b) an English–French bilingual person, a certified translator, translated the French version back into English; and (c) the fourth author and the translator compared the original English WBSI with the back translation and performed minor stylistic modifications on three items of the French WBSI so that it mirrored more faithfully the English version.
The French version of the BDI–II (Beck et al., 1998) is a 21-item scale assessing depressive symptoms. Each item involves four statements graded from 0 (e.g., I do not feel sad) to 3 (e.g., I am so sad or unhappy that I can’t stand it) from which respondents have to choose the one that best describes the way that they have been feeling during the preceding 2 weeks. The internal consistency of this scale in our sample was high (Cronbach’s α = .86).
The French version of the STAI–T (Spielberger et al., 1993) is a 20-item scale measuring anxiety as a trait. Respondents are asked to indicate on a 4-point Likert scale ranging from 1 (almost never) to 4 (almost always) the degree to which they endorse statements such as “I feel nervous and restless.” The internal consistency of this scale in our sample was high (Cronbach’s α = .90).
RESULTS
EFA AND IRT ANALYSES OF THE WBSI SCORES OF THE FIRST SAMPLE (N = 197)
We conducted an EFA (using the WLSMV estimation technique and a promax rotation) on the WBSI scores of the first sample. In contrast to the “default” ML estimation technique, which was used by
Blumberg (2000) and Luciano et al. (2006), the WLSMV is well suited for non-normally distributed or categorical data sets (Muthén & Muthén, 2006). An additional advantage of this estimation technique resides in its being efficient even with comparatively small sample sizes on the order of 200 cases (e.g., Beauducel & Herzberg, 2006).
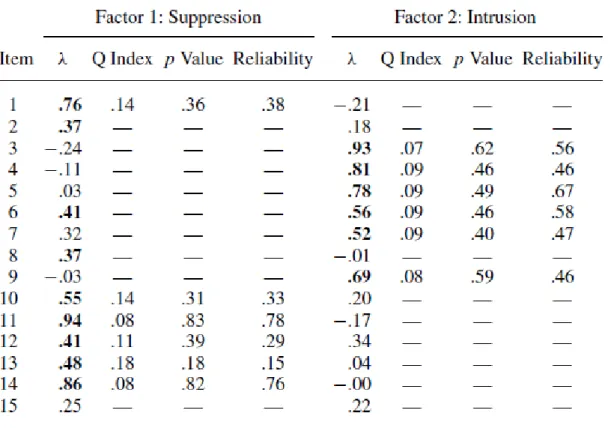
Table 2 - Loadings of the EFA and Results of the IRT analyses for the WBSI (Sample 1).
Note. Q indexes and their associated p values and reliabilities are given for Models 1D (Suppression) and 2 (Intrusion). EFA exploratory factor analysis; IRT item response theory; WBSI White Bear Suppression Inventory; λ factor loadings (loadings > .35 highlighted in bold).
We favored the oblique promax rotation technique over orthogonal techniques (e.g., varimax) because all previously reported multidimensional models for the WBSI have suggested the existence of highly intercorrelated factors. To determine the number of factors, we computed a scree plot as was done in most of the previously published studies on the WBSI. In addition, we computed a parallel analysis (Horn, 1965), and we conducted Velicer’s (1976) minimum average partial test on the correlation matrix. All three methods clearly suggested a two-factor solution. The factor loadings for the two-factor solution are displayed in Table 2. The maximum loading of all items exceeded .35, except for Item 15 (λmax .25). Item 6 showed a loading above .35 on both factors. On the basis of the
=
=
wording of the items, Factor 1 was labeled Suppression and Factor 2 Intrusion.
An IRT analysis (e.g., Reise, Ainsworth, & Haviland, 2005) of a one-dimensional model encompassing all items that loaded more strongly on Suppression (Items 1, 2, 8, and 10–15) did not provide a good fit (Table 3, Model 1A; chi-square p values were computed using a parametric bootstrap procedure with 500 replications [R 500]). To identify items that were inappropriate for measuring the underlying construct, we computed Q indexes (Rost & von Davier, 1994). An item Q index indicates the distance between the expected response pattern (given the parameters of the model) and the observed response pat- tern. A Q index of 0 indicates a perfectly fitting item, an index of .5 suggests that an item bears no relation to the measured construct, and an index of 1 represents a maximal misfit. A Q index between 0 and .3 is generally considered to reflect a good fit. Q indexes are reported with associated p values; a p value below .05 indicates that the item is significantly different from the other items. Item reliability, which represents the percentage of variance of each item that is explained by the latent person variable, is equal to the square of the standardized item discrimination parameter. Item discrimination parameters are equivalent to factor loadings in CFA, which are generally considered small when they are below .30. Hence, item reliability should not be inferior to .10.
The p value of the Q index for Item 8 was significant (Q index =.26, p = .047), suggesting that this item does not measure the same dimension as do the other items. Removal of Item 8, however, did not improve the fit of the model (Table 3, Model 1B). Given that the p value of the Q index for Item 15 was marginally significant (Q index = .22, p = .06) and that this item had shown a low loading in the EFA (λ =.25), a third model without Items 8 and 15 was tested (Table 3, Model 1C). This model provided a slightly better fit than did Model 1B. Given that the Q index for Item 2 was marginally significant in Model 1C (Q index =.19, p = .06), a final model without Items 2, 8, and 15 was computed (Table 3, Model 1D). This model yielded an acceptable fit, with all p values for the Item Q indexes being clearly nonsignificant (ps ≥.18). The general reliability of this model was .82 (Cronbach’s α =.78). The general reliability coefficient was obtained by means of analysis of variance reliability (Rost & von Davier, 1994), which indicates the percentage of variance of the observed variables that the model explains. With regard to Intrusion, an IRT analysis of a one-dimensional model encompassing all items that loaded more strongly on this factor (Items 3, 4, 5, 6, 7, and 9) fit the data well, with all p values for the Item Q indexes being nonsignificant (ps ≥ .40; Table 3, Model 2). The general reliability of this model was .84 (Cronbach’s α = .84).
IRT ANALYSES OF THE WBSI SCORES OF THE SECOND SAMPLE (N = 117)
IRT analyses of the four previously described one- dimensional models of Suppression (Models 1A, 1B, 1C, and 1D) revealed that Model 1D was the only one to yield a good fit to the WBSI scores, Pearson’s
χ2(15577, N = 117) = 87,959.44, p = .10, with all p values for the Item Q indexes being nonsignificant (ps
≥.22). The general reliability of this model was .84 (Cronbach’s α = .79). With regard to Intrusion, an IRT analysis showed that the previously presented one-dimensional model (Model 2) fit the data well, Pearson’s χ2(15577, N = 117) = 14,958.68, p = .20, with all p values of the Item Q indexes being
nonsignificant (ps ≥ .27). The general reliability of this model was .87 (Cronbach’s α = .88). In sum, the best-fitting models for Suppression and Intrusion as obtained with the first sample (Models 1D and 2) also emerged as the most adequate models for the data of the second sample.
Table 3 - Fit indexes derived from IRT analyses of different models for the WBSI (Sample 1). Dimension Model Items Pearson’s χ2 df p
Value
AIC BIC CAIC
Suppression 1A 1, 2, 8, 10–15 6,512,235.94 1953053 .03 4929.66 5163.13 5234.13 1B 1, 2, 10–15 788,249.50 390561 .03 4366.41 4573.57 4636.57 1C 1, 2, 10–14 113,986.74 78069 .06 3784.09 3964.95 4019.95 1D 1, 10– 14 14,758.42 15577 .27 3216.37 3371.16 3418.16 Intrusion 2 3–7, 9 26,545.11 15577 .10 3335.54 3491.26 3538.26
Figure 1 - Total information curves for the Suppression and Intrusion scales of the White Bear Suppression Inventory (N = 314).
IRT ANALYSES OF THE WBSI SCORES OF BOTH SAMPLES (N = 314)
After validating the models in two different samples, we conducted IRT analyses for Models 1D and 2 on the combined data sets of Samples 1 and 2, totaling 314 participants. Model 1D for Suppression provided a good fit, Pearson’s χ2(15577, N = 314) = 29,503.20, p = .053, with all p values of the Item Q
indexes being nonsignificant (ps ≥ .19). The general reliability of this model was .82 (Cronbach’s α = .78). Model 2 for Intrusion also yielded a good fit, Pearson’s χ (15577, N = 314) = 27,987.04, p = .08, with all p values of the Item Q indexes being non-significant (ps ≥.40). The general reliability of this model was .85 (Cronbach’s α = .86).7
The total information curves (TICs) depicted in Figure 1 show that the Suppression scale was generally more informative on its construct than was the Intrusion scale. Although the Intrusion scale appropriately assessed individuals with a medium level of intrusions (person parameters between −2 and +2), the Suppression scale showed a relative information trough for individuals whose person parameters hovered around 1. Moreover, both scales were of little informative value at the extreme ends of the person parameter continuum.
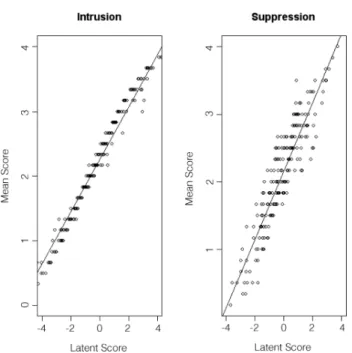
Figure 2 - Mean-to-latent-score scatter plots for the Suppression and Intrusion scales of the White Bear Suppression Inventory (N = 314)
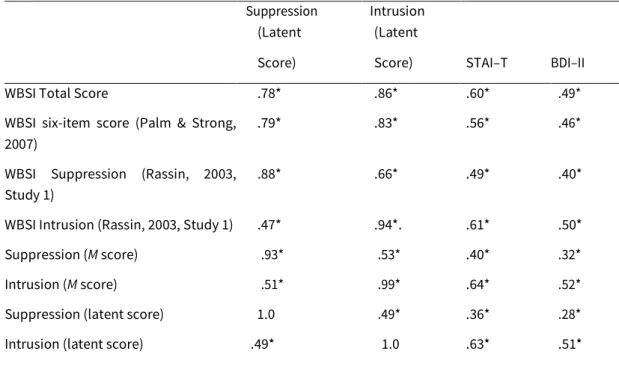
Table 4 - Pearson correlations between WBSI total and subscale scores, anxiety (STAI–T), and depression (BDI–II). Suppression
(Latent
Intrusion (Latent
Score) Score) STAI–T BDI–II
WBSI Total Score .78* .86* .60* .49*
WBSI six-item score (Palm & Strong, 2007)
.79* .83* .56* .46*
WBSI Suppression (Rassin, 2003, Study 1)
.88* .66* .49* .40*
WBSI Intrusion (Rassin, 2003, Study 1) .47* .94*. .61* .50*
Suppression (M score) .93* .53* .40* .32*
Intrusion (M score) .51* .99* .64* .52*
Suppression (latent score) 1.0 .49* .36* .28*
Intrusion (latent score) .49* 1.0 .63* .51*
Note. N = 314. WBSI = White Bear Suppression Inventory; STAI–T = State–Trait Anxiety Inventory; BDI–II = Beck Depression Inventory–II.
* = significant at the p < .001 level, two-tailed.
Finally, the two panels of Figure 2 illustrate the relations between mean and latent scores for the Intrusion and Suppression scales, respectively. Mean and latent scores for the Intrusion scale were closely connected. Thus, the computation of mean Intrusion scores and that of latent scores using IRT will yield roughly equivalent results. By comparison, mean and latent scores for the Suppression scale were less closely correlated. The computation of mean Suppression scores and that of latent scores may therefore produce slightly diverging results.
RELATIONS BETWEEN DIMENSIONS OF THE WBSI, ANXIETY, AND DEPRESSION (N = 314)
To explore how the WBSI related to measures of anxiety and depression, we correlated STAI–T and BDI– II total scores with different measures derived from the WBSI: WBSI total score, six-item score according to Palm and Strong (2007), suppression and intrusion scores according to Rassin (2003, Study 1), and mean and latent scores of Suppression and Intrusion (see Table 4). Three sets of findings merit highlighting: (a) Both Suppression and Intrusion correlated significantly with anxiety and depression, but the respective ties were closer for Intrusion than for Suppression; (b) the WBSI total score and the six-item WBSI score according to Palm and Strong (2007) were more strongly associated with Intrusion than with Suppression, suggesting that these two WBSI-derived scores captured mainly the frequency of intrusions and that their respective relations to anxiety and depression were inflated by
intrusion-sensitive items; and (c) although Rassin’s (2003, Study 1) dimensions of suppression and intrusion came close to our corresponding latent variables, the respective relations with external correlates suggested that our model more neatly differentiated between suppression tendencies and intrusion susceptibility.
Two multiple regression analyses were conducted to further examine the relations between Suppression, Intrusion, anxiety, and depression. When regressing the STAI–T scores on both WBSI subscale latent scores, Suppression proved to be a non-significant predictor, β = .06, t (312) = 1.05, p = .30, whereas Intrusion turned out to be a significant predictor, β = .60, t (312) =10.26, p< .001. An analogous pattern emerged for the BDI–II scores: Suppression did not significantly predict them, β = .04, t (312) = 0.56, p = .58, whereas Intrusion did, β = .49, t (312) = 7.57, p < .001. To determine if the Intrusion latent scores had better predictive validity than did the WBSI total scores, we conducted hierarchical regression analyses. When the WBSI total scores were entered first into the regression, they explained 35.4% of the variance of the STAI–T scores; the additional variance explained by Intrusion was significantly different from zero: R2 change = .051, F (1, 311) = 20.22, p < .001. In contrast,
when the Intrusion scores were entered first, they predicted 39.2% of the variance, and adding the WBSI total scores did not augment the proportion of explained variance substantially, R2 change =
.013, F (1, 311) = 5.05, p = .03. A similar pattern of results was found for the BDI–II. That is, Intrusion explained additional variance, R2 change = .028, F (1, 311) = 8.98, p < .01 when the BDI–II scores
were first regressed on the WBSI total scores (explained variance 23.8%). In contrast, adding the WBSI total scores did not increase the proportion of explained variance substantially, R2 change =
.012, F (1, 311) = 3.81, p = .05 when the BDI–II scores were first regressed on Intrusion (explained variance = 25.4%).
DISCUSSION
The aim of this study was to examine the factor structure and the psychometric properties of the WBSI (Wegner & Zanakos, 1994) and to explore its relations with two broad classes of intrusion-related symptoms, namely, anxiety and depression. Our investigation went beyond previous research by using statistical methods specifically designed to manage ordinal data, namely, an EFA using the WLSMV estimator and parametric IRT analyses. Our main findings may be summarized as follows: (a) The EFA clearly suggested that the items of the WBSI capture two distinct dimensions, the tendency to rely on thought suppression and the frequency of experiencing intrusive thoughts; (b) IRT analyses indicated that three WBSI items did not fit well with any of these dimensions; (c) TIC analyses revealed that the Suppression subscale was generally more informative than was the Intrusion subscale, but that the Suppression subscale presented an information trough for individuals who scored slightly above average; and (d) multiple regression analyses showed that only Intrusion scores significantly predicted levels of anxiety and depression and that they predicted them better than did WBSI total scores. Initially, finding d might seem at odds with finding c, but the fact that Suppression items yielded more information
on suppression tendency than did Intrusion items on intrusion susceptibility does not imply that the first subscale is more closely tied to external criteria.
Our results obtained with a parametric IRT approach concur with those of Palm and Strong’s (2007) nonparametric approach insofar as the six items that emerged as psychometrically sound in their study also did so in ours. The main divergence between the two studies resides in the fact that Palm and Strong found evidence for a one-factor solution, whereas our data clearly supported a distinction between two factors—a discrepancy that is likely due to differences in factor analysis and not to those between parametric and nonparametric IRT approaches. For example, Palm and Strong’s analysis is based on an unrotated principal axis factor (Palm & Strong, 2007; K. Palm, personal communication, November 26, 2007). The main advantage of this methodological option is that it maximizes the amount of variance accounted for by the first factor (e.g., Floyd & Widaman, 1995). A rotated solution, in contrast, generally shows a more even distribution of the explained variance among the factors and presents the advantage of revealing the solution with the best “simple structure” (e.g., Fabrigar, Wegener, MacCallum, & Strahan, 1999).
Unsurprisingly, then, Palm and Strong’s (2007) first factor accounted for a large amount of the common variance (80.0%). However, the three items that loaded significantly on their second factor also loaded strongly on their first factor. That is, their two-factor solution, contrary to the ideal of a simple structure, consistently presented double loadings. The wording of the three items that loaded on Palm and Strong’s second factor all clearly refer to suppression (see Table 1, Items 1, 11, and 14). These three items have systematically loaded on the suppression factor in this study and in all previously published multifactor solutions for the WBSI. This suggests that Palm and Strong’s second factor, which was ultimately not retained, captured suppression more purely than did their first factor. In support of this interpretation, Palm and Strong’s so-called suppression factor correlated more closely with our Intrusion factor than it did with our Suppression factor (see Table 4). Thus, the reported correlations between Palm and Strong’s suppression factor and measures of psychopathology may have been essentially driven by intrusion-sensitive items.
Four preceding investigations arrived at the conclusion, as did our investigation, that WBSI scores are best accounted for by a two-factor model (Höping & de Jong-Meyer, 2003; Luciano et al., 2006; Rassin, 2003 [two investigations]; see also the semantic interpretations of Muris et al., 1996, and Spinhoven & van der Does, 1999), whereas one investigation provided evidence for a three-factor model (Blumberg, 2000). When comparing the four previously proposed two-factor solutions with ours (see Table 1), five suppression-related items (Items 1, 10, 11, 13, and 14) and four intrusion-related items (Items 3, 4, 5, and 9) emerged as uncontroversial in the sense that all studies have unanimously attributed them to one or the other factor. Considering that the comparison involves four linguistically different versions of the WBSI, this degree of concordance is remark- able and bears testimony to the psychometric robustness of the mentioned items.
highlighted by our findings that in multiple regression analyses, only the frequency of intrusive thoughts successfully predicted anxiety and depression scores. These results clearly support a differentiation between suppression and intrusion items—contrary to the recently advocated return to a one-dimensional model for the WBSI (Palm & Strong, 2007). Previous investigations into the structure of the WBSI had produced rather equivocal criterion-related evidence for a distinction between suppression and intrusion items. One possible explanation for these contradictions is suggested by our comparative analysis of the relations between WBSI-derived scores and measures of anxiety and depression (see Table 4). Judging by our own two-factor solution, alternative suppression subscales contain intrusion-sensitive items that may spuriously inflate the relation between this technique of mental control and measures of psychopathology.
Even though suppression proneness did not significantly predict anxiety and depression scores in our study, a consistent body of evidence suggests that thought suppression constitutes an important maintenance mechanism for a broad range of clinical disorders (Najmi & Wegner, 2008; Rassin, 2005). The Suppression subscale taps this mental control mechanism and thus allows researchers and practitioners to chart levels of thought suppression, for example, as a function of treatment progress (e.g., Purdon, 2004; Purdon, Rowa, & Antony, 2007). As for the Intrusion subscale, it taps mental control outcome rather than a specific mental control mechanism. Given that the frequency of intrusions is highly predictive of symptom severity across different disorders (e.g., Clark, 2005), this subscale complements the suppression subscale in that it permits researchers and practitioners to trace the incidence of unwanted thoughts that may—or may not—echo fluctuations in suppression. In view of the close correlations between mean and latent scores of the Suppression and Intrusion subscales (see Table 4), practitioners may legitimately use mean subscale scores as a convenient proxy for latent scores. Our TIC analyses provide preliminary indications for a possible expansion of the WBSI. The Suppression subscale, for example, presented an information trough for slightly above average suppressors, which might be filled with additional items at the appropriate level of difficulty. However, three limitations of our study preclude any definite recommendations for a future refinement of the WBSI: the small sample size, the underrepresentation of men, and the fact that our participants were university students. Given that most of the earlier reviewed WBSI studies were based on student samples, more investigations involving clinical samples are clearly warranted to explore the high and low ends of the dimensions of mental control that the WBSI captures. In addition, tracking levels of suppression and intrusion in longitudinal clinical studies (cf. Purdon et al., 2007) could provide further evidence for the discriminant validity of the two WBSI-derived subscales.
REFERENCES
Beauducel, A., & Herzberg, P. Y. (2006). On the performance of maximum likelihood versus means and variance adjusted weighted least squares estimation in CFA. Structural Equation Modeling, 13, 186–203.
Beck, A. T., Rush, A. J., Shaw, B. F., & Emery, G. (1979). Cognitive therapy for depression. New York: Guilford. Beck, A. T., Steer, R. A., & Brown, G. K. (1996). Manual for the Beck Depression Inventory–II. San Antonio, TX: Psychological Corporation.
Beck, A. T., Steer, R. A., & Brown, G. K. (1998). Inventaire de Dépression de Beck (2ème éd.) Manuel [Beck Depression
Inventory (2nd ed.): Manual]. Paris: Editions du Centre de Psychologie Appliquée (ECPA).
Blumberg, S. J. (2000). The White Bear Suppression Inventory: Revisiting its factor structure. Personality and Individual Differences, 29, 943–950.
Clark, D. A. (Ed.). (2005). Intrusive thoughts in clinical disorders. New York: Guilford.
Derogatis, L. R. (2000). SCL–90–R. In A. E. Kazdin (Ed.), Encyclopedia of psychology (Vol. 7, pp. 192–193). Washington, DC: American Psychological Association.
Fabrigar, L. R., Wegener, D. T., MacCallum, R. C., & Strahan, E. J. (1999). Evaluating the use of exploratory factor analysis in psychological research. Psychological Methods, 4, 272–299.
Floyd, F. J., & Widaman, K. F. (1995). Factor analysis in the development and refinement of clinical assessment instruments. Psychological Assessment, 7, 286–299.
Höping, W., & de Jong-Meyer, R. (2003). Differentiating unwanted intrusive thoughts from thought suppression: What does the White Bear Suppression Inventory measure? Personality and Individual Differences, 34, 1049–1055.
Horn, J. L. (1965). A rationale and test for the number of factors in factor analysis. Psychometrika, 30, 179–185. ISI Web of Knowledge. (2008). Web of science. Retrieved June 3, 2008, from http://apps.isiknowledge.com Lucero, M. (2002). Pensamientos intrusivos en poblacio´n general [Intrusive thoughts in the normal population]. Unpublished doctoral dissertation, University of Valencia, Valencia, Spain.
Luciano, J. V., Belloch, A., Algarabel, S., Toma´s, J. M., Morillo, C., & Lucero, M. (2006). Confirmatory factor analysis of the White Bear Suppression Inventory and the Thought Control Questionnaire: A comparison of alternative models. European Journal of Psychological Assessment, 22, 250–258.
Meyer, T. J., Miller, M. L., Metzger, R. L., & Borkovec, T. D. (1990). Development and validation of the Penn State Worry Questionnaire. Behaviour Research and Therapy, 28, 487–495.
Muris, P., Merckelbach, H., & Horselenberg, R. (1996). Individual differences in thought suppression. The White Bear Suppression Inventory: Factor structure, reliability, validity and correlates. Behaviour Research and Therapy, 34, 501– 513.
Muthén, L., & Muthén, B. (2006). Mplus user’s guide (4th ed.). Los Angeles: Muthén and Muthén.
Najmi, S., & Wegner, D. M. (2008). Thought suppression and psychopathology. In A. J. Elliott (Ed.), Handbook of approach and avoidance motivation (pp. 447–459). New York: Psychology Press.
Palm, K. M., & Strong, D. R. (2007). Using item response theory to examine the White Bear Suppression Inventory. Personality and Individual Differences, 42, 87–98.
Purdon, C. (2004). Empirical investigations of thought suppression in OCD. Journal of Behavior Therapy and Experimental Psychiatry, 35, 121–136.
Purdon, C., Rowa, K., & Antony, M. M. (2007). Diary records of thought suppression by individuals with obsessive– compulsive disorder. Behavioural and Cognitive Psychotherapy, 35, 47–59.
Rachman, S., & Hodgson, R. J. (1980). Obsessions and compulsions. Englewood Cliffs, NJ: Prentice Hall.
Rafnsson, F. D., & Smari, J. (2001). Chronic thought suppression and obsessionality: The relationships between the White Bear Suppression Inventory and two inventories of obsessive–compulsive symptoms. Personality and Individual Differences, 30, 159–165.
Rassin, E. (2003). The White Bear Suppression Inventory (WBSI) focuses on failing suppression attempts. European Journal of Personality, 17, 285–298.
Rassin, E. (2005). Thought suppression. Oxford, England: Elsevier.
Reise, S. P., Ainsworth, A. T., & Haviland, M. G. (2005). Item response theory: Fundamentals, applications, and promise in psychological research. Current Directions in Psychological Science, 14, 95–101.
Rost, J., & von Davier, M. (1994). A conditional item fit index for Rasch models. Applied Psychological Measurement, 18, 171–182.
Spielberger, C. D., Gorsuch, R. L., & Lushene, R. E. (1970). Manual for the state-trait anxiety inventory (STAI). Palo Alto, CA: Consulting Psychologists Press.
Spielberger, C. D., Gorsuch, R. L., Lushene, R., Vagg, P. R., & Jacobs, G. A. (1993). Manuel de l’inventaire d’Anxiété état-trait: Form Y (STAI–Y) [Manual for the State–Trait Anxiety Inventory STAI (Form Y)] (M. Bruchon- Schweitzer & I. Paulhan, Trans.). Paris: Editions du Centre de Psychologie Appliquée.
Spinhoven, P., & van der Does, A. J. W. (1999). Thought suppression, dissociation and psychopathology. Personality and Individual Differences, 27, 877–886.
Velicer, W. F. (1976). Determining the number of components from the matrix of partial correlations. Psychometrika, 41, 321–327.
Wegner, D. M. (1994). Ironic processes of mental control. Psychological Review, 101, 34–52.
Wegner, D. M., Schneider, D. J., Carter, S. R., III, & White, T. L. (1987). Paradoxical effects of thought suppression. Journal of Personality and Social Psychology, 53, 5–13.
Wegner, D. M., & Zanakos, S. (1994). Chronic thought suppression. Journal of Personality, 62, 615–640.
Wells, A., & Davies, M. I. (1994). The Thought Control Questionnaire: A mea- sure of individual differences in the control of unwanted thoughts. Behaviour Research and Therapy, 32, 871–878