IFAC PapersOnLine 51-27 (2018) 74–79
ScienceDirect
Available online at www.sciencedirect.com
2405-8963 © 2018, IFAC (International Federation of Automatic Control) Hosting by Elsevier Ltd. All rights reserved. Peer review under responsibility of International Federation of Automatic Control.
10.1016/j.ifacol.2018.11.664
Accurate dicrotic notch detection using
adaptive shear transforms
Joel Balmer∗ Christopher Pretty∗ Alexander Amies∗ Thomas Desaive∗∗ J. Geoffrey Chase∗
∗Department of Mechanical Engineering, University of Canterbury, New Zealand (email: [email protected]). ∗∗GIGA Cardiovascular Science, University of Li`ege, Li`ege, Belgium
(email: [email protected])
Abstract: Dicrotic notch detection in aortic pressure waveforms enables a reference in time, marking the transition from systole to diastole. Identification of the notch is useful in applications studying events specific to systole or diastole, for example, models that estimate cardiac function, and systolic time intervals such as left ventricular ejection time. The purpose of this study was to test a new dicrotic notch detection algorithm, against an existing end systole estimation method. The new algorithm utilises a shear transform, which is adaptive based on the shape of the aortic pressure waveform. To assess the accuracy of the two algorithms, 80 beats aortic pressure waveforms were used from four porcine pigs. The pigs were subjected to hemodynamic modification in order to test the algorithms on different waveforms shapes. The dicrotic notches were first found by eye in the 80 beats waveforms, and systolic time, from the start of the beat to the dicrotic notch, was the metric used to compare the accuracy of dicrotic notch locations. The new algorithm identifies features of the dicrotic notch when it is present and estimates the location when it is less clear, better than the existing method of end systole estimation. This result was evident in the mean difference between measured and estimated systolic times of 0.5ms vs 11.6ms, for the new algorithm and existing respectively. The new method also showed significantly less variation in its estimate than the existing method, across all pigs’ hemodynamic states.
Keywords: Biomedical systems, Bio-signals analysis and interpretation, Dicrotic notch, End systole, Start diastole, Cardiovascular system.
1. INTRODUCTION
The dicrotic notch is a distinct stationary point in prox-imal arterial (often aortic) pressure signals, following the maximum pressure in a beat waveform. It may be a point of inflection with (approximately) zero gradient, or a combination of two turning points with respective local minimum and maximum.
The dicrotic notch is formed by the reflection of a wave off of the aortic valve, following valve closure (Lewis, 1906). Thus, it is clearest in proximal pressure signals and crucial for determining transition from systole to diastole in aortic pressure waveforms (Oppenheim and Sittig, 1995). Specifically, aortic systolic time, associated with left ventricular ejection, lasts from the foot of the aortic pressure wave to the dicrotic notch (Talley et al., 1971; Payne, 2006; Marik, 2013). Diastolic time, associated with aortic relaxation, is the remaining time from the dicrotic notch to the next pressure waveform foot.
Given the notches physical significance as a systolic/diastolic time reference, it has been used in numerous applications (e.g. pulse wave velocity calculations (Hermeling et al., 2009), models estimating cardiovascular function (Steven-son et al., 2010, 2012b), and left ventricular ejection time).
Kamoi et al. (2017) presented a pressure contour analysis method to estimate stroke volume. It is sensitive to the identification of end systole, and thus the dicrotic notch. This study presents an improved method of estimating the systolic time interval over Kamoi et al. (2017), whose method did not find end systole as the dicrotic notch, but approximates it as the minimum rate of change in pressure with respect to time (min dP/dt), in the region the dicrotic notch should exist.
2. METHODS 2.1 Porcine trials and measurements
Data in this study was provided by pig experiments at the Centre Hospitalier Universitaire de Li`ege, Belgium. Ethics approval for the experimental procedures, protocols and use of the data was provided by the Ethics Committee of the University of Li`ege Medical Faculty.
Seven pure pietrain pigs weighing 20-29kg were used in the experiments, but only Pigs 2, 3, 6 and 7 are analysed. The other pigs were excluded due to differences in experi-mental protocol and in some places abnormalities in cap-tured data. Pigs were administered ketamine (20 mg/kg) and diazepam (1 mg/kg) prior to the experiment. Anaes-thesia was induced and maintained by continuous infu-10th IFAC Symposium on Biological and Medical Systems
São Paulo, Brazil, September 3-5, 2018
Copyright © 2018 IFAC 74
© 2018, IFAC (International Federation of Automatic Control) Hosting by Elsevier Ltd. All rights reserved.
10.1016/j.ifacol.2018.11.664 2405-8963
Accurate dicrotic notch detection using
adaptive shear transforms
Joel Balmer∗ Christopher Pretty∗ Alexander Amies∗ Thomas Desaive∗∗ J. Geoffrey Chase∗
∗Department of Mechanical Engineering, University of Canterbury, New Zealand (email: [email protected]). ∗∗GIGA Cardiovascular Science, University of Li`ege, Li`ege, Belgium
(email: [email protected])
Abstract: Dicrotic notch detection in aortic pressure waveforms enables a reference in time, marking the transition from systole to diastole. Identification of the notch is useful in applications studying events specific to systole or diastole, for example, models that estimate cardiac function, and systolic time intervals such as left ventricular ejection time. The purpose of this study was to test a new dicrotic notch detection algorithm, against an existing end systole estimation method. The new algorithm utilises a shear transform, which is adaptive based on the shape of the aortic pressure waveform. To assess the accuracy of the two algorithms, 80 beats aortic pressure waveforms were used from four porcine pigs. The pigs were subjected to hemodynamic modification in order to test the algorithms on different waveforms shapes. The dicrotic notches were first found by eye in the 80 beats waveforms, and systolic time, from the start of the beat to the dicrotic notch, was the metric used to compare the accuracy of dicrotic notch locations. The new algorithm identifies features of the dicrotic notch when it is present and estimates the location when it is less clear, better than the existing method of end systole estimation. This result was evident in the mean difference between measured and estimated systolic times of 0.5ms vs 11.6ms, for the new algorithm and existing respectively. The new method also showed significantly less variation in its estimate than the existing method, across all pigs’ hemodynamic states.
Keywords: Biomedical systems, Bio-signals analysis and interpretation, Dicrotic notch, End systole, Start diastole, Cardiovascular system.
1. INTRODUCTION
The dicrotic notch is a distinct stationary point in prox-imal arterial (often aortic) pressure signals, following the maximum pressure in a beat waveform. It may be a point of inflection with (approximately) zero gradient, or a combination of two turning points with respective local minimum and maximum.
The dicrotic notch is formed by the reflection of a wave off of the aortic valve, following valve closure (Lewis, 1906). Thus, it is clearest in proximal pressure signals and crucial for determining transition from systole to diastole in aortic pressure waveforms (Oppenheim and Sittig, 1995). Specifically, aortic systolic time, associated with left ventricular ejection, lasts from the foot of the aortic pressure wave to the dicrotic notch (Talley et al., 1971; Payne, 2006; Marik, 2013). Diastolic time, associated with aortic relaxation, is the remaining time from the dicrotic notch to the next pressure waveform foot.
Given the notches physical significance as a systolic/diastolic time reference, it has been used in numerous applications (e.g. pulse wave velocity calculations (Hermeling et al., 2009), models estimating cardiovascular function (Steven-son et al., 2010, 2012b), and left ventricular ejection time).
Kamoi et al. (2017) presented a pressure contour analysis method to estimate stroke volume. It is sensitive to the identification of end systole, and thus the dicrotic notch. This study presents an improved method of estimating the systolic time interval over Kamoi et al. (2017), whose method did not find end systole as the dicrotic notch, but approximates it as the minimum rate of change in pressure with respect to time (min dP/dt), in the region the dicrotic notch should exist.
2. METHODS 2.1 Porcine trials and measurements
Data in this study was provided by pig experiments at the Centre Hospitalier Universitaire de Li`ege, Belgium. Ethics approval for the experimental procedures, protocols and use of the data was provided by the Ethics Committee of the University of Li`ege Medical Faculty.
Seven pure pietrain pigs weighing 20-29kg were used in the experiments, but only Pigs 2, 3, 6 and 7 are analysed. The other pigs were excluded due to differences in experi-mental protocol and in some places abnormalities in cap-tured data. Pigs were administered ketamine (20 mg/kg) and diazepam (1 mg/kg) prior to the experiment. Anaes-thesia was induced and maintained by continuous infu-10th IFAC Symposium on Biological and Medical Systems
São Paulo, Brazil, September 3-5, 2018
Copyright © 2018 IFAC 74
Accurate dicrotic notch detection using
adaptive shear transforms
Joel Balmer∗ Christopher Pretty∗ Alexander Amies∗ Thomas Desaive∗∗ J. Geoffrey Chase∗
∗Department of Mechanical Engineering, University of Canterbury, New Zealand (email: [email protected]). ∗∗GIGA Cardiovascular Science, University of Li`ege, Li`ege, Belgium
(email: [email protected])
Abstract: Dicrotic notch detection in aortic pressure waveforms enables a reference in time, marking the transition from systole to diastole. Identification of the notch is useful in applications studying events specific to systole or diastole, for example, models that estimate cardiac function, and systolic time intervals such as left ventricular ejection time. The purpose of this study was to test a new dicrotic notch detection algorithm, against an existing end systole estimation method. The new algorithm utilises a shear transform, which is adaptive based on the shape of the aortic pressure waveform. To assess the accuracy of the two algorithms, 80 beats aortic pressure waveforms were used from four porcine pigs. The pigs were subjected to hemodynamic modification in order to test the algorithms on different waveforms shapes. The dicrotic notches were first found by eye in the 80 beats waveforms, and systolic time, from the start of the beat to the dicrotic notch, was the metric used to compare the accuracy of dicrotic notch locations. The new algorithm identifies features of the dicrotic notch when it is present and estimates the location when it is less clear, better than the existing method of end systole estimation. This result was evident in the mean difference between measured and estimated systolic times of 0.5ms vs 11.6ms, for the new algorithm and existing respectively. The new method also showed significantly less variation in its estimate than the existing method, across all pigs’ hemodynamic states.
Keywords: Biomedical systems, Bio-signals analysis and interpretation, Dicrotic notch, End systole, Start diastole, Cardiovascular system.
1. INTRODUCTION
The dicrotic notch is a distinct stationary point in prox-imal arterial (often aortic) pressure signals, following the maximum pressure in a beat waveform. It may be a point of inflection with (approximately) zero gradient, or a combination of two turning points with respective local minimum and maximum.
The dicrotic notch is formed by the reflection of a wave off of the aortic valve, following valve closure (Lewis, 1906). Thus, it is clearest in proximal pressure signals and crucial for determining transition from systole to diastole in aortic pressure waveforms (Oppenheim and Sittig, 1995). Specifically, aortic systolic time, associated with left ventricular ejection, lasts from the foot of the aortic pressure wave to the dicrotic notch (Talley et al., 1971; Payne, 2006; Marik, 2013). Diastolic time, associated with aortic relaxation, is the remaining time from the dicrotic notch to the next pressure waveform foot.
Given the notches physical significance as a systolic/diastolic time reference, it has been used in numerous applications (e.g. pulse wave velocity calculations (Hermeling et al., 2009), models estimating cardiovascular function (Steven-son et al., 2010, 2012b), and left ventricular ejection time).
Kamoi et al. (2017) presented a pressure contour analysis method to estimate stroke volume. It is sensitive to the identification of end systole, and thus the dicrotic notch. This study presents an improved method of estimating the systolic time interval over Kamoi et al. (2017), whose method did not find end systole as the dicrotic notch, but approximates it as the minimum rate of change in pressure with respect to time (min dP/dt), in the region the dicrotic notch should exist.
2. METHODS 2.1 Porcine trials and measurements
Data in this study was provided by pig experiments at the Centre Hospitalier Universitaire de Li`ege, Belgium. Ethics approval for the experimental procedures, protocols and use of the data was provided by the Ethics Committee of the University of Li`ege Medical Faculty.
Seven pure pietrain pigs weighing 20-29kg were used in the experiments, but only Pigs 2, 3, 6 and 7 are analysed. The other pigs were excluded due to differences in experi-mental protocol and in some places abnormalities in cap-tured data. Pigs were administered ketamine (20 mg/kg) and diazepam (1 mg/kg) prior to the experiment. Anaes-thesia was induced and maintained by continuous infu-10th IFAC Symposium on Biological and Medical Systems
São Paulo, Brazil, September 3-5, 2018
Accurate dicrotic notch detection using
adaptive shear transforms
Joel Balmer∗ Christopher Pretty∗ Alexander Amies∗ Thomas Desaive∗∗ J. Geoffrey Chase∗
∗Department of Mechanical Engineering, University of Canterbury, New Zealand (email: [email protected]). ∗∗GIGA Cardiovascular Science, University of Li`ege, Li`ege, Belgium
(email: [email protected])
Abstract: Dicrotic notch detection in aortic pressure waveforms enables a reference in time, marking the transition from systole to diastole. Identification of the notch is useful in applications studying events specific to systole or diastole, for example, models that estimate cardiac function, and systolic time intervals such as left ventricular ejection time. The purpose of this study was to test a new dicrotic notch detection algorithm, against an existing end systole estimation method. The new algorithm utilises a shear transform, which is adaptive based on the shape of the aortic pressure waveform. To assess the accuracy of the two algorithms, 80 beats aortic pressure waveforms were used from four porcine pigs. The pigs were subjected to hemodynamic modification in order to test the algorithms on different waveforms shapes. The dicrotic notches were first found by eye in the 80 beats waveforms, and systolic time, from the start of the beat to the dicrotic notch, was the metric used to compare the accuracy of dicrotic notch locations. The new algorithm identifies features of the dicrotic notch when it is present and estimates the location when it is less clear, better than the existing method of end systole estimation. This result was evident in the mean difference between measured and estimated systolic times of 0.5ms vs 11.6ms, for the new algorithm and existing respectively. The new method also showed significantly less variation in its estimate than the existing method, across all pigs’ hemodynamic states.
Keywords: Biomedical systems, Bio-signals analysis and interpretation, Dicrotic notch, End systole, Start diastole, Cardiovascular system.
1. INTRODUCTION
The dicrotic notch is a distinct stationary point in prox-imal arterial (often aortic) pressure signals, following the maximum pressure in a beat waveform. It may be a point of inflection with (approximately) zero gradient, or a combination of two turning points with respective local minimum and maximum.
The dicrotic notch is formed by the reflection of a wave off of the aortic valve, following valve closure (Lewis, 1906). Thus, it is clearest in proximal pressure signals and crucial for determining transition from systole to diastole in aortic pressure waveforms (Oppenheim and Sittig, 1995). Specifically, aortic systolic time, associated with left ventricular ejection, lasts from the foot of the aortic pressure wave to the dicrotic notch (Talley et al., 1971; Payne, 2006; Marik, 2013). Diastolic time, associated with aortic relaxation, is the remaining time from the dicrotic notch to the next pressure waveform foot.
Given the notches physical significance as a systolic/diastolic time reference, it has been used in numerous applications (e.g. pulse wave velocity calculations (Hermeling et al., 2009), models estimating cardiovascular function (Steven-son et al., 2010, 2012b), and left ventricular ejection time).
Kamoi et al. (2017) presented a pressure contour analysis method to estimate stroke volume. It is sensitive to the identification of end systole, and thus the dicrotic notch. This study presents an improved method of estimating the systolic time interval over Kamoi et al. (2017), whose method did not find end systole as the dicrotic notch, but approximates it as the minimum rate of change in pressure with respect to time (min dP/dt), in the region the dicrotic notch should exist.
2. METHODS 2.1 Porcine trials and measurements
Data in this study was provided by pig experiments at the Centre Hospitalier Universitaire de Li`ege, Belgium. Ethics approval for the experimental procedures, protocols and use of the data was provided by the Ethics Committee of the University of Li`ege Medical Faculty.
Seven pure pietrain pigs weighing 20-29kg were used in the experiments, but only Pigs 2, 3, 6 and 7 are analysed. The other pigs were excluded due to differences in experi-mental protocol and in some places abnormalities in cap-tured data. Pigs were administered ketamine (20 mg/kg) and diazepam (1 mg/kg) prior to the experiment. Anaes-thesia was induced and maintained by continuous
infu-Copyright © 2018 IFAC 74
Accurate dicrotic notch detection using
adaptive shear transforms
Joel Balmer∗ Christopher Pretty∗ Alexander Amies∗ Thomas Desaive∗∗ J. Geoffrey Chase∗
∗Department of Mechanical Engineering, University of Canterbury, New Zealand (email: [email protected]). ∗∗GIGA Cardiovascular Science, University of Li`ege, Li`ege, Belgium
(email: [email protected])
Abstract: Dicrotic notch detection in aortic pressure waveforms enables a reference in time, marking the transition from systole to diastole. Identification of the notch is useful in applications studying events specific to systole or diastole, for example, models that estimate cardiac function, and systolic time intervals such as left ventricular ejection time. The purpose of this study was to test a new dicrotic notch detection algorithm, against an existing end systole estimation method. The new algorithm utilises a shear transform, which is adaptive based on the shape of the aortic pressure waveform. To assess the accuracy of the two algorithms, 80 beats aortic pressure waveforms were used from four porcine pigs. The pigs were subjected to hemodynamic modification in order to test the algorithms on different waveforms shapes. The dicrotic notches were first found by eye in the 80 beats waveforms, and systolic time, from the start of the beat to the dicrotic notch, was the metric used to compare the accuracy of dicrotic notch locations. The new algorithm identifies features of the dicrotic notch when it is present and estimates the location when it is less clear, better than the existing method of end systole estimation. This result was evident in the mean difference between measured and estimated systolic times of 0.5ms vs 11.6ms, for the new algorithm and existing respectively. The new method also showed significantly less variation in its estimate than the existing method, across all pigs’ hemodynamic states.
Keywords: Biomedical systems, Bio-signals analysis and interpretation, Dicrotic notch, End systole, Start diastole, Cardiovascular system.
1. INTRODUCTION
The dicrotic notch is a distinct stationary point in prox-imal arterial (often aortic) pressure signals, following the maximum pressure in a beat waveform. It may be a point of inflection with (approximately) zero gradient, or a combination of two turning points with respective local minimum and maximum.
The dicrotic notch is formed by the reflection of a wave off of the aortic valve, following valve closure (Lewis, 1906). Thus, it is clearest in proximal pressure signals and crucial for determining transition from systole to diastole in aortic pressure waveforms (Oppenheim and Sittig, 1995). Specifically, aortic systolic time, associated with left ventricular ejection, lasts from the foot of the aortic pressure wave to the dicrotic notch (Talley et al., 1971; Payne, 2006; Marik, 2013). Diastolic time, associated with aortic relaxation, is the remaining time from the dicrotic notch to the next pressure waveform foot.
Given the notches physical significance as a systolic/diastolic time reference, it has been used in numerous applications (e.g. pulse wave velocity calculations (Hermeling et al., 2009), models estimating cardiovascular function (Steven-son et al., 2010, 2012b), and left ventricular ejection time).
Kamoi et al. (2017) presented a pressure contour analysis method to estimate stroke volume. It is sensitive to the identification of end systole, and thus the dicrotic notch. This study presents an improved method of estimating the systolic time interval over Kamoi et al. (2017), whose method did not find end systole as the dicrotic notch, but approximates it as the minimum rate of change in pressure with respect to time (min dP/dt), in the region the dicrotic notch should exist.
2. METHODS 2.1 Porcine trials and measurements
Data in this study was provided by pig experiments at the Centre Hospitalier Universitaire de Li`ege, Belgium. Ethics approval for the experimental procedures, protocols and use of the data was provided by the Ethics Committee of the University of Li`ege Medical Faculty.
Seven pure pietrain pigs weighing 20-29kg were used in the experiments, but only Pigs 2, 3, 6 and 7 are analysed. The other pigs were excluded due to differences in experi-mental protocol and in some places abnormalities in cap-tured data. Pigs were administered ketamine (20 mg/kg) and diazepam (1 mg/kg) prior to the experiment. Anaes-thesia was induced and maintained by continuous
infu-Accurate dicrotic notch detection using
adaptive shear transforms
Joel Balmer∗ Christopher Pretty∗ Alexander Amies∗ Thomas Desaive∗∗ J. Geoffrey Chase∗
∗Department of Mechanical Engineering, University of Canterbury, New Zealand (email: [email protected]). ∗∗GIGA Cardiovascular Science, University of Li`ege, Li`ege, Belgium
(email: [email protected])
Abstract: Dicrotic notch detection in aortic pressure waveforms enables a reference in time, marking the transition from systole to diastole. Identification of the notch is useful in applications studying events specific to systole or diastole, for example, models that estimate cardiac function, and systolic time intervals such as left ventricular ejection time. The purpose of this study was to test a new dicrotic notch detection algorithm, against an existing end systole estimation method. The new algorithm utilises a shear transform, which is adaptive based on the shape of the aortic pressure waveform. To assess the accuracy of the two algorithms, 80 beats aortic pressure waveforms were used from four porcine pigs. The pigs were subjected to hemodynamic modification in order to test the algorithms on different waveforms shapes. The dicrotic notches were first found by eye in the 80 beats waveforms, and systolic time, from the start of the beat to the dicrotic notch, was the metric used to compare the accuracy of dicrotic notch locations. The new algorithm identifies features of the dicrotic notch when it is present and estimates the location when it is less clear, better than the existing method of end systole estimation. This result was evident in the mean difference between measured and estimated systolic times of 0.5ms vs 11.6ms, for the new algorithm and existing respectively. The new method also showed significantly less variation in its estimate than the existing method, across all pigs’ hemodynamic states.
Keywords: Biomedical systems, Bio-signals analysis and interpretation, Dicrotic notch, End systole, Start diastole, Cardiovascular system.
1. INTRODUCTION
The dicrotic notch is a distinct stationary point in prox-imal arterial (often aortic) pressure signals, following the maximum pressure in a beat waveform. It may be a point of inflection with (approximately) zero gradient, or a combination of two turning points with respective local minimum and maximum.
The dicrotic notch is formed by the reflection of a wave off of the aortic valve, following valve closure (Lewis, 1906). Thus, it is clearest in proximal pressure signals and crucial for determining transition from systole to diastole in aortic pressure waveforms (Oppenheim and Sittig, 1995). Specifically, aortic systolic time, associated with left ventricular ejection, lasts from the foot of the aortic pressure wave to the dicrotic notch (Talley et al., 1971; Payne, 2006; Marik, 2013). Diastolic time, associated with aortic relaxation, is the remaining time from the dicrotic notch to the next pressure waveform foot.
Given the notches physical significance as a systolic/diastolic time reference, it has been used in numerous applications (e.g. pulse wave velocity calculations (Hermeling et al., 2009), models estimating cardiovascular function (Steven-son et al., 2010, 2012b), and left ventricular ejection time).
Kamoi et al. (2017) presented a pressure contour analysis method to estimate stroke volume. It is sensitive to the identification of end systole, and thus the dicrotic notch. This study presents an improved method of estimating the systolic time interval over Kamoi et al. (2017), whose method did not find end systole as the dicrotic notch, but approximates it as the minimum rate of change in pressure with respect to time (min dP/dt), in the region the dicrotic notch should exist.
2. METHODS 2.1 Porcine trials and measurements
Data in this study was provided by pig experiments at the Centre Hospitalier Universitaire de Li`ege, Belgium. Ethics approval for the experimental procedures, protocols and use of the data was provided by the Ethics Committee of the University of Li`ege Medical Faculty.
Seven pure pietrain pigs weighing 20-29kg were used in the experiments, but only Pigs 2, 3, 6 and 7 are analysed. The other pigs were excluded due to differences in experi-mental protocol and in some places abnormalities in cap-tured data. Pigs were administered ketamine (20 mg/kg) and diazepam (1 mg/kg) prior to the experiment. Anaes-thesia was induced and maintained by continuous
infu-Copyright © 2018 IFAC 74
Accurate dicrotic notch detection using
adaptive shear transforms
Joel Balmer∗ Christopher Pretty∗ Alexander Amies∗ Thomas Desaive∗∗ J. Geoffrey Chase∗
∗Department of Mechanical Engineering, University of Canterbury, New Zealand (email: [email protected]). ∗∗GIGA Cardiovascular Science, University of Li`ege, Li`ege, Belgium
(email: [email protected])
Abstract: Dicrotic notch detection in aortic pressure waveforms enables a reference in time, marking the transition from systole to diastole. Identification of the notch is useful in applications studying events specific to systole or diastole, for example, models that estimate cardiac function, and systolic time intervals such as left ventricular ejection time. The purpose of this study was to test a new dicrotic notch detection algorithm, against an existing end systole estimation method. The new algorithm utilises a shear transform, which is adaptive based on the shape of the aortic pressure waveform. To assess the accuracy of the two algorithms, 80 beats aortic pressure waveforms were used from four porcine pigs. The pigs were subjected to hemodynamic modification in order to test the algorithms on different waveforms shapes. The dicrotic notches were first found by eye in the 80 beats waveforms, and systolic time, from the start of the beat to the dicrotic notch, was the metric used to compare the accuracy of dicrotic notch locations. The new algorithm identifies features of the dicrotic notch when it is present and estimates the location when it is less clear, better than the existing method of end systole estimation. This result was evident in the mean difference between measured and estimated systolic times of 0.5ms vs 11.6ms, for the new algorithm and existing respectively. The new method also showed significantly less variation in its estimate than the existing method, across all pigs’ hemodynamic states.
Keywords: Biomedical systems, Bio-signals analysis and interpretation, Dicrotic notch, End systole, Start diastole, Cardiovascular system.
1. INTRODUCTION
The dicrotic notch is a distinct stationary point in prox-imal arterial (often aortic) pressure signals, following the maximum pressure in a beat waveform. It may be a point of inflection with (approximately) zero gradient, or a combination of two turning points with respective local minimum and maximum.
The dicrotic notch is formed by the reflection of a wave off of the aortic valve, following valve closure (Lewis, 1906). Thus, it is clearest in proximal pressure signals and crucial for determining transition from systole to diastole in aortic pressure waveforms (Oppenheim and Sittig, 1995). Specifically, aortic systolic time, associated with left ventricular ejection, lasts from the foot of the aortic pressure wave to the dicrotic notch (Talley et al., 1971; Payne, 2006; Marik, 2013). Diastolic time, associated with aortic relaxation, is the remaining time from the dicrotic notch to the next pressure waveform foot.
Given the notches physical significance as a systolic/diastolic time reference, it has been used in numerous applications (e.g. pulse wave velocity calculations (Hermeling et al., 2009), models estimating cardiovascular function (Steven-son et al., 2010, 2012b), and left ventricular ejection time).
Kamoi et al. (2017) presented a pressure contour analysis method to estimate stroke volume. It is sensitive to the identification of end systole, and thus the dicrotic notch. This study presents an improved method of estimating the systolic time interval over Kamoi et al. (2017), whose method did not find end systole as the dicrotic notch, but approximates it as the minimum rate of change in pressure with respect to time (min dP/dt), in the region the dicrotic notch should exist.
2. METHODS 2.1 Porcine trials and measurements
Data in this study was provided by pig experiments at the Centre Hospitalier Universitaire de Li`ege, Belgium. Ethics approval for the experimental procedures, protocols and use of the data was provided by the Ethics Committee of the University of Li`ege Medical Faculty.
Seven pure pietrain pigs weighing 20-29kg were used in the experiments, but only Pigs 2, 3, 6 and 7 are analysed. The other pigs were excluded due to differences in experi-mental protocol and in some places abnormalities in cap-tured data. Pigs were administered ketamine (20 mg/kg) and diazepam (1 mg/kg) prior to the experiment. Anaes-thesia was induced and maintained by continuous
infu-Accurate dicrotic notch detection using
adaptive shear transforms
Joel Balmer∗ Christopher Pretty∗ Alexander Amies∗ Thomas Desaive∗∗ J. Geoffrey Chase∗
∗Department of Mechanical Engineering, University of Canterbury, New Zealand (email: [email protected]). ∗∗GIGA Cardiovascular Science, University of Li`ege, Li`ege, Belgium
(email: [email protected])
Abstract: Dicrotic notch detection in aortic pressure waveforms enables a reference in time, marking the transition from systole to diastole. Identification of the notch is useful in applications studying events specific to systole or diastole, for example, models that estimate cardiac function, and systolic time intervals such as left ventricular ejection time. The purpose of this study was to test a new dicrotic notch detection algorithm, against an existing end systole estimation method. The new algorithm utilises a shear transform, which is adaptive based on the shape of the aortic pressure waveform. To assess the accuracy of the two algorithms, 80 beats aortic pressure waveforms were used from four porcine pigs. The pigs were subjected to hemodynamic modification in order to test the algorithms on different waveforms shapes. The dicrotic notches were first found by eye in the 80 beats waveforms, and systolic time, from the start of the beat to the dicrotic notch, was the metric used to compare the accuracy of dicrotic notch locations. The new algorithm identifies features of the dicrotic notch when it is present and estimates the location when it is less clear, better than the existing method of end systole estimation. This result was evident in the mean difference between measured and estimated systolic times of 0.5ms vs 11.6ms, for the new algorithm and existing respectively. The new method also showed significantly less variation in its estimate than the existing method, across all pigs’ hemodynamic states.
Keywords: Biomedical systems, Bio-signals analysis and interpretation, Dicrotic notch, End systole, Start diastole, Cardiovascular system.
1. INTRODUCTION
The dicrotic notch is a distinct stationary point in prox-imal arterial (often aortic) pressure signals, following the maximum pressure in a beat waveform. It may be a point of inflection with (approximately) zero gradient, or a combination of two turning points with respective local minimum and maximum.
The dicrotic notch is formed by the reflection of a wave off of the aortic valve, following valve closure (Lewis, 1906). Thus, it is clearest in proximal pressure signals and crucial for determining transition from systole to diastole in aortic pressure waveforms (Oppenheim and Sittig, 1995). Specifically, aortic systolic time, associated with left ventricular ejection, lasts from the foot of the aortic pressure wave to the dicrotic notch (Talley et al., 1971; Payne, 2006; Marik, 2013). Diastolic time, associated with aortic relaxation, is the remaining time from the dicrotic notch to the next pressure waveform foot.
Given the notches physical significance as a systolic/diastolic time reference, it has been used in numerous applications (e.g. pulse wave velocity calculations (Hermeling et al., 2009), models estimating cardiovascular function (Steven-son et al., 2010, 2012b), and left ventricular ejection time).
Kamoi et al. (2017) presented a pressure contour analysis method to estimate stroke volume. It is sensitive to the identification of end systole, and thus the dicrotic notch. This study presents an improved method of estimating the systolic time interval over Kamoi et al. (2017), whose method did not find end systole as the dicrotic notch, but approximates it as the minimum rate of change in pressure with respect to time (min dP/dt), in the region the dicrotic notch should exist.
2. METHODS 2.1 Porcine trials and measurements
Data in this study was provided by pig experiments at the Centre Hospitalier Universitaire de Li`ege, Belgium. Ethics approval for the experimental procedures, protocols and use of the data was provided by the Ethics Committee of the University of Li`ege Medical Faculty.
Seven pure pietrain pigs weighing 20-29kg were used in the experiments, but only Pigs 2, 3, 6 and 7 are analysed. The other pigs were excluded due to differences in experi-mental protocol and in some places abnormalities in cap-tured data. Pigs were administered ketamine (20 mg/kg) and diazepam (1 mg/kg) prior to the experiment. Anaes-thesia was induced and maintained by continuous
infu-Copyright © 2018 IFAC 74
sion of sufentanil (0.5µg/kg/h) and sodium pentobarbital (3 mg/kg). Pigs were intubated via tracheotomy and venti-lated using a Draeger Evita2 ventilator (Draeger, Lubeck, Germany).
Pressure and volume were directly measured in the left ventricle using a 7F micromanometer-tipped admittance catheter (Transonic Sciesense Inc., Ontario, Canada) in-serted into the ventricle through the right carotid artery. Pressure waveform measurements were captured at the aortic arch using 7F pressure catheters (Transonic Sci-esense Inc., Ontario, Canada), inserted via the left carotid artery. All data were sampled at 1000Hz.
2.2 Hemodynamic modification
The original purpose of the experiments was to assess the accuracy of a stroke volume (SV) model (Kamoi et al., 2015). This particular model, like others, depends on accurate detection of the transition from systole to diastole. Thus, the protocols caused changes in SV, as well as significant changes in pressure waveform shape and hence dicrotic notch shape and location.
Specifically, each pig was subjected to several stepwise positive end-expiratory pressure (PEEP) recruitment ma-noeuvres (RM). Increases in PEEP can reduce systemic venous return to the right heart and increase pulmonary resistance. Thus, left ventricle preload decreases, lead-ing to lower arterial pressure (Luecke and Pelosi, 2005). RMs increased PEEP in 5cmH2O steps to a maximum of 15cmH2O for Pig 7 and 20cmH2O for Pigs 2, 3 and 6. Experiments also included multiple fluid bolus administra-tions. Boluses were administered in 180ml steps ranging from 0ml to 720ml/900ml for Pigs 7/2, 3 and 6, respec-tively. They increased the blood volume and consequently increased atrial pressure.
Finally, experiments also involved administering a continu-ous dobutamine infusion to modulate contractility. Dobu-tamine increases contractility of the heart and can also act as a vasodialator (Ruffolo, 1987; Ellender and Skinner, 2008). It is commonly used in clinical settings to increase cardiac output (CO), driven by increased contractility (Ruffolo, 1987; Ellender and Skinner, 2008).
2.3 Data Selection Summary
The data used to test the dicrotic notch detection algo-rithm is taken from two distinct sections of the experiment: the baseline and dobutamine high PEEP stages. The base-line stage was when a pig was at rest following anaesthesia, but before any hemodynamic modifications were applied. Dobutamine high PEEP data was captured during the highest PEEP level of the recruitment manoeuvre that occurred during dobutamine admission. For each pig, from each stage, 10 heart beats were used, leading to a total of 80 beats for the analysis. These two stages were chosen as they represented contrasting hemodynamic states, causing significant change in the aortic pressure waveform.
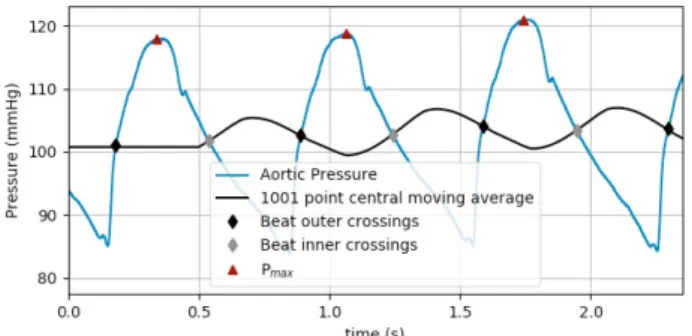
2.4 Beat separation and manual dicrotic notch identification Before dicrotic notch identification began, the start and end point were found for each beat. The feet of each
wave-form were found using an established algorithm discussed in detail elsewhere (Balmer et al., 2017).
To measure the accuracy of the dicrotic notch detection algorithm, the definitive dicrotic notch locations must be known. Since there is no gold standard algorithm, the best comparison is to locations chosen by trained eye, from the discrete aortic pressure signal. Therefore, points were found manually prior to the algorithm estimates. To aid in selection, the ventricular pressure waveform could be plotted with the aortic pressure signal, since after aortic valve closure, different ventricular and aortic relaxation rates lead to the divergence of the two pressure signals. This divergence served as a secondary reference for the notch location. The primary identifier being the turning point or point of inflection in the signal, following a beats maximum pressure.
2.5 Shear transform algorithm implementation
The dicrotic notch detection algorithm utilizes a shear transform. The shear line start (SP ) and end points (EP ), and hence gradient, are adaptive and dependent on a waveforms shape.
Both the SP and EP have separate rationales for being iterable. The aim for SP is for it to reside in the region of consistent negative pressure gradient, following the peak in the pulse pressure but prior to the dicrotic notch. EP on the other hand, is used to ensure the shear line is quasi-parallel over the region the dicrotic notch is expected to reside.
The process is as follows:
Shear line start point calculation
(1) Identify the maximum pressure in a beat (Pmax) (example algorithm in Appendix A).
(2) Identify the point on the pressure waveform with the maximum negative (ie the minimum) gradient in a region following the Pmaxand up to a 1/3 of the time from Pmax to the foot of the waveform. This point is labelled P(min dP/dt).
(3) Identify the point whose pressure value is halfway between Pmaxand P(min dP/dt)as the shear line start point (SP ).
(4) Identify an initial shear line end point (EP ), being a certain time between SP and the end of the current beat, based on Pmax:
• If Pmax < 100mmHg: initial EP is 3/4 of the way from SP to end of beat.
• If 100mmHg < Pmax< 140mmHg: initial EP is 1/2 of the way from SP to end of beat.
• If Pmax > 140mmHg: initial EP is 1/3 of the way from SP to end of beat.
(5) Construct the shear line over the section of pressure signal between SP and EP . Calculate the shear transform (Stevenson et al., 2012a) from the section of pressure signal to the shear line and:
• If more than 50% of the shear transform is greater than zero, i.e. if more than 50% of the shear line is below the corresponding pressure section, assume the shear line start point was poorly identified and return to step 2, using the next most minimum gradient point to find a new SP .
76 Joel Balmer et al. / IFAC PapersOnLine 51-27 (2018) 74–79
• Else, assume SP has been correctly identified and move on to check and possibly update the initial EP .
Shear line end point calculation and dicrotic notch location
EP condition is based on the orthogonal distance from points on the shear line to points on the pressure waveform: (6) Normalize the shear line and the section of pressure associated with the shear line, in both time and pressure, so that it is scale invariant.
(7) For each point on the normalized shear line, calculate the orthogonal distance to a point on the normalized pressure signal. If any point’s orthogonal distance > a tolerance of 0.3, shift EP closer to SP until orthogonal distance≤ 0.3, at which point assume EP location is adequate.
(8) Re-calculate the shear transform from the section of pressure signal, between the finalised SP and EP points, to the shear line. The point of most negative shear (Pmin shear) is assumed to be a point in the dicrotic notch, but may not be the true minimum. (9) Find the start of diastolic relaxation as the point
of maximum pressure between the point Pmin shear and the end of the beat. If the dicrotic notch is a trough, this will find the local maximum turning point following the trough and is assumed the start of diastolic relaxation.
(10) Search from Pmin shear(inclusive) to the start of dias-tolic relaxation for any points lower than Pmin shear. The lowest of these point is the estimated dicrotic notch. If there are multiple points with equal lowest values, take the middle of the lowest points as the dicrotic notch.
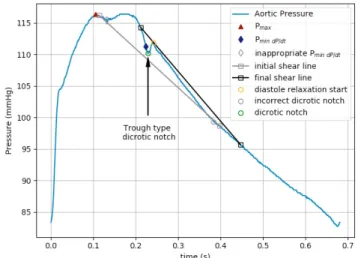
If Pmax and P(min dP/dt) are close together and early enough in time, be it due to unexpected physiology or noise, there is a possibility the constructed shear line in Step 4 will be below the pressure waveform for most of its length. Hence, P(min dP/dt) is iterable, and an example is shown in Figure 1.
EP initial location being later in time for beats with low Pmax values, is simply based on observation of later and lower pressure dicrotic notches (relative to Pmax) in low pressure signals. However, it is possible that if EP is too late in the signal, the shear line has too lower gradient, relative to the signal, which can prove inappropriate for dicrotic notch detection, as shown in Figure 2.
2.6 Analyses
Rather than directly comparing the difference between the algorithmically determined dicrotic notch and its dicrotic notch determined by eye, the systolic time that results from each notch is compared. This is because, as discussed in the Introduction, the dicrotic notch is often found to determine systolic and diastolic time intervals (Talley et al., 1971; Payne, 2006; Marik, 2013). In addition, the shear transform method is compared with the previously published method by Kamoi et al. (2017), which, unlike the shear transform algorithm, relies on a smooth dPao/dt signal (Kamoi et al., 2017).
Fig. 1: The grey shear line misidentifies the dicrotic notch, due to P(min dP/dt) being too close to Pmax. The black shear line shows the iteration of P(min dP/dt), which led to a satisfactory SP and subsequent dicrotic notch detection.
Fig. 2: The grey shear line has too greater orthogonal distance from the pressure waveform, misidentifying the dicrotic notch. The black shear line shows the iteration of EP using the orthogonality condition, and subsequent dicrotic notch detection.
The accuracy of the two algorithmic dicrotic notch de-tection methods (shear transform and Kamoi methods) were then analysed using two formats. Correlation plots show both the individual regression line and coefficient of determination (r2) for each pig and data stage, as well as an overall result. The coefficient of determination, r2, represents the fraction of the total observed variation in the algorithmically estimated systolic time due to the ob-served variation in the measured systolic time. The closer r2is to one, the better the ability of the algorithm to track changes in the measured systolic time.
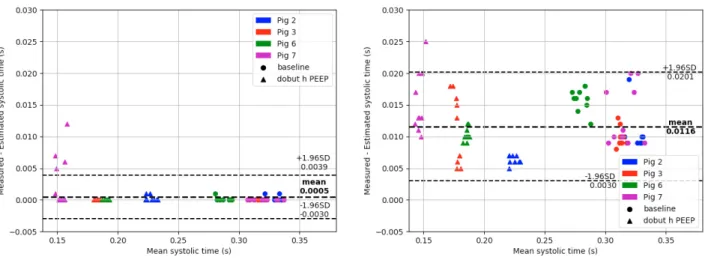
Correlation however, does not imply agreement in the ab-solute sense (Bland and Altman, 1986). Therefore, Bland-Altman analysis was used to assess the agreement be-tween the estimated and measured systolic time, and hence agreement between estimated and measured dicrotic notches locations.
IFAC BMS 2018
São Paulo, Brazil, September 3-5, 2018
• Else, assume SP has been correctly identified and move on to check and possibly update the initial EP .
Shear line end point calculation and dicrotic notch location
EP condition is based on the orthogonal distance from points on the shear line to points on the pressure waveform: (6) Normalize the shear line and the section of pressure associated with the shear line, in both time and pressure, so that it is scale invariant.
(7) For each point on the normalized shear line, calculate the orthogonal distance to a point on the normalized pressure signal. If any point’s orthogonal distance > a tolerance of 0.3, shift EP closer to SP until orthogonal distance≤ 0.3, at which point assume EP location is adequate.
(8) Re-calculate the shear transform from the section of pressure signal, between the finalised SP and EP points, to the shear line. The point of most negative shear (Pmin shear) is assumed to be a point in the dicrotic notch, but may not be the true minimum. (9) Find the start of diastolic relaxation as the point
of maximum pressure between the point Pmin shear and the end of the beat. If the dicrotic notch is a trough, this will find the local maximum turning point following the trough and is assumed the start of diastolic relaxation.
(10) Search from Pmin shear(inclusive) to the start of dias-tolic relaxation for any points lower than Pmin shear. The lowest of these point is the estimated dicrotic notch. If there are multiple points with equal lowest values, take the middle of the lowest points as the dicrotic notch.
If Pmax and P(min dP/dt) are close together and early enough in time, be it due to unexpected physiology or noise, there is a possibility the constructed shear line in Step 4 will be below the pressure waveform for most of its length. Hence, P(min dP/dt) is iterable, and an example is shown in Figure 1.
EP initial location being later in time for beats with low Pmax values, is simply based on observation of later and lower pressure dicrotic notches (relative to Pmax) in low pressure signals. However, it is possible that if EP is too late in the signal, the shear line has too lower gradient, relative to the signal, which can prove inappropriate for dicrotic notch detection, as shown in Figure 2.
2.6 Analyses
Rather than directly comparing the difference between the algorithmically determined dicrotic notch and its dicrotic notch determined by eye, the systolic time that results from each notch is compared. This is because, as discussed in the Introduction, the dicrotic notch is often found to determine systolic and diastolic time intervals (Talley et al., 1971; Payne, 2006; Marik, 2013). In addition, the shear transform method is compared with the previously published method by Kamoi et al. (2017), which, unlike the shear transform algorithm, relies on a smooth dPao/dt signal (Kamoi et al., 2017).
Fig. 1: The grey shear line misidentifies the dicrotic notch, due to P(min dP/dt) being too close to Pmax. The black shear line shows the iteration of P(min dP/dt), which led to a satisfactory SP and subsequent dicrotic notch detection.
Fig. 2: The grey shear line has too greater orthogonal distance from the pressure waveform, misidentifying the dicrotic notch. The black shear line shows the iteration of EP using the orthogonality condition, and subsequent dicrotic notch detection.
The accuracy of the two algorithmic dicrotic notch de-tection methods (shear transform and Kamoi methods) were then analysed using two formats. Correlation plots show both the individual regression line and coefficient of determination (r2) for each pig and data stage, as well as an overall result. The coefficient of determination, r2, represents the fraction of the total observed variation in the algorithmically estimated systolic time due to the ob-served variation in the measured systolic time. The closer r2is to one, the better the ability of the algorithm to track changes in the measured systolic time.
Correlation however, does not imply agreement in the ab-solute sense (Bland and Altman, 1986). Therefore, Bland-Altman analysis was used to assess the agreement be-tween the estimated and measured systolic time, and hence agreement between estimated and measured dicrotic notches locations.
(a) Estimate from shear transform algorithm (b) Estimate from Kamoi method
Fig. 3: Regression Analysis: a) and b) show the overall and individual regression analyses for the pigs, for both the shear line estimated systolic time and Kamoi method estimated systolic time, respectively. Coefficients of determination in the legend were rounded to two decimal places and dobut h PEEP refers to the dobutamine high PEEP data.
(a) Estimate from shear transform algorithm (b) Estimate from Kamoi method
Fig. 4: Bland Altman analysis: Bland Altman plots show the degree of agreement between the estimated and measured systolic times. The mean bias between the measured and estimated systolic times are shown ( ¯d), as well as the limits of agreement ( ¯d± 1.96 × SD) to indicate the expected variation between measure and estimate. Note, dobut h PEEP label is an abbreviation of dobutamine high PEEP.
3. RESULTS & DISCUSSION
Figures 3 show the regression analysis and coefficient of determination. Bland-Altman plots are seen in Figure 4. The plots show improved trending and agreement for the shear transform algorithms over Kamoi’s method. 3.1 Correlation outcomes
Figure 3 (a) & (b) show excellent overall correlations outcomes. However, the overall result alone is misleading, due the clustering of each pig’s individual stage data (Bewick et al., 2003). The difference between the two algorithmic methods’ ability to track changes in systolic time becomes clearer when comparing the coefficients of determination for the individual pigs and stages. In all pigs and stages, the shear transform method of dicrotic notch detection performs better than the Kamoi method,
resulting in coefficients of determination closer to 1.0. The Kamoi method’s ability to track variation in systolic time reduced following hemodynamic modification, from baseline to the dobutamine high PEEP state, which is coupled with a reduction in systolic time. This is evident in the reduced coefficients of determination during dobu-tamine high PEEP stages. With the exception of Pig 7, the shear transform method showed no significant change in performance between hemodynamic states.
The reason for the lower performance of the Kamoi method following the hemodynamic modifications, and for the shear method in Pig 7’s case, appears due to changes in the dicrotic notch shape. Taking Pigs 3 and 7 as examples: Pig’s 3 dicrotic notches, in general became wider during dobutamine high PEEP (≈ 28ms), compared with the baseline stage (≈ 8ms), when measurements were made by eye off of the waveform plots between the widest points