About the photoionization of methyl bromide (CH
3Br). Photoelectron and
photoionization mass spectrometric investigation
R. Locht a, B. Leyh a, D. Dehareng b, K. Hottmann c, H.W. Jochims c, H. Baumgärtel c a
Laboratoire de Dynamique Moléculaire, Département de Chimie, Institut de Chimie, Bât. B6c, Université de Liège,Sart-Tilman par B-4000 Liège 1, Belgium
b
Centre d'Ingéniérie des Protéines, Institut de Chimie, Bât. B6a, Université de Liège, Sart-Tilman par B-4000 Liège 1, Belgique c
Institut für Chemie, Physikalische und Theoretische Chemie, Freie Universität Berlin, Takustraβe 3, D-14195 Berlin, Germany
Abstract
The threshold photoelectron (TPES) and the photoionization mass spectrometric study of CH3Br in the 8-20 eV photon energy range is presented. The interpretation and assignments are supported by ab initio calculations. The TPES shows several new discrete features in the Jahn-Teller split ground state X~2E(2A'-2A") of CH3Br
+
. An additional continuous band starts at about 11.8 eV. These observations are both correlated with direct ionization and autoionizing transitions. This is supported by constant ion state (CIS) spectroscopy. A large enhancement of the transitions to the A2 A and B E states is ascribed to important autoionizing contributions. Based on the present calculations, the weak to very weak bands in the 17.5-22.0 eV photon energy range were mainly assigned to 2a1
-1
ionization and to double excitations described essentially by the 2e-24a1 1
and le-12e-14a1 1
configurations. The photoionization mass spectrometric study allowed us to investigate in detail the ionization and dissociation of CH3Br + leading to CH2 + , CH3 + , Br+ and CH2Br +
from threshold up to 20 eV photon energy. The experimental data are compared to ab initio dissociation energies. At the onset, the CH3
+
and CH2Br +
fragment ion production is correlated with the ground state of CH3Br +
and both fragment ions have to appear through dissociative autoionization from the (3a1
1
/1e3)6s or 5s Rydberg state. This interpretation is supported by the photoabsorption spectrum measured recently in the same photon energy range. At higher energies, beside a likely direct (pre)dissociation of the à 2A1 and B~
2
E states of CH3Br +
, autoionization also contributes to the fragmentation in all decay channels. Avoided crossings in a manifold of 2A' states are likely to be involved. This is supported by ab initio calculations. For CH3
+
the photoion-pair process is analyzed and detailed assignments are proposed on the basis of our latest VUV photoabsorption spectroscopic data.
Keywords: Photoionization mass spectrometry; Threshold photoelectron spectroscopy; Constant ion state spectroscopy; Dissociative ionization; Autoionization; Predissociation; Ion-pair process; Ab initio calculations; Jahn-Teller splitting
1. Introduction
We recently reported a detailed investigation of the vacuum UV photoabsorption spectrum of methyl bromide (CH3Br) and its perdeuterated isotopomer (CD3Br) [1,2]. This study covered the 6-25 eV photon energy range.
As already noticed in the case of methyl chloride, the number of photoionization mass spectrometric investigations of CH3Br is rather limited. They have mainly been restricted to the study of the ionization efficiency of the molecular ion and/or the CH3
+ fragment ion [3]. The production of CH3Br + and CH3 +
were examined by the threshold photoelectron-photoion coincidence (TPEP-ICO) [4] and the high-resolution pulsed field ionization-photoelectron-photoion coincidence (PFI-PEPICO) [5] techniques. In the latter work highly accurate appearance energies were measured and thermochemical quantities deduced.
In a negative-ion mass spectrometric study of the ion-pair formation, the production of X- ions has been investigated in the CH3X (X = F, CI, Br and I) molecules [6]. Owing to the lack of intensity of the photon beam in this experiment, no Br- ions have been detected below the 15 eV photon energy range.
In a photoelectron-photoion coincidence (PEPICO) experiment [7], no coincidences were observed and only the CH3
+
ion kinetic energy distribution was investigated. Speculations on the CH2Br +
ion formation were presented.
The most extensive studies of the ionization and fragmentation of CH3Br were performed by electroionization experiments. To the best of our knowledge, the latest and most complete low energy electron impact investigation has been published by Kaposi et al. [8]. They measured the threshold for the production of all possible fragments except H+ and H2
+
. More recently, a simulated dissociative photoionization study of CH3Br has been reported by Olney et al. [9] using dipole (e,e) electron scattering. This group measured the absolute differential oscillator strength and the branching ratios for dissociative photoionization of CH3Br through all its possible ionized fragmentation pathways from the onset up to 80 eV equivalent photon energy. Threshold energies were measured and were discussed for all detected species.
None of these works analyzed the influence of autoionization on the fragmentation of the CH3Br +
molecular ion. Therefore, we were interested in completing our photoabsorption study by recording and analyzing the photoionization of this molecule, aiming to explore more deeply this aspect of the photofragmentation. The present work reports about the threshold photoelectron spectrum and the dissociative photoionization of CH3Br into its fragments CH2
+ , CH3
+
, Br+ and CH2Br +
as observed between their onset up to about 20 eV photon energy. A few results on constant ion state spectroscopy (CIS) measurements are also reported. To shed light on the present measurements, previous results reported recently on the vacuum UV photoabsorption spectroscopy (PAS) of CH3Br [1,2] will be used all along this paper.
2. Methods
Two distinct experimental setups have been used in this work. They were described elsewhere [10,11] and only the most salient features will be reported here. In all experiments performed in this work we used the vacuum UV light from the synchrotron radiation provided by the electron storage rings BESSY I and BESSY II (Berlin).
2.1. The threshold photoelectron and constant ion state spectroscopy
For these experiments the light is dispersed by a 3-m normal incidence monochromator (on the 3m-NIM-l beam line) equipped with a 2400 1/mm Pt-grating. The entrance and exit slit widths were set at 100 µm. Owing to the second order contribution at low photon energy, a LiF window is used when necessary, restricting the observations to an upper photon energy range of 11.8 eV. The photon energy scale is calibrated with rare gas photoabsorption and/or threshold photoelectron spectra to reach an accuracy of the order of 2-3 meV. These spectra are recorded over a 250 meV energy range with 500-700 µeV steps. The monochromator stepping motor is digitally positioned at the energy of the selected atomic line. The spectrum is scanned again and the reproducibility of the peak maximum position is about 2-3 meV. In the present case Xe has been used for this purpose and the value of the ionization energy IE(Xe+-2P3/2) = 12.130 eV [12] has been adopted.
The light beam is focussed into an ion chamber, in the focussing plane of a tandem electron spectrometer consisting of two 180° electrostatic deflectors. This spectrometer works at constant resolution, i.e., at constant pass energy E0. Its energy resolution, as measured by the full width at half maximum (FWHM) of a rare gas peak, is given by AE/E0= w/4R0 = w/104 where w and R0are the slit widths (in mm) and the radius (in mm) of the sector field. In the present case, slits of 1.0 mm and a pass energy E0 = 1.1 V yield a resolution of about 10 meV. The spectra are normalized to the photon transmission function of the monochromator by measuring the light beam intensity through the photoelectron current of a gold diode inserted in the ion chamber in front of the monochromator exit slit. CIS spectra are recorded with the same instrument and more details on this technique are given elsewhere [11].
2.2. The photoionization mass spectrometry
For the photoionization mass spectrometry (PIMS) experiments the synchrotron radiation is dispersed by an 1.5-m normal incidence monochromator (1m-NIM-2 beamline) which is a modified M-225 McPherson monochromator equipped with a laminar gold-coated Zeiss grating of 1200 1/mm. Entrance and exit slit widths of 100 µm provided 0.1 nm wavelength resolution. Wavelength calibration is performed by recording the Ar+ (2P3/2 -
2
P1/2) ion yield curve and using the Ar +
procedure as described in Section 2.1 has been adopted. The light beam focussed at the center of an ion chamber is detected by a sodium salicylate sensitized photomultiplier fixed in front of the monochromator exit slit. The ions produced in the ion chamber are mass analyzed by a quadrupole mass spectrometer, detected by a channeltron multiplier and recorded by a 100 MHz counter. The ion signal is automatically normalized to the photon flux at all wavelengths.
2.3. Error estimations and data handling
The error estimations on the results presented in this work are the sum of (i) the calibration errors, (ii) the photon energy increments adopted for the signal recording and (iii) the standard deviation resulting from several experiments. The calibration error of 2-3 meV is about the same in all kind of experiments presented in this report. The energy increments vary from 4 meV (in narrow energy range scans) to 15 meV for broad energy range threshold photoelectron spectra. In the former case the total error should be about 5 meV whereas in the latter a total error of about 15 meV is a good estimate. The photoionization efficiency curves were all recorded with photon energy increments of l0 meV and the error is estimated at 20 meV including the error of the extrapolation method used. In the photoabsorption spectra covering the 6-24 eV range [1] an error of 15 meV has also been adopted. The PAS as presented in this work is in fact the result of a subtraction procedure used to enhance the low intensity structures superimposed on a strong background signal. This procedure has already been described previously [1].
2.4. Ab initio calculations
All calculations described in this work were performed with the GAUSSIAN 03 [13] package. For clarity in the forthcoming sections, the molecular configuration of CH3Br in the C3y point group is reminded,
where the la1 and 2a1 are the inner-shell valence orbitals and le, 3a1 and 2e are the outer-valence orbitals. The vertical ionization energies were computed in the CASSCF (complete active space SCF) [14-16] or in the multireference second order perturbational CASSCF/ MP2 [17] levels at the geometry of the neutral molecule optimized at the coupled-cluster frozen core CCSD(FC) level [18]. The basis set used was the correlation-consistent cc-pVTZ basis set of Dunning [19,20]. For the Ã2A1 state the vertical ionization energy is also determined at the CCSD(FC) level.
Two molecular orbitals (MO) active spaces were chosen. The first includes 5 electrons in 7 orbitals, i.e., 3a1, 2e, 4a1, 5a1 and 3e where the last three MO are virtual orbitals and the 2e and 3e are doubly degenerate. The two virtual a1 MOs are energetically important. The second active space had to be extended to the le occupied MO in order to reach deeper ionized states. Consequently, this increased also considerably the number of electronic configurations. To restrict this number one virtual a1 MO has been discarded and the second active space deals with 9 electrons in 8 MOs, i.e., le, 3a1, 2e, 4a1 and 3e. However, this simplification will have an impact on the predicted energies.
The geometrical optimization of each component of the second 2E state was performed at different levels. Despite several attempts, the 2A' state could not be optimized. The 2A" state was optimized at the CASSCF level with an active space of 9 electrons in 6 MOs [CAS(9,6)] and at the configuration interaction level including all monoex-cited configurations (CIS) [21].
The dissociation energies were calculated at the frozen-core correlated second order Møller-Plesset [MP2(FC] [22,23] and coupled-cluster CCSD(FC) levels. The zero-point energy was determined at the MP2(FC) level.
3. Results
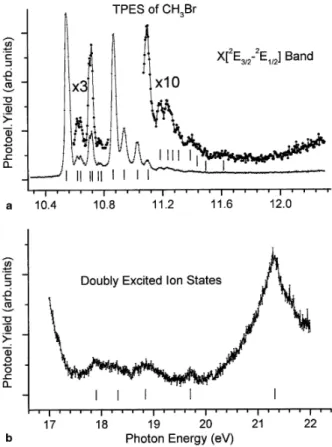
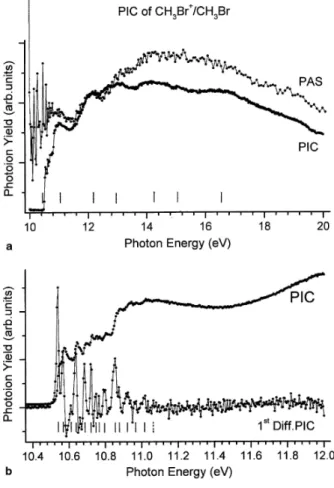
The threshold photoelectron (TPES) of CH3Br has been recorded between 8 and 30 eV photon energy. The optical transmission of the Pt-grating considerably drops above 23 eV. This drastically lowers the signal/noise ratio. Therefore, Fig. 1(a) shows the TPES as recorded between 10 and 22 eV with 10 meV energy increments.
For the most intense part of the spectrum, several ionization energies (marked by vertical bars in Fig. 1) are measured successively at 10.55 ± 0.01, 10.88 ± 0.01, 13.60 ± 0.01, 15.00 ± 0.01 eV with a shoulder at about 15.7 eV. At higher energy very low intensity peaks are observed. To help in the discussion, the differential PAS is displayed in Fig. 1(b) in the same photon energy range. For the procedure providing this PAS see [1]. Let us further remind that in our earlier report [1] several maxima were detected and assigned, i.e., 11.0, 12.1, 13.1, 14.2, 16.1-16.9, 18.2, 19.0, 20.2, 21.6 and 23.1 eV.
Fig. 2(a) shows the first TPES band as recorded between 10.4 and 12.4 eV photon energy, with 4 meV photon energy increments and an analyzer pass-energy of 0.7 V which brings the energy resolution at about 7 meV. The energy position of the fine structures is listed in Table 1, column 2. Fig. 2(b) shows the high energy part of the TPES on an expanded energy scale between 17 and 22 eV photon energy. The intensity of the strongest feature is only 2% of that of the peak at 10.55 eV. The positions of the structures marked by vertical bars, are measured at 17.9, 18.3, 18.8, 19.7 and at 21.3 eV successively.
Fig. 1. (a) The threshold photoelectron spectrum of CH3Br over the 10-23 eV photon energy range. Vertical bars locate vertical ionization energies. (b) The differential photoabsorption spectrum of CH3Br in the same photon energy range. For explanation: see text and [1].
3.2. The mass spectrometric photoionization results At 20 eV photon energy only CH3Br
+ , CH2Br + , Br+, CH3 + and CH2 +
ions are observed in the mass spectrum. The CH3
+
ion is the most abundant species at this energy. Apart from CH3Br +
and CH3 +
, photoionization results related to the other ions are reported for the first time. The photoionization efficiency of CH3+ in the low energy
range (9.0-12.0 eV) is also examined for the first time.
Fig. 2. Details of (a) the first threshold photoelectron (TPES) band and (b) the weak photoelectron bands between 17.0 and 22.0 eV photon energy. Vertical bars indicate critical energies.
3.2.1. The CH3Br +
molecular ion
The photoionization efficiency curve (PIC) of the CH3Br +
molecular ion, as recorded between 10 and 20 eV photon energy, is displayed in Fig. 3(a) together with the PAS as obtained by the treatment described in Section 2.3. Vertical bars locate the maxima of fairly diffuse bands in the photoion yield curve at 11.0, 12.1, 13.1, 14.2, 15.1 and at about 16.5 and 19.0 eV.
The present result, shown in Fig. 3(b), is rather close to the only previously reported photoionization efficiency curve of CH3Br
+
[3]. Fig. 3(b) represents the photoionization efficiency curve of CH3Br +
in the threshold region. Several step-like features and superimposed resonances are clearly visible. To determine the thresholds, the first differentiation of the photoion yield has been calculated numerically. The crude result is shown in Fig. 3(b) and the peak positions are listed in Table 1, column 3.
3.2.2. The CH2Br +
fragment ion
The photoion yield curve of the CH2Br +
fragment ion produced by the dissociative photoionization of CH3Br has been recorded between 10 and 20 eV photon energy. The PIC is reproduced in Fig. 4(a) between 12 and 20 eV. For the CH2Br
+
ion the appearance energy is measured at AE = 12.74 ± b 0.02 eV by the linear extrapolation method applied to the first differentiated ionization efficiency curve as described extensively and used earlier [24,25]. The ionization efficiency curve clearly shows maxima at about 14.2 and 16.2 eV. A close examination of the photoion yield curve in the threshold region would suggest a change of the slope in the ion yield rise at about 13.5 eV.
Fig. 4(b) represents the photoion yield curve of the Br+ fragment ion produced by the dissociative photoionization of CH3Br as measured between 13 and 20 eV photon energy. A very weak, slowly increasing background is observed below 15 eV. This has likely to be ascribed to Br+ ions from Br and/or Br2 produced by photolysis of CH3Br in the photoion source. Indeed, Br2 lines have been detected in the photoabsorption spectrum of CH3Br and CD3Br [2]. The lowest significant threshold measured by the extrapolation method applied to the first derivative is at AE = 15.00 ± 0.05 eV. The ion yield slowly rises up to about 16.2 eV where it levels off up to 17.5 eV. A close examination of the first differential curve clearly shows a slope change at about 15.4 eV. A new continuum starts at an onset of 17.32 ± 0.08 eV. A last step-like feature has a threshold of 18.6 ± 0.2 eV and shows a maximum at 19.4 eV.
Table 1. Convergence limits (eV) of Rydberg series fine structures in the photoabsorption (PAS) [2], threshold photoelectron (TPES), photoionization mass spectrometric (PIMS), constant ion state (CIS) and photoelectron spectroscopic (PES) [31] measurements
PASa [2] TPES, this work PIMS, this work CIS, this work He(I)-PES [31] Assignments [2] and this work 10.543 10.544 10.540 10.560b 10.543 X~2 E3/2(0-0) - - 10.565 10.576 - n.a.c - - - - 10.601 n.a.c 10.611 10.616 10.610 10.614 - υ6 10.648 10.640 10.635 10.645 10.648 υ5 - 10.664 10.660 10.665 - [2υ6] - - 10.685 10.693 - 10.703 10.704 - 10.702 10.703 υ4 - 10.716 10.720 10.711 - [υ5 + υ6] 10.750 10.736 10.750 10.726 10.750 2υ5 or υ4 + υ6 - 10.764 10.765 10.768 - [2υ5] - 10.776 - - - 10.798 - 10.795 10.807 - υ4 + υ5 10.815 - 10.820 - 2υ4 10.862 10.868 10.855 10.862 X~2 E1/2(0-0)/3υ5(3/2) 10.930 10.940 10.920 10.931 2υ4 + υ5 (3/2) 10.972 - 10.965 - 3υ4 (3/2) 11.026 11.024 11.020 11.021 υ4 + 3υ5(3/2)/υ5 + υ6 - 11.032 - - - - 11.065 - n.a.c 11.090 11.092 11.090 2υ5 - 11.110 - [υ4 + υ5] 11.179 11.176 11.179 2υ4 - 11.192 - [υ4+2υ5] 11.220 11.232 11.220 3υ5 - 11.256 - [2υ4 + υ5] 11.290 11.296 - 3υ4 11.354 11.376 - 3υ4 + υ6 11.451 ~11.45 - 4υ4 - 11.490 - [3υ4+2υ5] - ~11.61 - [5υ4]
Square brackets: this work. See text. a
Used as Rydberg series convergence limit (see [2]). b
Threshold for CIS measurement. c n.a.: not assigned.
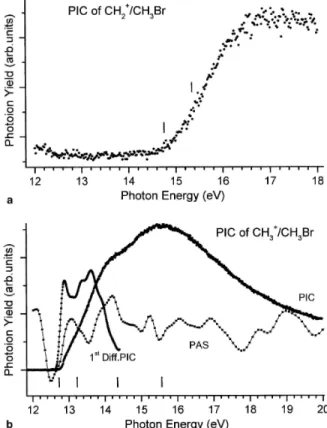
3.2.4. The CH2 +
fragment ion
Despite the signal intensity at m/z =14 representing only about 3% of the total ionization, a photoion yield curve measurement has been attempted for the CH2+ fragment ion. The result is shown in Fig. 5(a) as observed between 12 and 18 eV photon energy. Clearly the sigmoidal ion yield curve has its onset at 14.75 ± 0.05 eV. The photo-ion yield reaches a constant value at about 16.5 eV. A closer examination of the yield curve reveals a slope change at about 15.35 ± 0.10 eV.
Fig. 3. (a) The direct photoion yield curve (PIC) of CH3Br+ and the differential photoabsorption spectrum (PAS) over the 10-20 eV photon energy range. (b) The CH3Br
+
photoion yield curve (PIC) and its derivative (1st Diff.) in the threshold region. Vertical bars indicate critical energies.
3.2.5. The CH3 +
fragment ion
This fragment ion represents about 80% of the total ion yield at 20 eV photon energy. The photoion yield curve of CH3+ is shown in Fig. 5(b) as recorded between 11.5 and 20 eV photon energy. Superimposed to this curve, Fig. 5(b) also shows the PAS in the corresponding photon energy range as well as a slightly smoothed first differentiated ionization efficiency between 11.5 and 15 eV. A very weak contribution of essentially the second order of the grating has been subtracted from the ion signal. From the resulting data, an AE(CH3
+ ) = 12.74 ± 0.02 eV is deduced. A first maximum is measured at 12.85 eV. The first derivative of the PIC clearly shows an onset at 13.22 ± 0.02 eV. Shoulders or maxima corresponding probably to broad resonances are observed at about 14.2 and 15.6 eV.
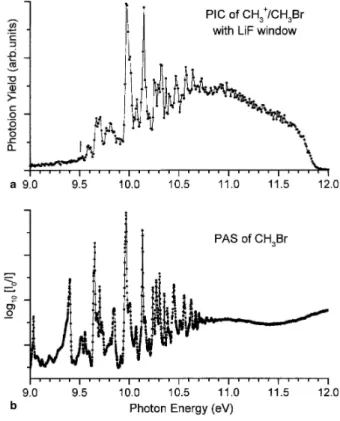
Below 11.5 eV the PIC of CH3 +
exhibits a very weak ion current which has been recorded between 7 and 11.8eV using a LiF filter to cut off second order contributions from the monochromators grating. The result is shown in Fig. 6(a). Table 2 displays the energy position of all the features observed in this curve.
The first resonance structure emerging from the background with signal/noise ratio S/N ~ 2 is observed at 9.29 eV. Taking the usually accepted limit of S/N ≥ 3 we measure AE(CH3
+
/Br-) = 9.51 ± 0.02 eV. A few smaller peaks with S/N ~ 2 (mentioned in square brackets in Table 2) are observed at 9.34, 9.40 and 9.50 eV. Above 9.5 eV, the position of the successive structures is unambiguously measurable.
To help in the following discussion, the above mentioned results about the onset measurements and energy position of other features in the photodissociative ionization yield curves of CH2
+ , CH3
+
, Br+, and CH2Br +
ions are gathered in Table 3 including the measurements on the molecular ion CH3Br +
Fig. 4. Photofragment ion yield curves (PIC) of (a) CH2Br+ and (b) Br+ as measured between 10 and 20 eV photon energy. For the two cases the differential photoabsorption (PAS) curve is displayed in the corresponding photon energy range. Vertical bars indicate critical energies.
.
3.3. The ab initio calculations
The results of the ab initio calculations are summarized in Table 4. Eexc represents the excitation energies. Predicted ionization energies IE could be calculated by adding the calculated excitation energies Eexc to the first IE of 10.535 eV calculated at the CCSD level for the neutral molecule at equilibrium geometry. The present results have to be compared with those obtained by Von Niessen et al. [26] and Olney et al. [27] using many body Green's function (OVGF) [28,29] calculations. Both groups restricted their investigations to the valence shell ionizations. Calculations at the same level but with a cc-pVTZ basis set have also been performed in this work for the direct determinations of vertical ionization energies.
As mentioned earlier in Section 2, the dissociation energy for all measured decay channels has been calculated. These quantities are evaluated with respect to the ground vibronic state of CH3Br
+
(X~2A'). All values are corrected for the zero-point energy (ZPE).
The optimized geometries of the molecular ionized species and neutrals are listed in Table 5. For CH2 +
and CH3+ this table shows small differences with earlier calculations [2,28]. These have to be ascribed to the calculation level which was MP2/631G** [2] instead of the present MP2/ cc-pVTZ and CCSD/cc-pVTZ calculation. At this latter level the ionization of CH3Br is calculated at 10.535 eV with respect to the neutral optimized geometry.
For the decay of CH3Br +
(X~2A') → CH2Br +
(X~1A1+ H ( 2
S) the dissociation energy as calculated at the CCSD level is D0°(H-CH2Br+) = 2.33 eV. Consequently, the predicted appearance energy AE[CH2Br+ (X~2A1)] = 12.865 eV.
For the dissociation pathway CH3Br+ (X~2A') → CH2+ (X~2A1) + HBr (X1 Σ +) the dissociation energy is 3.55 eV. This value leads to AE[CH+ (X~2A1)] = 14.085 eV. In an earlier work [30], the first excited CH2+ (Ã2B1) state was calculated at 0.922 eV (vertical excitation) and the bent-to-linear geometry change barrier was
estimated at 0.163 eV.
Fig. 5. Photoionization efficiency (PIC) curve of (a) CH2+ and (b) CH3+ as measured between 12 and 20 eV. The CH3
+
PIC is displayed together with the slightly smoothed first differentiated (1st Diff.) PIC and the differential photoabsorption (PAS) spectrum of CH3Br in the same energy range. Vertical lines locate critical energies.
For the most important dissociation channel, i.e., CH3Br + (X~2A') → CH3 + (X~lA'1) + Br ( 2 Pu,3/2) a dissociation energy of 2.17 eV (including the ZPE) has been calculated. This value allows us to predict AE[CH3
+
(X~1A1)] = 12.705 eV.
The decay channel leading to the atomic Br+(3P2) ion formation has also been measured. A dissociation energy A)°(CH3-Br+) = 4.05 eV has been calculated. This value provides an appearance energy AE [Br+ (3P2)] = 14.585 eV.
4. Discussion
4.1. The thresholdphotoelectron spectrum (Figs. 1(a) and 2)
Between 9 and 17 eV, most of the bands present in the threshold photoelectron spectrum have been observed by He(I) photoelectron spectroscopy. For comparison we refer to the most accurate and well-resolved He(I) photoelectron spectrum as reported by Karlsson et al. [31]. Besides the first spin-orbit split band at 10.543 ± 0.006 and 10.862 ± 0.006 eV, three broad and structureless peaks are observed starting at 13.0 and 14.5 eV, which correspond to the adiabatic ionization energies. The latter band has a double maximum at 15.0 and 15.7 eV. These features were assigned to the ionization from the 2e, 3a1 and le orbitals, respectively. Both the 2e-1 and the 1e-1 ionizations induce Jahn-Teller distortions. This vibronic coupling has been shown to be small, i.e., about 36 meV in the CH3Br
+
(X~2E) state [2].
energies between the present TPES- and the He(I)-photoelectron spectra as shown in Tables 1 and 3. However, as shown in Fig. 1(a), the threshold photoelectron signal below 13 eV could not be neglected: it slowly decreases down to about 11.6 eV. With respect to the He (I) spectrum, the signal between 11.2 and 13.0 eV is considerably enhanced. Furthermore, the relative intensities of the vibrational fine structure between 10.5 and 11.0 eV as well as of the peaks near 13.6 and 15.0 eV are considerably stronger than in the PES spectrum. In spite of comparable resolution as in ref [31], these two bands are significantly less well separated. The vibrational structure of the
X~2E band is extended to higher energies, i.e., at least up to 11.6 eV (see Fig. 2(a)). All these noticeable differences are likely to be induced by autoionization. Several Rydberg series (see Table 3 and [1]) are known whose autoionization could contribute to increase the ionization cross section of these states. As a support to this, the CIS spectrum of CH3Br
+
(X~2E, υ = 0) has been recorded. It clearly shows the vibrational autoi-onizing contribution to the population of this level (see Table 1, column 4).
Fig. 6. (a) The low-energy part of the photoion yield curve (PIC) of CH3 +
recorded with a LiF window. (b) The photoabsorption spectrum of CH3Br in the same energy range as reported in [1].
The energy positions of the vibrational structures observed in the first TPES band are listed in Table 1, column 2. The assignments (Table 1, column 6) are directly derived from the analysis of the vibrational progressions observed in numerous Rydberg states and which have been presented earlier [2]. For several structures observed neither in the PAS nor in the He(I)-PES, assignments are proposed in this work as based on the results of vacuum UV photoabsorption spectroscopy [2].
In the 17-20 eV range, no ionized states have been reported earlier. However, several TPES measurements unambiguously show weak to very weak intensity signals. Their intensity represents about 1% or less than the first peak at 10.543 eV. Their energy positions are listed in Table 3. The observation of these ionic states are not mentioned in previous He(I) experiments [31] and seem therefore related to the detection of threshold photoelectrons. This would be the case when the photon energy is resonant with the state to be ionized or with neutral states, nearly degenerate with ionized states, which autoionize providing threshold electrons.
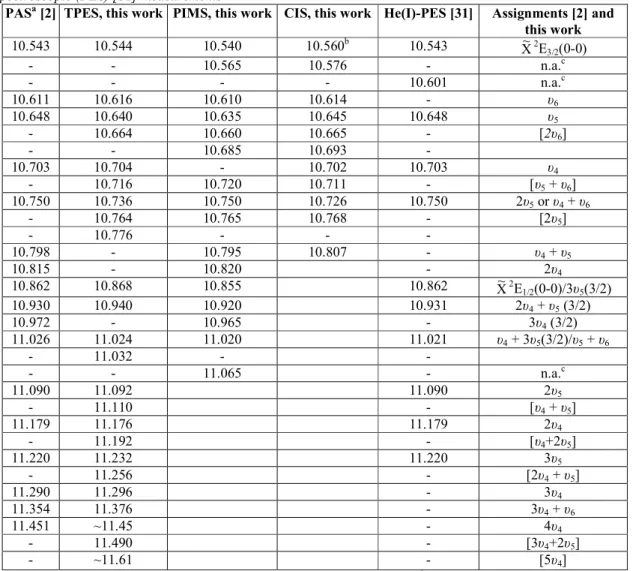
Table 2. Position in energy (eV) of the structures observed in the PAS [1,2] of CH3Br and in the photoion-pair process of CH3
+ + B
r-PASa [1,2] PIPPa This work Assignments [1,2]
9.282 [9.29]b (2E3/2)4f(υ 4 + υ5) 9.372 [9.34]b (2E3/2)4f(3υ5)/ (2E3/2)6pa1(0,0) 9.405 [9.40]b (2E3/2)6pe(0,0) 9.480 [9.50]b (2E3/2)6pa1(υ5) 9.515 9.51 (2E3/2)6pe(υ5) 9.557 - (2E3/2)6pe(υ4) 9.590 9.59 (2E3/2)6pe(υ5 + υ6) 9.659 9.61 (2E3/2)5d(0,0) 9.685 9.67 (2E1/2)6pa1(0,0) 9.706 9.71 (2E3/2)5f(0,0) 9.729 - (2E3/2)5d(υ6) 9.744 - (2E1/2)6pe(0,0) 9.765 9.77 (2E3/2)5d(υ5) 9.784 - (2E3/2)5f(υ6) 9.800 9.81 (2E3/2)5f(υ5) 9.818 (2E3/2)5d(υ4) 9.846 9.90 (2E3/2)7pa1(0,0) 9.975 9.97 (2E1/2)5d(0,0) 10.000 (2E3/2)6f(0,0) 10.008 10.01 10.077 10.08 (2E3/2)8pa1(0,0) 10.139 - (2E3/2)7d(0,0) 10.159 10.15 10.210 10.20 (2E3/2)9pa1(0,0) 10.218 - (2E3/2)9pe(0,0) 10.250 10.25 (2E3/2)8d(0,0) 10.261 - (2E3/2)10sa1(0,0) 10.312 10.32 (2E1/2)8sa1(0,0) 10.358 10.37 (2E3/2) 11ρe(0,0) 10.380 - (2E3/2)10f(0,0) 10.404/10.408 10.40 (2E3/2)13sa1(0,0)/(2E3/2)llf(0,0) 10.435/10.438 - (2E3/2)12f(0,0)/(2E3/2)14pe(0,0) 10.454 10.47 (2E3/2)15pa1(0,0) 10.513 10.53 10.553 10.57 10.616 10.64 (2E1/2)10pa1(0,0) 10.709 - (2E1/2)12pa1(0,0) 10.738 10.73 (2E1/2)13pe(0,0) 10.758 (2E1/2)14pe(0,0) 10.777 (2E1/2)15pe(0,0) 10.828 10.82 10.866 10.86 10.912 10.92 10.995
Assignments resulting from an earlier PAS analysis [1,2] are listed. For the precision on each type of measurement, see text. a
Precision on these measurements: see text.
b Features of the order of magnitude of the background noise level.
Using the He(II) resonance line at 30.4 nm (40.8 eV), beside the already mentioned ionization energies below 21.22 eV, von Niessen et al. [26] reported two ionization energies, i.e., at 21.2 and at 22.0 eV successively. These were both assigned to 2a1
-1
ionization. These assignments were partially supported by quantum mechanical calculations. However, by TPES spectroscopy, beside the broad band peaking at 21.30±0.02 eV, additional features are observed at 17.9, 18.3, 18.8 and 19.7 eV successively. No signal is clearly
identified at 22.0 eV neither in this work nor in the TPES recorded up to 30 eV.
Table 3. Summary of IE, AE and peak maxima measured in the photoionization efficiency curves of the parent and fragment ions produced by photoionization of CH3Br
Ions This work [9] a·b
IE/AE (eV) Peak maxima (eV)a
CH3Br + 10.540 ± 0.015c 10.75 10.855 ± 0.015c 11.0 12.1 13.1 14.2 15.1 16.5 19.1 CH2Br + 12.74 ± 0.02 14.1 16.2 13.75 13.50 ± 0.05 Br+ 15.00 ± 0.05 15.4±0.1 17.32 ± 0.08 18.6 ± 0.2 19.4 18.25 CH2 + 14.75 ± 0.05 15.75 15.4 ± 0.2 CH3 + 9.51 ± 0.02 <10.2 12.74 ± 0.02 12.85 12.75 13.22 ± 0.02 14.2 15.6 PASa 11.0 12.1 13.1 14.2 16.5 18.2 19.0 TPES 10.544 ± 0.005d 13.6 15.0/15.7 17.9 18.3 18.8 10.868 ± 0.005d 19.7 21.3 a
PAS [1 ] and TPES (this work) are reproduced for easiness of the discussion. Only the results of [9] are reproduced for comparison. b
Standard error: ±1.0 eV. c
For more details, see Table 1, column 3. d
For more details, see Table 1, column 2.
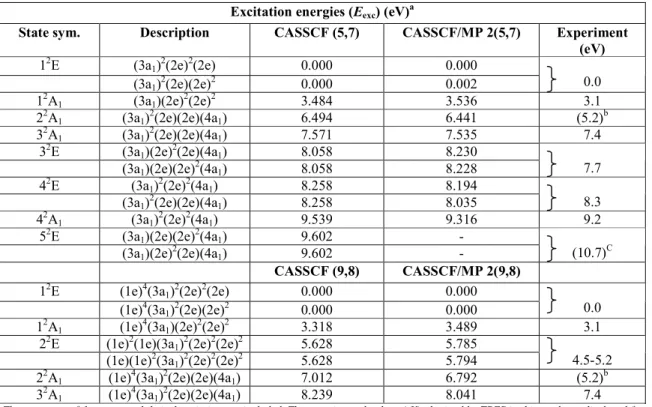
Table 4. Vertical excitation energies Eexc (eV) for CH3Br +
at the CASSCF (5,7), CASSCF (9,8), CASSCF/MP2 (5,7) and CASSCF/MP2 (9,8) levels, obtained at the neutral CCSD (7,6) optimized geometry in the C3v point group
Excitation energies (Eexc) (eV) a
State sym. Description CASSCF (5,7) CASSCF/MP 2(5,7) Experiment
(eV) 12E (3a1) 2 (2e)2(2e) 0.000 0.000 (3a1) 2 (2e)(2e)2 0.000 0.002 0.0 12A1 (3a1)(2e) 2 (2e)2 3.484 3.536 3.1 22A1 (3a1) 2 (2e)(2e)(4a1) 6.494 6.441 (5.2) b 32A1 (3a1) 2 (2e)(2e)(4a1) 7.571 7.535 7.4 32E (3a1)(2e) 2 (2e)(4a1) 8.058 8.230 (3a1)(2e)(2e) 2 (4a1) 8.058 8.228 7.7
42E (3a1)2(2e)2(4a1) 8.258 8.194
(3a1)2(2e)(2e)(4a1) 8.258 8.035 8.3
42A1 (3a1)2(2e)2(4a1) 9.539 9.316 9.2
52E (3a1)(2e)(2e)2(4a1) 9.602 -
(3a1)(2e)2(2e)(4a1) 9.602 - (10.7)
C
CASSCF (9,8) CASSCF/MP 2(9,8)
12E (1e)4(3a1)2(2e)2(2e) 0.000 0.000
(1e)4(3a1) 2 (2e)(2e)2 0.000 0.000 0.0 12A1 (1e) 4 (3a1)(2e) 2 (2e)2 3.318 3.489 3.1 22E (1e)2(1e)(3a1) 2 (2e)2(2e)2 5.628 5.785 (1e)(1e)2(3a1) 2 (2e)2(2e)2 5.628 5.794 4.5-5.2 22A1 (1e) 4 (3a1) 2 (2e)(2e)(4a1) 7.012 6.792 (5.2) b 32A1 (1e) 4 (3a1) 2 (2e)(2e)(4a1) 8.239 8.041 7.4
The symmetry of the states and their description are included. The experimental values (eV) obtained by TPES in this work are displayed for comparison.
a
The predicted ionization energies (IE) corresponding to the calculated Eexc values are obtained by adding the "vertical" ionization energy of 10.535 eV calculated at the CCSD level for CH3Br at the equilibrium geometry of the neutral molecule.
b
Buried in the high energy tail of the 15.7 - 10.5 = 5.2 eV TPES band. c
More recently, Olney et al. [27] obtained PES spectra of CH3Br with 68, 70 and 72 eV photons using synchrotron radiation. Several peaks were reported lying at 21.3, 22.1, 23.6, 24.9 and 27.8 eV. The authors explicitly mention the absence of any signal between 17 and 20 eV for photons below 70 eV. In the 72 eV PES a fairly important signal arises in this energy range. This is assigned by these authors to autoionization following a 3d → σ* transition. The σ* electron then fills the Br/3d hole and a valence electron is ejected. These phenomena are excluded at photon energies below 25 eV.
Previous calculations all agree to assign the first three ionization energies to the ionization of the three outer-valence 2e, 3a1 and le orbitals [9,26,27]. This is confirmed in the present work using calculations at the OVGF [28,29] level with cc-pVTZ basis sets. Above 17 eV, all calculations agree to assign the signal observed at 21.2 eV and 22.0 eV to the inner-valence orbital 2a1 ionization. However, direct ionization does not explain the experimental data between 17 and 20 eV.
The CASSCF/MP2 (5, 7) calculations (see Section 3.3) takes into account 4 virtual MOs, i.e., two a1 and one degenerate e MOs. Beside the first two ionized states, nine states corresponding to doubly excited configurations have been considered and their energies calculated: the 22A1 at 17.0 eV, the 3
2
A1 at 18.0 eV, two doubly degenerate 32E and 42E at about 18.6 eV, the 42A1 at 20 eV and the doubly degenerate 52E at 20.1 eV. All these states are described by the removal of an electron from the 2e or the 3a1 orbital accompanied by the excitation of another electron into the first virtual 4a1 orbital.
Consequently, and considering an overestimation of the energy, the bands observed at 17.9, 18.3, 18.8 and 19.7 eV will be ascribed to 32A1 3
2
E, 42E, 42A1 and 5 2
E states, respectively. The signal corresponding to the latter state is very likely buried in the signal peaking at 21.2 eV. For the same reason the 22A1 state, predicted at 17 eV could not be observed as being buried in the high energy tail of the strong 15.7 eV peak.
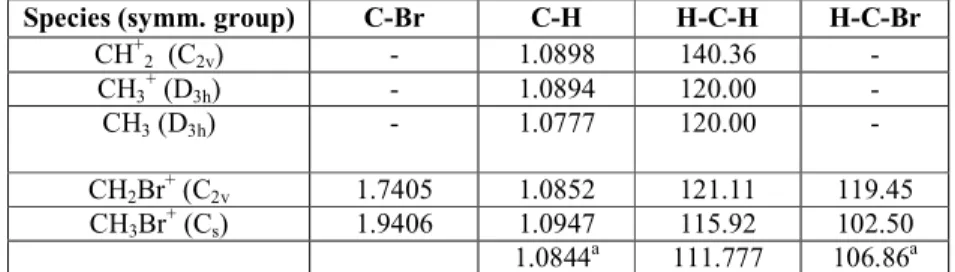
Table 5. Geometrical parameters at the optimized geometries of the fragment cations
Species (symm. group) C-Br C-H H-C-H H-C-Br
CH+2 (C2v) - 1.0898 140.36 - CH3 + (D3h) - 1.0894 120.00 - CH3 (D3h) - 1.0777 120.00 - CH2Br + (C2v 1.7405 1.0852 121.11 119.45 CH3Br + (Cs) 1.9406 1.0947 115.92 102.50 1.0844a 111.777 106.86a
These geometries were obtained at the CCSD(FC)/cc-pVTZ level. The internuclear distances and angles are expressed in Å and degrees, respectively.
a
Parameters related to the two equivalent C-H bonds in the molecular ion.
4.2. Photoionization mass spectrometry 4.2.1. The CH3Br
+
molecular ion (see Fig. 3)
The photoionization efficiency curve (PIC) of CH3Br+ measured between 10 and 20 eV photon energy is shown in Fig. 3(a). It shows two very different parts: (i) a rather narrow and structured region between 10 and 11.5eV and (ii) the 11.5-20 eV energy range exhibiting only a number of weak broad resonances. In the same figure the photoabsorption spectrum (PAS) of CH3Br, as observed between 10 and 20 eV, is inserted [1].
The latter photon energy range of 11.5-20 eV and its weak bands could only find an interpretation through the PAS data. In the PIC, band maxima are located at about 12.1, 13.1, 14.2, 15.1, 16.5 and 19.1 eV successively. These features have to be correlated with the weak structures observed in the PAS [1] (see also Fig. 1(b)). All these structures were assigned to electronic transitions from 3a1or le valence orbitals to ns (n = 5-8) Rydberg orbitals. The 19.1 eV transition should correspond to a transition from the (2a1 + la1) inner-valence orbital to a 5s or 5p Rydberg orbital [1].
In the threshold region many features are observed as shown on an extended energy scale in Fig. 3(b). To determine the onsets the PIC has been differentiated numerically and the result is inserted in Fig. 3(b). The energy positions of the structures are listed in the third column of Table 1. Only the lowest onset can be compared with previous pho-toionization mass spectrometry measurements of Krauss et al. [3] who reported IE
(CH3Br)=10.53 eV. By TPEPICO experiments, Tsai et al. [4] determined IE(CH3. Br)=10.54 ± 0.01 eV. The results of the present measurements are in good agreement with the ionization energies determined by other techniques (Table 1) [9,13]. By electron impact, Kaposi et al. [8] measured the ionization energy at 10.5 eV.
In the present work, nearly all the other features are detected by both TPES and PIMS techniques. Except for the signals at 10.601 and 10.703 eV, all the He(I)-PES structures are detected by PIMS. This makes the assignments fairly unambiguous and these are listed in the fifth column of Table 1 deduced, as already mentioned, from our previous vacuum UV photoabsorption spectrum analysis [2].
Several weaker or very weak features are present in the PIC and are not observed by TPES, e.g., at 10.565, 10.685, 10.795 10.820, 10.965 and 11.065 eV. These signals could correspond to vibrational autoionizing transitions from Rydberg states which autoionize to the nearest ionization X~2E3/2or 1/2(υ) continua releasing "near-threshold" photoelectrons. These are not detected by TPES spectrometry which strongly discriminates high energy electrons. To highlight this interpretation the vibrationally resolved CIS spectrum of the X~2E3/2(υ = 0) state has been recorded. Besides the direct ionization energies, well defined peaks are observed at 10.576 and 10.693 eV. Through this measurement, both these transitions are shown to vibrationally autoionize to the X~2E3/2(υ = 0) state releasing "non-threshold" photoelectrons.
4.2.2. The CH2Br +
fragment ion (see Fig. 4(a))
Contrary to the observations of Eland et al. [7], who report an intensity of about 20% of the total ionization, the CH2Br
+
fragment represents only 3% of the total ion intensity in the 20 eV photon energy mass spectrum recorded in this work. In the 20 eV electron impact mass spectrum, Kaposi et al. [8] reported 3.2% of the total ion intensity for the CH2Br+ fragment ion.
The photoion yield curve of CH2Br +
is reproduced in Fig. 4(a) between 10 and 20 eV photon energy. It shows a fairly sharp rise at about 12.8 eV. From the first differentiated ionization efficiency curve an appearance energy (AE) is measured at AE(CH2Br+) = 12.74 ± 0.01 eV. Besides this fairly well defined onset, the PIC shows a significant slope variation at 13.5 eV and two broad bands with their maximum at about 14.1 and 16.2 eV, respectively (see Table 3).
The lowest appearance energy of CH2Br +
lies significantly below the vertical ionization energy of 13.0 eV as measured for the CH3Br+ (Ã2A1) state by Karlsson et al. [31] using He (I)-PES. As mentioned in Section 4.1, a steadily raising photoelectron signal is starting at 11.8 eV in the TPES. In the PAS two bands are present in this photon energy range and have their maxima at 12.1 and 13.1 eV. This clearly means that at threshold the CH2Br
+
fragment ion is produced by
which could occur at this energy only through a dissociative autoionization process. As mentioned in Section 3.3 the predicted threshold for this process has been calculated by ab initio methods at 12.865 eV. This is in fairly good agreement with the experiment. Both fragments in their specified spectroscopic term correlate with the 2A' component of the ground electronic state of CH3Br
+
(X~2E). The satisfactory agreement between the experimental and predicted onsets would imply that process (1) has to occur without kinetic energy release on the fragments.
This latter conclusion, and the absence of at least electronic internal energy on the fragments, allows us to infer thermodynamic quantities from the measured onset. A heat of formation ∆fH298(CH2Br
+
) = 10.086±0.014 eV or 232.6 ± 0.3 kcal mol-1 (973.2 ± 1.3 kJ mol-1) is calculated using ∆fH298(CH3Br) = -0.395 ± 0.004 eV (-9.1 kcal mol-1) [32] and ∆fH298(H) = 2.259 eV (52.1 kcal mol-1) [32]. The present result is close to the value of 10.147 eV or 234.0 ± 0.4 kcal mol-1 obtained by Tsai et al. [4] from the dissociative photoionization of CH2Br2. However, both these two values significantly differ from the recommended value of 9.714 eV or 224 kcal mol-1 [32]. Furthermore, using the present ∆fH298(CH2Br
+
dissociation energy D(H-CH2Br+) = 2.20 eV is calculated and has to be compared with the ab initio predicted value of 2.33 eV. Introducing the recommended ∆fH298 values [32], a considerably lower D(H-CH2Br
+
) = 1.825 eV is obtained.
The critical energy observed at 13.5 eV in the PIC of CH2Br+ is close to the vertical IE of the CH3Br+(Ã2A1) state [31]. This suggests that up from this energy direct dissociative ionization could take place through the Ã2A1 electronic state. Alternatively, the same Rydberg state involved at 12.74 eV is able to autoionize to the Ã2A1 ionization continuum which subsequently dissociates. By their PEPICO experiment, Eland et al. [7] could not find coincidences for H-loss and electrons corresponding to the Ã2A
1 state. However, these authors report also "deleterious effects of CH3Br" on their instrument and "a full breakdown diagram was not measured for CH3Br". Consequently, the direct involvement of the Ã
2
A1 state in reaction (1) at 13.5 eV remains questionable.
Besides the fairly well defined onset at 12.74 eV, the PIC of CH2Br +
clearly shows broad bands characterized by a maximum at 14.1 and 16.2 eV (see Table 3). For these latter critical energies a close correlation has to be made with weak bands at 14.1 and 16.5 eV in the photoabsorption spectrum [1]. These were both assigned to Rydberg transitions [1]. These resonances spread over a photon energy region which widely overlaps the energy range covered by the Ã2A1 and the B~
2
E PES bands. Autoionization and subsequent dissociation into the CH2Br+ + H channel from these states are allowed. Furthermore, a large amount of excess energy is available with respect to the lowest dissociation limit. This excess can be released as vibronic excitation and translational energy of CH2Br
+ and H. 4.2.3. The Br+ fragment ion (see Fig. 4(b))
The photoion yield curve of Br+ is shown in Fig. 4(b) between 13 and 20 eV. It clearly exhibits three step-like features extending between 15 and 20 eV. The lowest threshold for Br+ production from CH3Br is measured at AE (Br+) = 15.00 ± 0.05 eV.
This appearance energy could only be compared with electron impact data. Kaposi et al. [8] reported the onset at 15.8 eV. In an early work, using the RPD method for mono-chromatizing the electron beam, Tsuda et al. [33] measured the threshold at 14.7 eV. Olney et al. [9] mention the onset at 18.25 eV as deduced from the partial differential oscillator strength for the Br+ formation from CH3Br. This latter energy is certainly not related to the lowest onset for this ion.
The dissociation level corresponding to CH3Br+ (X~2E) → CH3 (X~2A2'') + Br+ (3P2) has been predicted by ab initio calculations at 14.585 eV. Using the recommended ∆fH298 values [32] for the species involved in this reaction, an onset is calculated at 14.876 ± 0.030 eV. Recently [5], an experimental value of D°(CH3-Br) = 2.996 ± 0.006 eV has been reported. Taking IE[Br (2P3/2) → Br+ (3P2)] = 11.814 eV [12], one obtains an AE[Br+ (3P2)] = 14.810 eV. All predicted thresholds are significantly lower than the present experimental value at 15.00 ± 0.05 eV. This clearly means that the Br+ ion production does not occur at the dissociation threshold and consequently the 0.19 eV excess energy has to be converted very likely into translational energy of the fragments.
The lowest appearance energy of Br+ lies in the energy range of the B~2E state of CH3Br +
. Karlsson et al. [31] reported an IEad = 14.5 eV and IEvert = 15.0 and 15.7 eV as measured by He (I)-PES. These two latter energies are ascribed to the Jahn-Teller splitting of the second B~2E band into B~ (2A"-2A') in the Cs point group. They look apparently structureless. In addition this broad band stretches over the 14-17 eV energy range as the step-like feature in the Br+ PIC does from 15 up to 17.2 eV. Therefore, possibly the Br+ fragment ion could be produced by dissociative ionization starting from the B~2E ionic state.
Alternatively, as shown in Fig. 4(b), this same Br+ producing process could be related to weak absorption bands extending from 15 to 17 eV in the PAS. As mentioned earlier no PEPICO work devoted to the dissociative ionization of CH3Br has considered the Br
+
+CH3 channel. Therefore, at this point, a dissociative autoionization process could not be discarded and at 15.00 eV the production of Br+ is ascribed to
where both dissociative ionization through the B~2E state (or one of its Jahn-Teller components) and/or dissociative autoionization could be involved. As a support to this hypothesis, the large enhancement of the intensity of the Ã2A1 and B~
2
A states in the TPES has already been highlighted. In both cases the CH3Br +
(B2E) is deactivated by non-radiative transition to the Ã2A1 state which dissociates.
In our ab initio calculations, we attempted to optimize the geometry of the CH3Br +
(2A'-2A") components, as derived from the Jahn-Teller split 22E state, in the Cs point group. It appeared to be impossible to optimize the 2A' geometry owing to the existence, in the region of its minimum, of a strong non-adiabatic interaction with the 2A' state derived from the CH3Br
+
(Ã2A1) state. However, the lowest energy point in the non-adiabatic interaction region was determined at the CAS(9,6) level with the cc-pVTZ basis set. The geometry parameters at this point are presented in Table 6 (last line labeled CI).
The equilibrium geometry for the 2A" component was determined at both CAS (9,6) and CIS levels with the same cc-pVTZ basis set. The geometries are presented in Table 6. For comparison, the geometry of the neutral molecule at a similar level, i.e., CAS (10,6)/cc-pVTZ, is included in the same table.
Referring to the 22E energy in CAS (9,6) at the neutral molecule geometry, the 2A" minimum and the 2
A' lie at about 1.2-1.4 eV below the apex of the double cone, which corresponds to a much larger Jahn-Teller effect than for the CH3Br+ (X~
2
E) ground state (0.036 eV [2]). The 2A' and 2 A" components geometries of the 22E state are characterized by a larger C-Br bond (≈5%) but mostly by larger C-H bond lengths, either C-Hl (2A' (CI)) or C-H2 (2A" (min)) (see Table 6). This is understandable because the ionized molecular orbital is essentially localized on the C-H bonds.
Table 6. Optimized geometries of the neutral and the two components of theB~2E (corresponding to 22E in Table 4) state of CH3Br
+
State Calc. level (∆E) C-Br C-H1a C-H2a H1-C-Bra H2-C-Bra H2-C-H1a
1
A1 (C3v) CAS (10,6) 1.9778 1.0754 1.0754 107.42 107.42 120.00
2
A" (min) CAS (9,6) (-1.42) 2.0564 1.0761 1.1727 113.76 115.70 138.96
CIS 1.8634 1.0768 1.1877 120.05 117.40 140.16
2
A' (CI) CAS (9,6) (-1.25) 2.0842 1.2522 1.0866 109.58 113.94 105.82
The energy difference (∆E (eV)) refers to the cation at the neutral geometry and is given for the CAS results. Interatomic distances are in Å and angles in degrees. a
For the H-atom numbering, see [2].
The products of reaction (2) correlate with 2,4A1 and 2,4E states (in C3v) and with 2,4A' and 2,4A" states (in Cs). On the basis of the shape of the molecular orbitals ionized in the X
2
E and Ã2A1 states, these correlate with the CH3
+
+ Br dissociation limit. It is thus more probable that the CH3 + Br +
limit correlates with higher states, maybe the B~2E, though at the neutral molecule equilibrium geometry the shapes of the ionized MO(e) do not correspond to the asymptote. It is thus supposed that a MO rearrangement should occur along the C-Br elongation coordinate. On the basis of the results displayed in Table 6, the minimum of the 2A" component would lie around 15.0 - 1.4= 13.6 eV while the lowest energy region of the 2A' component would lie around 15.0 -1.2 = 13.8 eV in the avoided crossing region. Both states cross (avoided crossing or conical intersection) the lower lying 2A' correlated with the Ã2A1. In the PES, the B~ (2A"-2A') states clearly show a continuity up to about 17.2 eV [31]. Even if these do not exhibit any fine structure in the best resolved PES [31], this does not preclude the existence of a high density of vibronic levels owning to (i) Ã-B~ interactions and (ii) Jahn-Teller and pseudo-Jahn-Teller effects as recently shown by Mahapatra et al. [34] for the Ã2A1-B~
2
E states system in CH3F +
.
first derivative and is located at about 15.4 eV. The discussion presented above remains valid for this onset and is interpreted by the reaction:
where the energy difference ∆E= 15.4 — 15.0 = 0.4 eV is ascribed to the appearance of Br+ in one of its spin-orbit states 3P1 or
3
P0, respectively, at 0.389 and 0.476 eV above the 3
P2 ground state [35]. The dissociation limit (3) is still in the ionization energy range of the CH3Br+ (B~2E) state.
After the first sigmoidal part, the Br+ PIC shows a significant increase in the ion intensity from AE(Br+) = 17.32 ± 0.08 up to 18 eV. A last intensity increase is starting at AE(Br+) = 18.6 ± 0.2 eV. No CH3Br ionization cross section is measured in the He(I)-PES. Only the TPES and PAS spectra reveal the existence of ionic (doubly excited) and Rydberg states in this energy range. With respect to the lowest dissociation limit (2), these two onsets are in excess of 2.3 ± 0.1 and 3.6 ± 0.2eV, respectively. This energy difference could be ascribed to the fragments internal excitation, e.g., Br+ (1D2) at 1.41 eV (11409 cm
-1
) [35] and translational energy. For the CH3 radical no spectroscopic data are available for electronic excited states between the ground state and the first 3sa'1 Rydberg state at 5.729 eV (46205 cm-1) [36]. At the geometry of the X~2A2'' state the excited 2E' (4E') valence state is found by our calculations at 7.15 eV (11.28 eV) at the CCSD (FC)/pc-pVTZ level. The geometry of the 2A" component could be optimized but not that of the 2A'. The 2A" state lies at 5.91 eV above the X~2A2". 4.2.4. The CH2
+
fragment ion (see Fig. 5(a)) The PIC curve of CH2
+
displayed in Fig. 5(a) between 12 and 18 eV clearly shows an onset at AE(CH2+) = 14.75 ± 0.05 eV. This measurement could only be compared with the values of 14.7 ± 0.5 eV [8], 14.9 ± 0.2 eV [33] obtained by low-energy electron impact and 15.75 ± 1.0 eV [9] by dipole (e,e) spectroscopy. The last value of AE(CH2
+
is very likely not related with the lowest threshold.
By our quantum mechanical calculations the dissociation energy level for the reaction CH3Br+ (X~2E) → CH2
+
(X~2A1) + HBr (X 1
Σ+) has been predicted at 3.55 eV and the AE[CH2 +
(X~2A1)] = 14.085 eV. By a thermodynamic cycle and using the recommended AfH298 values [32] for the different species involved, an AE[CH2+ (X~2A1)] = 14.356 eV is calculated. Using the dissociation energies D0(CH3-Br) = 2.996 eV [5], D0°(CH2-H) = 4.734 ± 0.006 eV [37], D°(H-Br) = 3.758 eV [38] and the latest determination of the ionization energy IE(CH2) = 10.3864 ± 0.0004 eV [37], one obtains the AE[CH2+(X~2A1)] = 14.358 eV, in very good agreement with the previous value. Whatever the predicted AE values, these are definitely lower than the experimental value. As in the case of the CH2Br
+
and Br+ ions, it has also to be concluded in this case that the dissociation does not occur at the dissociation limit: an excess (translational) energy of at least 0.39 eV should be involved in the process.
Similarly to CH2Br +
, the lowest onset lies in the CH3Br+ (A 2
A1-B~ 2
E) energy range. More precisely, as has been extensively discussed in Section 4.2.3, the 2A' (corresponding to the Ã2A1 state in the C3v point group) should interact non-adiabatically with the 2A' component of the Jahn-Teller split B~2E state. This coupling would give rise to an avoided crossing which is predicted to lie at about 14.7 eV. The dissociation at 14.75 eV could be described by
The multiplicity and symmetry of the fragments correlate with a 2A1 ionic state. However, the population by autoionization of these states has been highlighted in the TPES. Therefore, the dissociative autoionization contribution to this reaction pathway has to be accounted for.
The CH+2 photoion PIC unambiguously shows a second threshold at 15.4 ± 0.2 eV, i.e., (i) a ∆E = 0.6 eV above the experimental AE and (ii) 0.9 eV ≤ ∆E ≤ 1.05 eV above the thermodynamical onset. It has to be
pointed out here that this dissociation limit is at the same level as CH3 (X
~
A"2)+ Br +
(2P1/2).
Within this excess energy, no discrete electronic excitation of HBr is observed [38]. Concerning CH+2, vibronic spectroscopic data are scarce. Recently, however, Gottfried and Oka [39] measured the near-infrared spectrum of CH2 between 11000 and 13 000 cm
-1
: X~ (0, υ, 0) → Ã(0,0,0) vibronic transitions with v = 3-10 are reported. Considering BH2 as the isoelectronic species of CH2
+
, its first electronic state is a linear 2B1 state lying at 5150 cm-1 [40] (0.639 eV) or 4194.1 cm-1 [36] (0.520 eV) above the X~2A1 ground state. These states result from the Renner-Teller splitting of the linear 2∏ state. By ab initio calculations at the MP2/6-31 G** level [30] we predicted the first excited state of CH2
+
to lie at 0.922 eV above the ground state and a bent-to-linear configuration barrier of 0.163 eV. This electronic excitation energy fits fairly well 0.9 eV ≤ ∆E ≤ 1.05 eV. In the dissociative photoionization efficiency curve of CH2
+
/CH3Cl an energy difference ∆E - 1.0 ± 0.1 eV has been measured and this energy difference was also assigned to the production of CH2
+
(Ã2 B1). On the basis of these arguments we propose to assign the onset at 15.4 eV to
where the spectroscopic terms of both fragments correlate with a 2A' state in the Cs point group. The involved 2
A' state could be identified as the 2A' state derived from the Ã2A1 and/or B
2
E states which dissociates at 15.4 eV leading to the CH2+ (Ã2B1)+HBr (X1∑+) fragments. Very likely predissociation and autoionization have to contribute. In reaction (5) no or very small amounts of transla-tional energy will be involved.
4.2.5. The CHf fragment ion (see Figs. 5(b) and 6) The photoionization efficiency curve of CH3
+
/CH3Br has been measured between 9 and 20 eV photon energy. It can roughly be divided in two parts: (i) the low-energy, very weak ion yield spreading from 10 to 12 eV and (ii) the high energy, high ion yield curve extending from about 12.5 to 20 eV. The former part is abundantly structured whereas the latter part has a smooth shape.
As mentioned in Section 3.2.5 the lowest significant threshold energy measured in the low-energy part of the PIC (see Fig. 6(a)) has been identified by the first resonance emerging from the background with S/N ≥ 3, i.e., at AE(CH3
+
) = 9.51 ± 0.02eV. At higher energies the structures are stronger and unambiguously identified. The energy position of all the observed resonances are listed in Table 2, column 2 together with the resonances measured in the PAS in the same energy range [1]. Column 3 in Table 2 displays the assignments as proposed in our previous PAS reports [1,2].
As highlighted in Table 2 and Fig. 6(a) and (b), the only possible interpretation is the CH3 +
ion production by ion-pair formation through predissociation of Rydberg states lying almost all below, and converging to the CH3Br lowest ionization limit at 10.543 eV. Therefore, the dissociation process should be
where the fragments with their respective spectroscopic terms correlate only with a CH3Br*( 1
A1) predissociating Rydberg state. The successive vibronically predissociated states are listed in Table 2.
The present experimental onset could only be compared with the measurement reported by Tsuda et al. [33] at 10.7 eV or Williams and Hamill [41] at 9.60 ± 0.05 eV by electron impact. Using the ab initio calculated dissociation limit (see Section 3.3) of 12.705 eV for the reaction CH3+ + Br and subtracting the electron affinity of the Br atom EA(Br) = 3.365 ± 0.003 eV [42] a threshold AE(CH3
+
/Br-) = 9.340 ± 0.003 eV is calculated. Taking the recent PFI-PEPICO determination AE(CH3
+
/Br) = 12.834 ± 0.002 eV [5], an AE(CH3 +
/Br-) = 9.469 ± 0.005 eV is obtained and has to be compared with the onset measured by photoionization in the present work.
In the high energy region 12.5-20 eV the PIC of CH3+ steeply rises up from AE(CH3+) = 12.74 ± 0.02 eV as measured on the first differentiated PIC shown in Fig. 5(b). The maximum in the first derivative at 12.85 eV corresponds to the inflexion point in the PIC. A change of slope, unambiguously emphasized in the first derivative, is measured at 13.22 ± 0.02 eV. From these critical energies, only the lowest threshold can be compared with previously reported data: 12.8 ± 0.3 eV [8], 13.0 eV [33] and 12.75 ± 1.0 eV [9] by electron impact and 12.77 eV [3] or 12.80 ± 0.03 eV [4] by conventional photoionization. Recently, Song et al. [5] determined AE(CH3
+
)0K = 12.834 ± 0.002 eV by PFI-PEPICO breakdown diagram of CH3 +
.. 2(b) in [5]) an AE (CH3
+
)300K = 12.77 ± 0.01 eV is o From their "effusive beam" data (see Figbtained. The lowest threshold energy of CH3+ should correspond to the reaction
for which a threshold of 12.705 eV is calculated by ab initio methods. By the appropriate thermodynamic cycle and using the recommended quantities [32] the threshold is predicted at 12.889 eV. The discrepancy between the threshold values reported in [5] and in the present measurement could partially (for about 46 meV) be ascribed to the temperature conditions (300 K) of the present experiment. As already mentioned earlier, the threshold at 300 K evaluated from Fig. 2(b) in [5] is 12.77 ± 0.01 eV.
Whatever the temperature, the AE(CH3+) lies below the CH3Br+ (Ã2A1) ionization energy and the dissociation continuum (7) has to be populated by autoionization. This conclusion agrees with the PFI-PEPICO experiments of Song et al. [5]. This dissociation limit correlates with the 2A' and 2A" components of the Jahn-Teller split CH3Br
+
(X~2E) state along the reaction coordinate (7). It should be stressed here that the same 2A' state has a dissociation continuum at 12.74 ± 0.01 eV along the CH2Br
+
+H reaction path (see Section 4.2.2). In this case autoionization has to be involved too. Rydberg state(s) peaking at 13.1 eV and spreading from 12.4 to 13.8 eV is(are) good candidate(s).
An energy difference of 0.48 ± 0.04 is measured between the lowest onset and the AE(CH3 +
) = 13.22 ± 0.02 eV. This amount could be assigned to the excitation of one or both dissociating species. The Br atom is characterized by a 2P3/ 2
-2
P1/2 spin-orbit splitting of 3 685 cm -1
(0.457 eV) [35]. Despite the discrepancy between the onsets, the
reaction will very likely run over the Ã2A1 ionic state: the second onset is very close to the adiabatic IE[CH3Br+ (Ã2A1)] = 13.0 eV [31]. As for CH2Br
+
at 13.50 eV, it has to be considered that part of the Ã2A1 population occurs through autoionization. Alternatively, this dissociation could occur by direct dissociation through a transition to the continuum of the Ã2A1 state.
At higher energies the PIC of CH3 +
shows a broad resonance up from 14.5 eV and peaking at about 15.5 eV. It nearly covers the energy range of 14.5-18 eV where weak bands are observed in the PAS of CH3Br (see Fig. 5(b)). An excess energy of 1.8-5.3 eV has to be converted into translational and/or internal energy of the fragments. In the latter case the electronic excitation of the Br atom has to be discarded: the first excited state 4
P5/2 lies at 63,429 cm -1
above the 2P3/2 ground state [35]. On the other hand, the excitation of the CH3 +
ion in its A3E" and Ã1E// states requires 4.92 and 6.26 eV, respectively [43]. Below 20 eV only the excitation of CH3
+ in its a3E" state could be considered and large amounts of translational energy have to be involved.
5. Conclusions
The aim of this paper was to complete our CH3Br study by the photoionization techniques. The fragmentation of the molecular ion has been examined and the importance of the autoionization contribution has
been assessed. Ab initio calculations at various levels have been performed to support our argumentation and assignments.
In the TPES, autoionization is responsible for (i) increasing by a factor 5 the intensity ratio of the X~/Ã PES bands and (ii) filling the ionization gap between 11.3 and 13.0 eV, extending and increasing the Franck-Condon factors of the vibrational sequences in the X~2E band. This observation is confirmed by CIS spectroscopic experiments. In the TPES very weak structures are observed between 17 and 21 eV and assigned to CH3Br
+
doubly excited states as suggested by ab initio calculations. The fragmentation of CH3Br
+
has been investigated by photoionization mass spectrometry: the CH2Br +
+ H, Br+ + CH3, CH2+ + HBr and CH3+ + Br dissociation pathways have been considered from their respective thresholds up to 20 eV photon energy. At the experimental threshold CH3
+
and CH2Br +
are produced at the CH3Br+ (X~2A') ground state dissociation limit by dissociative autoioniza-tion only. At photon energies between 13.0 and 15.0 eV the autoionization of Rydberg states and/or the (pre)disso-ciation of the Ã2A' and B~2A' states play an important role and account for the production of the appearance of all fragment ions considered in this work. The latter mechanism is supported by quantum mechanical calculations which highlight a non-adiabatic interaction between the Ã2A state and the B(2A'-2A") states. Above 15eV the autoionization of Rydberg states leads to fragmentation.
In the CH3 +
dissociation channel the photoion-pair CH3 +
+ Br- formation has been investigated in detail. The abundant fine structure has been interpreted by successive predissociation processes of Rydberg states all identified with the help of recent photoabsorption data [1,2].
Acknowledgments
We are indebted to the University of Liège, the Freie Universität Berlin and the Bundesministerium für Forschung und Technologie for financial support. H.B. acknowledges the Fonds der Chemischen Industrie for financial support. R.L. and B.L. gratefully acknowledge the European Community for its support through its TMR and EC-I3 programmes (Contracts EU-TMR-ERBFMGE-CT-970123 and R II 3-CT-2004-506008). This work has also been supported by the Direction de la Recherche Scientifique de la Communauté Française de Belgique through an Action de Recherche Concertée (Grant ARC 99/04-245). D.D.'s contribution was supported by the Belgian Programme de Pôles dAttraction Interuniversitaire (PAI no. P4/03) initiated by the Belgian state, the Prime Minister's Office, the Federal Office of Scientific, Technical and Cultural Affairs. We wish also to thank the BESSY staff, and particularly Dr. G. Reic-hardt, for the outstanding maintenance of the equipment. References
[1] R. Locht, B. Leyh, H.W. Jochims, H. Baumgärtel, Chem. Phys. 317 (2005) 73.
[2] R. Locht, B. Leyh, D. Dehareng, H.W. Jochims, H. Baumgärtel, Chem. Phys. 317 (2005) 87. [3] M. Krauss, J.A. Walker, V.H. Dibeler, J. Res. N. B. S. 72A (1968) 281.
[4] B.P. Tsai, T. Baer, A.S. Werner, S.F. Lin, J. Chem. Phys. 79 (1975) 570. [5] Y. Song, X.-M. Qian, K.-C. Lau, C.Y. Ng, J. Chem. Phys. 115 (2001) 4095. [6] S. Suzuki, K. Mitsuke, T. Imamura, I. Koyano, J. Chem. Phys. 96 (1992) 7500.
[7] J.H.D. Eland, R. Frey, A. Kuestler, H. Schulte, B. Brehm, Int. J. Mass Spectrom. Ion Phys. 22 (1976) 155. [8] O. Kaposi, M. Riedel, G.R. Sanchez, Acta Chim. Acad. Hung. 85 (1975) 361.
[9] T.N. Olney, G. Cooper, W.F. Chan, G.R. Burton, C.E. Brion, K.H. Tan, Chem. Phys. 218 (1997) 127. [10] R. Locht, B. Leyh, K. Hottmann, H. Baumgärtel, Chem. Phys. 220 (1997) 217.
[ 12] C. E. Moore, Ionization potentials and ionization limits from the analyses ofopticalspectra,NSRD-NBS34(Septemberl970),USDpt. Commerce Nat. Bur. Stand., US Govt. Print. Off., WashingtonDC, 1970.
[13] M.J. Frisch, G.W. Trucks, H.B. Schlegel, G.E. Scuseria, M.A. Robb, J.R. Cheeseman, J.A. Montgomery, T. Vreven, K.N. Kudin, J.C. Burant, J.M. Millam, S.S. Iyengar, J. Tomasi, V. Barone, B. Mennucci, M. Cossi, G Scalmani, N. Rega, G.A. Peterson, H. Nakatsuji, M. Hada, M. Ehara, K. Toyota, R. Fukuda, J. Hasegawa, M. Ishida, T. Nakajima, Y. Honda, O. Kitao, H. Nakai, M. Klene, X. Li, J.E. Knox, H.P. Hratchian, J.B. Cross, C. Adamo, J. Jaramillo, R. Gomperts, R.E. Stratmann, O. Yazyev, A.J. Austin, R. Cammi, C. Pomelli, J.W. Ochterski, P.Y. Ayala, K. Morokuma, G.A. Voth, P. Salvdor, J.J. Dannenberg, V.G. Zakrzewski, S. Dapprich, A.D. Daniels, M.C. Strain, O. Karkas, D.K. Malick, A.D. Rabuck, K. Raghavachari, J.V. Ortiz, J.B. Foresman, Q. Cui, A.G. Baboul, S. Clifford, J. Ciolowski, B.B. Stefanow, G Liu, A. Liashenko, P. Piskorz, I. Komaromi, R.L. Martin, D.J. Fox, T. Keith, MA. Al- Laham, C.Y. Peng, A. Nanayakkara, M. Challacombe, P.M.W. Gill, B. Johnson, W. Chen, M.W. Wong, C. Gonzalez, J.A. Pople, Gaussian 03 (Revision B04), Gaussian Inc., Pittsburgh, PA, 2003.
[14] D. Hegarty, M.A. Robb, Mol. Phys. 38 (1979) 1795. [15] R.H.E. Eade, M.A. Robb, Chem. Phys. Lett. 83 (1981) 362.
[16] F. Bernardi, A. Bottini, J.J.W. McDougall, M.A. Robb, H.B. Schlegel, Faraday Symp. Chem. Soc. 19 (1984) 137. [17] F. Bernardi, A. Bottini, C. Canepa, M. Olivucci, MA. Robb, G. Tonachini, J. Org. Chem. 62 (1997) 2018. [ 18] G.E. Scuseria, H.F. Schaefer III, J. Chem. Phys. 90 (1989) 3700.
[19] T.H. Dunning Jr., J. Chem. Phys. 90 (1989) 1007.
[20] D.E. Woon, T.H. Dunning Jr., J. Chem. Phys. 98 (1993) 1358.
[21] J.B. Foresman, M. Head-Gordon, J.A. Pople, M.J. Frisch, J. Phys. Chem. 96 (1992) 135. [22] C. Moller, M.S. Plesset, Phys. Rev. 46 (1934) 618.
[23] M. Head-Gordon, J.A. Pople, M.J. Frisch, Chem. Phys. Lett. 153 (1988) 503. [24] R. Locht, J. Momigny, Int. J. Mass Spectrom. Ion Phys. 7 (1971) 1713. [25] R. Locht, J. Momigny, Int. J. Mass Spectrom. Ion Phys. 15 (1974) 361.
[26] W. Von Niessen, L. Âsbrink, G. Bieri, J. Electr. Spectr. Related Phenom. 26 (1982) 173.
[27] T.N. Olney, W.F. Chan, G. Cooper, C.E. Brion, K.H. Tan, J. Electr. Spectr. Rel. Phenom. 66 (1993) 83. [28] L.S. Cederbaum, W. Domcke, Adv. Chem. Phys. 36 (1977) 205.
[29] W. von Niessen, J. Schirmer, L. Cederbaum, Comp. Phys. Rep. 1 (1984) 57.
[30] R. Locht, B. Leyh, A. Hoxha, D. Dehareng, K. Hottmann, H.W. Jochims, H. Baumgärtel, Chem. Phys. 272 (2001) 293. [31] L. Karlsson, R. Jadrny, L. Mattsson, F.T. Chan, K. Siegbahn, Phys. Scr. 16 (1977) 225.
[32] S.G. Lias, J.E. Bartmess, J.F. Liebman, J.L. Holmes, R.D. Levin, W.G. Mallard, J. Phys. Chem. Ref. Data 17 (Suppl. 1) (1988). [33] S. Tsuda, C.E. Melton, W.H. Hamill, J. Chem. Phys. 41 (1964) 689.
[34] S. Mahapatra, V. Vallet, C. Woywod, H. Köppel, W. Domcke, Chem. Phys. 304 (2004) 17. [35] C.E. Moore, Atomic Energy Levels, vols. I and II, Circ. NBS 467, USGPO, Washington DC, 1949. [36] M. Jacox, J. Phys. Chem. Ref. Data 32 (Suppl. B) (2003) 1.
[37] S. Willitsch, L.L. Imbach, F. Merkt, J. Chem. Phys. 117 (2002) 1939.
[38] K.P. Huber, G. Herzberg, Molecular Spectra and Molecular Structure. IV. Constants of Diatomic Molecules, New York, 1979. [39] J.L. Gottfried, T. Oka, J. Chem. Phys. 121 (2004) 11527.
[40] G. Herzberg, Molecular Spectra and Molecular Structure. III. Electronic Spectra and Electronic Structure of Polyatomic Molecules, D. Van Nostrand Company, Inc., Princeton, NJ, 1967.
[41] J.M. Williams, W.H. Hamill, J. Chem.Phys. 49 (1968) 4467. [42] H. Hotop, W.C. Lineberger, J. Phys. Chem. Ref. Data 14 (1985) 731.

![Table 2. Position in energy (eV) of the structures observed in the PAS [1,2] of CH 3 Br and in the photoion-pair process of CH 3](https://thumb-eu.123doks.com/thumbv2/123doknet/5463123.129312/11.918.247.672.132.900/table-position-energy-structures-observed-pas-photoion-process.webp)