HAL Id: hal-01954422
https://hal.inria.fr/hal-01954422v2
Submitted on 6 Mar 2019
HAL is a multi-disciplinary open access
archive for the deposit and dissemination of
sci-entific research documents, whether they are
pub-lished or not. The documents may come from
teaching and research institutions in France or
abroad, or from public or private research centers.
L’archive ouverte pluridisciplinaire HAL, est
destinée au dépôt et à la diffusion de documents
scientifiques de niveau recherche, publiés ou non,
émanant des établissements d’enseignement et de
recherche français ou étrangers, des laboratoires
publics ou privés.
Distributed under a Creative Commons Attribution| 4.0 International License
Probabilistic Event Graph to Model Safety and Security
for Diagnosis Purposes
Edwin Bourget, Frédéric Cuppens, Nora Cuppens-Bouhlahia, Samuel Dubus,
Simon Foley, Youssef Laarouchi
To cite this version:
Edwin Bourget, Frédéric Cuppens, Nora Cuppens-Bouhlahia, Samuel Dubus, Simon Foley, et al..
Probabilistic Event Graph to Model Safety and Security for Diagnosis Purposes. 32th IFIP Annual
Conference on Data and Applications Security and Privacy (DBSec), Jul 2018, Bergamo, Italy.
pp.38-47, �10.1007/978-3-319-95729-6_3�. �hal-01954422v2�
Probabilistic Event Graph to Model Safety and
Security for Diagnosis Purposes
Edwin Bourget1, Fr´ed´eric Cuppens1, Nora Cuppens-Boulahia1, Samuel
Dubus3, Simon Foley1, and Youssef Laarouchi2
1 IMT Atlantique, Lab-STICC, UBL, F-35576 Cesson S´evign´e, France 2
EDF Labs
3 Nokia Bell Labs
Abstract. Diagnosing accidental and malicious events in an industrial control system requires an event model with specific capacities. Most models are dedicated to either safety or security but rarely both. And the latter are developed for objectives other than diagnosis and therefore unfit for this task. In this paper, we propose an event model considering both safety and security events, usable in real-time, with a probabilistic measure of on-going and future events. This model is able to replace alerts in the context of more global scenarios, including with reinforcements or conflicts between safety and security. The model is then used to provide an analysis of some of the the security and safety events in the Taum Sauk Hydroelectric Power Station.
1
Introduction
With the increasing interconnection of Industrial Control Systems (ICS) through cyberspace, new challenges arise when ensuring their safety and security. Once rather well separated, both characteristics of the system are now completely interleaved: a cyber-attack may have consequences on an industrial process and the response to a safety incident can inadvertently impact the security of the system. Therefore, when an incident occurs in an ICS, it is more and more difficult, yet essential, to understand what is happening in order to select the appropriate response. The analysis of the incident is the diagnosis.
Providing explanation of purely accidental and malicious incidents is typically done using, respectively, fault trees [1] and attack trees [2]. Risk analysis or incident tracking can be done using more advanced methods such as Bayesian networks [3] or Petri networks [4] However, they can in practice be viewed as a refinement of fault and attack trees.
There exist several models dedicated to one characteristic, either safety or security, but they are hardly adaptable to the other one. The reason is that safety and security have their different semantics and using one for the other is not always meaningful. Therefore, the propagation of the incident is different and most models cannot represent both. A small number of models exist that can represent both safety and security at the same time, such as BDMP [5,6] or the FIGARO language [7]. However, they were not originally developed for diagnosis
purposes and therefore, lack essential features considered in this paper, such as real-time monitoring or alert instantiation, towards achieving this objective.
According to [8], diagnosis can be divided into three sub problems: detecting the problem, locating it and determining its scope. Detecting the problem means having the knowledge that a safety or a security incident is happening. Locating the problem is knowing what components are at fault or targets of an attack. Determining its scope is being able to identify the affected subsystems. In a nutshell, it means explaining what is happening. In order to do so, a model of what can happen is required. Risk analysis models based on fault and attack trees are suited for that. Then, mapping the ongoing situation to the model allows for finding the roots of the problem or generating hypotheses on evolutions of the problem, such as the objective of an attacker or the next components to fail. Sometimes, though, the ongoing situation might not completely fit the model. Therefore, a measure of the variation of the incident from the model should be provided. Being able to reason beyond the scope of the system is an important part of diagnosis and is what we provide with our model.
The objective of this paper is to lay the foundations of a way to model safety and security in order to perform diagnosis of incidents in ICS. We propose a model to represent safety and security events, draw logical connections between them in order to generate complete scenarios and a probabilistic component to compute the likelihood of both the complete scenarios and the elementary events. The paper is organised as follows: Section 2 introduces the LAMBDA lan-guage for describing security attacks and upon which the proposed model, de-scribed in Section 3, is based. Section 4 illustrates the capabilities of the model on a use case. Section 5 compares the proposed model to existing research and Section 6 gives insights on future uses and evolutions of the model.
2
Background
LAMBDA [9] is a language used to describe security attacks. It is based on the general concept that an attack can succeed if a set of conditions (called preconditions) is satisfied, and will have effects (called postconditions) on the system if it succeeds. It is also described by a scenario, being the different actions needed to be combined to perform the attack. Attacks described in LAMBDA can be of any granularity going from elementary steps that an attacker needs to carry out to progress towards his objective, to the description of a complete scenario.
CRIM [10] is a correlation engine that draws connection between attacks described in LAMBDA: if a postcondition of an attack A1 matches with a
pre-condition of an attack A2, then the realisation of A1favours the realisation of A2.
That is A1 enables the attacker to then perform A2. In this particular example,
the attack graph generated would have a connection from A1to A2.
Unfortunately, LAMBDA does not fit to model safety events. Indeed, every attack is to be described by a scenario, being a set of actions. When modelling safety, a component failure, like the one of a hard-drive, can happen without
being the result of a particular action: it is its regular wear. Moreover, LAMBDA in itself is devoid of any probabilistic evaluation. [11] proposes a modification of LAMBDA to overcome this issue but it only computes a mean time to success (MTTS) and this is not sufficient for a complete evaluation of the likelihood of an incident.
Nonetheless, we will base the model we present in Section 3 on a heavily modified version of LAMBDA in order to reuse its event-tracking ability and the pre/postconditions modelling, as well as CRIM.
3
The model
In this section, we present our model. First we define the events, then we con-struct scenarios out of events, and we finally compute the probabilities required for diagnosis.
3.1 The Event
In the model we propose, the system in which incidents happen is represented by a set of variables. This set is called the system state. We define an event as a modification in the system state. Therefore, an event is the result of the occurrence of an attack or an accidental failure.
An event is characterised by its attributes: a set of preconditions, a set of postconditions, the nature of the event, a realisation process and a detection process.
The preconditions set and the postconditions set are inherited from LAMBDA. They are composed of predicates combined with the logical connec-tives ∧, ∨ and ¬. The former set is used to describe the value that the variables of the system state must have for the event to be feasible. The later set is used to describe the value that the variables of the system state will have after the event has occurred.
The nature of the events is a label used to quickly know the type of the event: so far, we only used safety and security but any other type of events could potentially be added, such as countermeasures or regular events whose occurrence is part of the industrial process.
We define the realisation process as a probability distribution function (PDF). It is used to describe the evolution of the occurrence probability of the event over time, given that all of the conditions for the event to happen are met. Any PDF can be used, even custom ones. This is where the difference in modelling security and safety events lies in our model. Indeed, their realisation process is different and is represented, in this model through the PDF. With this approach, the model can therefore acknowledge for any kind of propagation: when modelling a specific event, one simply has to use its most appropriate PDF. The detection process is used to link the modelled event to an alert A collected by the SCADA or SIEM system. It is used to inform the model that
the event has been realised in order to update the system state and trigger instantiation of said alert A.
Figure 1 gives the model of the failure of a hard-drive. The PDF associated with the event is a Weibull distribution. The distributions and their parameters are chosen by the experts modelling the system, but can be derived from size-able return on experience. For instance, when it comes to hard-drive failures, [12] has determined that the Weibull distribution is much more suited than the exponential distribution. Modelling this event with a PDF allows us to compute the mean time to failure of the event (5 years) or the probability of failure after ninety days (7.52 × 10⁻⁹) for instance.
Name Hard-drive failure Preconditions ¬f ailed(HardDrive) Postconditions f ailed(HardDrive) Nature safety
Realisation Weibull distribution (lambda = 5.516, k = 4)
Detection server operating system raises alert
Fig. 1: Hard-drive failure
3.2 The Attack Graph
After the set of elementary events have been defined, it can be used by CRIM to correlate the dependencies between the events and generate event graphs corre-sponding to complete scenarios. CRIM says that events A and B are correlated if P ost(A), the postconditions of A, and P re(B), the preconditions of B, are correlated. And this happens when at least one of the predicates of P ost(A) and one of the predicates of P re(B) are unifiable through a most general unifier (mgu) [13]. If such an mgu is found, a directed connection from A to B is present in the event graph output by CRIM. CRIM tries to correlate every pair of events and then generates its event graph displaying the logical dependencies between the events, as illustrated in Figure 4.
3.3 Recombining PDF
Once the logical dependencies have been established between the different events and a scenario has been selected, its PDF can be computed. To do so, the local PDF associated with each event needs to be recombined in order to express the global PDF of the scenario. There exists three different situations: the sequence, the AND, and the OR.
On a side note, we will assume that the random variables associated with two events are always independent. It means that, the time taken to realise one event has no influence on the time taken to realise another event.
The Sequence. Let us consider that events A and B happen in sequence. C4 corresponds to “A happens then B happens”. A, B, and C are respectively
associated with the PDF fA, fB, and fC. The probability that C happens in a
given timespan I given that nothing has happened yet is actually the probability that both A and B happen in I. This can be written:
fC: R → R
x 7→ Z +∞
−∞
fA(t)fB(x − t)dt
In other words, fC is the convolution of fA and fB: fC= fA∗ fB.
The AND. Let us consider that both events A and B need to happen for C to happen. A and B are respectively associated with the PDF fA and fB, the
CDF FA and FB (the cumulative distribution function evaluated at x is the
probability that the event will be realised at x), and with random variables X and Y . The probability that A and B happen in a given timespan I can therefore be written P (X ∈ I, Y ∈ I). X and Y being independent, we have:
P (X ∈ I, Y ∈ I) = P (X ∈ I)P (Y ∈ I)
If we call g the PDF associated with the event “A and B has happened”, we obtain:
g = fAFB+ FAfB
The OR. The case of the OR is similar to the one of the AND, with the difference that the AND is the set intersection when the OR is the set union. The resulting PDF, using the same notations as the AND case is:
g = fA+ fB− fAFB− FAfB
The nature of the calculus used to obtain the PDF corresponding to the three situations make it so that they can be done in any order. For instance, the PDF associated with (A or B) or C is the same as A or (B or C).
3.4 Perspectives of the Probabilistic Recombinations
In this paragraph, we illustrate how to recombine the distributions with a generic example. Let us consider three events A, B and C respectively associated with PDF fA, fB and fCand with their cdf FA, FB and FC. We use the same events
calculus algebra as LAMBDA [9] to combine the events: “A; B” represents A in sequence with B and “A&B” means that both A and B must happen. Let
4 C is not a LAMBDA event. It is just an abstraction used to compute the PDF
asso-ciated to a set of events. It has no meaning outside of the scope of the probabilistic calculations.
us consider the situation A; (B&C). Using the formulas demonstrated in the precedent paragraph, we obtain the distribution function g associated with this situation: g = fA∗ (fBFC+ FBfC).
Distribution g can then be used to evaluate the mean time that it will take for a composition of events to occur, or to compute the probability that this composition will happen in any given duration. The recombination formulas we provide in this section are valuable tools for the diagnosis. Indeed, where a system expert can realistically provide accurate distributions for elementary events, it becomes much more arbitrary for more complex events. By decompos-ing a complex event in elementary ones, then defindecompos-ing PDF for these elementary events and recombining them to have the one of the complex event, we obtain an accurate description of the realisation process of this event. The PDF can then be used as a metric and combined with other ones, such as the impact, in order to give comprehensive feedback to a decision-maker who is looking for the most appropriate response, for example.
4
The use case
The case study is based on an actual power station: Taum Sauk Hydroelec-tric Power Station [14,15,16]. For our study, we will consider the upper and the lower reservoir, the pump, the Operator Control Center (OCC) and the two au-tomatons Common PLC (Common PLC) and Upper Reservoir PLC (UR PLC). OCC, Common PLC and UR PLC are in the same network Operator Control Network (OCNet). When the water level in the upper reservoir overcomes a certain threshold, sensors send this information to the PLCs that forward the information to the OCC that can turn off the pump. If for whatever reason the pump does not stop, other sensors sends the information to the two PLCs who directly trigger a hard stop on the pump. If the water level keep rising, it will eventually overtop the reservoir, erode the relief upon which it is built and will cause a massive breach as it happened in december 2005 [14,15,16].
Following the methodology of our model, in order to get the scenarios, one must first describe all of the elementary attacks or failures. In this paper we will present two elementary events in figures 2 and 3 : an intruder gaining access to the OCNet and an attacker compromising the communication link between the Common PLC and the Pump.
After defining all of the events identified by the safety and security experts, they are fed to the correlation engine that outputs scenarios. Several scenarios can lead to the failure of the upper reservoir. For the sake of this article, we have selected one displayed on figure 4. The graph output by CRIM corresponding to the selected scenario is displayed in figure 4. It describes that one can cause the overtopping by intercepting all stop orders sent to the pump while it is active. Three sources can produce the stop orders : the Common PLC, the Upper Reser-voir PLC and the Operator Control Center. All of the orders can be intercepted if one compromises the communication links between the order sources and the pump. Finally, all of the communication links can be compromised if one has
Name Access Operator Control Network
Preconditions encryption(OC Net, null) Postconditions remoteAccess(A, OC Net) Nature attack
Realisation exponential distribution (1/λ = 3years) Detection IDS detects unknown IP
address
Fig. 2: Access to the Operator Control Network
Name Compromise Common PLC communication link Preconditions
remoteAccess(A, OC Net) & vulnerable(Common PLC, cve-2004-1234)
PostconditionsmanInTheMiddle(A, Common PLC, Pump) Nature attack
Realisation exponential distribution (1/λ = 10min)
Detection IDS detects ARP spoofing
Fig. 3: Compromising of the communi-cation link
access to the Operator Control Network. For reference, all of the probability distributions are chosen exponential, except for the event “Pump does not stop” which is a Dirac delta function. The parameters are displayed next to the name of the corresponding event.
A
B C D
E F G
H – A: Access OC net; 1/λ = 3years
– B: Compromise Common PLC com. link; 1/λ = 8min – C: Compromise UR PLC com. link; 1/λ = 8min – D: Compromise OCC com. link; 1/λ = 10min – E: Send false order (Common PLC); 1/λ = 5min – F: Send false order (UR PLC) ; 1/λ = 5min – G: Send false order (OCC); 1/λ = 7min – H: Pump does not stop
Fig. 4: Scenario output by CRIM
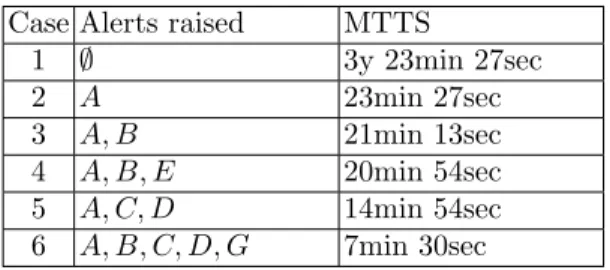
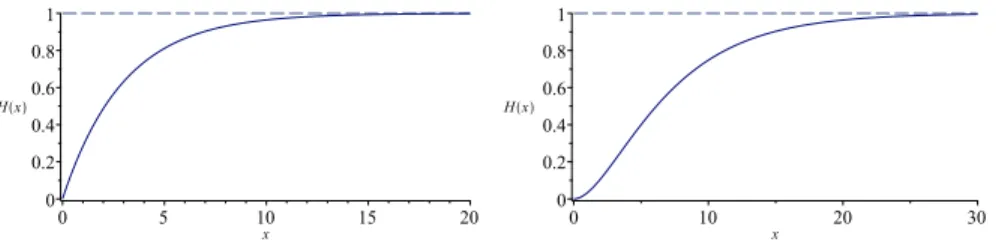
We will consider various cases where several alerts have been raised. The cases and the probabilistic results are displayed in Table 1. Only the MTTS is shown but, as in the precedent paragraph, the probability of occurrence after any duration can be computed. As a matter of fact, we have plotted the probability that event H happens for case 6 in Figure 6. All of the computations can be done beforehand or in real-time.
Table 1: MTTS associated with various cases Case Alerts raised MTTS
1 ∅ 3y 23min 27sec 2 A 23min 27sec 3 A, B 21min 13sec 4 A, B, E 20min 54sec 5 A, C, D 14min 54sec 6 A, B, C, D, G 7min 30sec
Having an evaluation of the MTTS depending on the raising of various alerts is a precious asset for a decision-maker. First, it is a metric that can be recom-bined with others, like the impact, in order to have an accurate assessment of the risk. Moreover, a safety/security supervisor might want to define a threshold under which the deployed countermeasures are different. Indeed, an impending undesired event may call for a response more effective, but with more negative side-effects.
Fig. 5: Evolution of the probabilities in case 1
Fig. 6: Evolution of the probabilities in case 6
With several different cases over one scenario, we have shown that the model adapts to real-time scenarios: the probabilities of the undesired events evolve over the realisation of subsequent ones. This is important because, for example, the choices of the attacker may change which are the most probable scenarios. And the appropriate response may differ depending on what parts of the system are at risk. Safety and security supervisors obtain precious information from the model in the form of probabilistic evaluations of the evolution of the failure/compromise rate.
5
Related work
FIGARO [7] is a versatile object language used to populate knowledge bases, later on used to model safety and security events through two kinds of rules: occurrence and interaction rules.
After the model has been defined using the FIGARO language, it is fed to the KB3 platform: a calculus engine. KB3 can not be used in real time to monitor the evolution and propagation of ongoing incidents. By using CRIM, our model is able to track which events have occurred. Their realisation changing the probabilities of possible undesired events, it is an important part of diagnosis.
[17] proposed a model based on Markov chains to compute MTTS (named MTTF in the paper). This model can only consider exponential distributions, which is understandable for security but not for safety. Moreover, with a model based on Markov chains, it can only consider transitions present in the model.
It is therefore impossible of analysing interleaved scenarios, since the scenarios will be modelled as disjoint Markov chains.
Bayesian networks is a popular model for safety modelling [18]. Notably, [19] had an interesting take on the matter. Like in our approach, they associated a random variable to each node of their Bayesian network. The random variable models the probability of failure of a component for a given duration. They also use the distributions associated with the random variable to compute failure rates for a scenario. However, they have to discretize the timespan they consider for their scenario, when we have a purely continuous approach, providing more accurate results.
6
Conclusions
In this paper, we presented an incident model responding to the needs and respecting the constraints of diagnosis. We proposed a graphical model of safety and security incidents, usable in real-time if need be, and able to track the realisation of events and updating itself accordingly. The model, considering concurrent events, is thus able to get the context in which alerts are raised, locating the problem. Through PDF embedded in each event, the model allows for a probabilistic evaluation of possible future events, as well as an estimation of the likelihood of occurrence of an event. This feature gives us both the possible reach of the incident and a way to measure the appropriateness of the model to the situation. We have illustrated the capacities of the model on an industrial use case.
With this usecase we have presented that it is possible to compute the like-lihood of one scenario. Since the model acknowledges for several scenarios, one can compute which is the most probable one, given a set of alerts. Or which are the five most probable one, with the information that the undesired events associated with these scenarios are safety or security events. Moreover, with the model keeping track of past events, it is able to give the origin of a scenario, and whether it was caused by failures, attacks, or both. The model is also able to evaluate the likelihood of an event by comparing its realisation time with references values in the form of a PDF that describes the realisation time. All of this is valuable information that helps to the diagnosis of an event, as well as represents a precious aid when deciding of the appropriate response to an incident.
The model is modular and easily extendible. That will incidentally be the object of future works in order to add a measure of the impact of an incident and its propagation to be able to assess the risk, as well as countermeasures. Acknowledgements
The Cyber CNI Chair of Institute Mines TELECOM is held by IMT Atlantique and supported by Airbus Defence and Space, Amossys, BNP Paribas, EDF, Orange, La Poste, Nokia, the Regional Council of Brittany and Soci´et´e G´en´erale. It has been acknowledged by the Center of excellence in Cybersecurity.
References
1. Vesely, W.E., Goldberg, F.F., Roberts, N.H., Haasl, D.F.: Fault tree handbook. Report, DTIC Document (1981)
2. Bruce, S.: Attack trees. Dr. Dobb’s Journal (1999)
3. Frigault, M., Wang, L., Singhal, A., Jajodia, S.: Measuring network security using dynamic bayesian network. In: Proceedings of the 4th ACM workshop on Quality of protection, 1456368, ACM 23–30
4. Kumar, S., Spafford, E.: A pattern matching model for misuse intrusion detection. (1994)
5. Bouissou, M., Bon, J.L.: A new formalism that combines advantages of fault-trees and Markov models: Boolean logic driven Markov processes. Volume 82. (2003) 6. Pi`etre-Cambac´ed`es, L., Bouissou, M.: Beyond attack trees: Dynamic security
mod-eling with boolean logic driven markov processes (bdmp). In: Proceedings of the 2010 European Dependable Computing Conference, 1827752, IEEE Computer So-ciety 199–208
7. Bouissou, M., Villatte, N., Bouhadana, H., Bannelier, M.: Knowledge modelling and reliability processing: presentation of the figaro language and associated tools. Report, Electricite de France (EDF) (December 1991)
8. Pernest˚al, A.: A Bayesian approach to fault isolation with application to diesel engine diagnosis. Thesis (2007)
9. Cuppens, F., Ortalo, R. In: LAMBDA: A Language to Model a Database for Detection of Attacks. Springer Berlin Heidelberg, Berlin, Heidelberg (2000) 197– 216
10. Cuppens, F., Mi`ege, A.: Alert correlation in a cooperative intrusion detection framework. In: Proceedings 2002 IEEE Symposium on Security and Privacy. 202– 215
11. Kanoun, W., Cuppens-Boulahia, N., Cuppens, F., Dubus, S., Martin, A.: Success likelihood of ongoing attacks for intrusion detection and response systems. In: 2009 International Conference on Computational Science and Engineering. Volume 3. 83–91
12. Schroeder, B., Gibson, G.A.: Disk failures in the real world: what does an mttf of 1,000,000 hours mean to you? In: Proceedings of the 5th USENIX conference on File and Storage Technologies, 1267904, USENIX Association 1
13. Cuppens, F., Autrel, F., Mi`ege, A., Benferhat, S.: Recognizing malicious intention in an intrusion detection process. In: HIS. 806–817
14. Rogers, J., M. Watkins, C.: OVERVIEW OF THE TAUM SAUK PUMPED STORAGE POWER PLANT UPPER RESERVOIR FAILURE, REYNOLDS COUNTY, MO. (2008)
15. Team, F.T.S.I.: Report of findings on the overtoppingand embankment breach of the upper dam - taum sauk pumped storage project,. Report (April 28 2006) 16. K., T., S., R., S., B.: Before the public service commission state of missouri - staff’s
initial incident report. Report (October 2007)
17. Dacier, M., Deswarte, Y., Kaˆaniche, M.: Quantitative assessment of operational security: Models and tools. Information Systems Security, ed. by SK Katsikas and D. Gritzalis, London, Chapman & Hall (1996) 179–86
18. Weber, P., Medina-Oliva, G., Simon, C., Iung, B.: Overview on bayesian networks applications for dependability, risk analysis and maintenance areas. Engineering Applications of Artificial Intelligence 25(4) (2012) 671–682
19. Boudali, H., Dugan, J.B.: A new Bayesian network approach to solve dynamic fault trees. (2005)