Université de Montréal
A multiscale framework for microbial evolution to identify
the emergence of antibiotic resistance
par Anh-Tien Ton
Département de Biochimie et Médecine Moléculaire Faculté de Médecine
Mémoire présenté
en vue de l’obtention du grade de M.Sc en Bio-informatique
Août 2018
i
Résumé
La résistance aux antimicrobiens (pharmacorésistance) est une crise sanitaire qui menace nos moyens pour contrôler les infections bactériennes. Nos progrès dans la médecine dépendent de nos habiletés à combattre les infections avec des antibiotiques. Ainsi, il est nécessaire de comprendre le mécanisme entourant l’évolution de la résistance aux antibiotiques. Prédire les trajectoires évolutives de la pharmacorésistance demeure une tâche ardue et urgente. Actuellement, notre capacité à prédire les voies d’évolution bactérienne vers la pharmacorésistance est limitée. Il implique de combler plusieurs contraintes sur différents niveaux d’organisation biologique – des propriétés moléculaires des protéines, l’aptitude des organismes et à la dynamique des populations microbiennes.
Dans ce mémoire, je développe un nouveau modèle multiscalaire pour l’évolution microbienne qui intègre principalement la génétique des populations avec la biophysique. Mon système modèle est la ß-lactamase qui concède une résistance contre une large gamme d’antibiotiques lactamines. Tout d’abord, je détermine le paysage d’aptitude de la ß-lactamase en utilisant le balayage mutationnel profond (DMS), un nouvel outil pour tester expérimentalement l’aptitude d’environ 5000 variantes de la ß-lactamase. Ensuite j’intègre ces données expérimentales dans mon modèle computationnel d’évolution microbienne pour étudier les voies évolutives envers la pharmacorésistance.
Dans le premier chapitre, je développe un modèle évolutionniste déterministe combinant la dynamique des populations et les effets biochimiques des mutations pour capturer les effets de la sélection purificatrice avec l’ampicilline. En raison des informations limitées qu’un modèle déterministe peut fournier, dans le deuxième chapitre, je bâtis sur le modèle initial en développant un modèle stochastique de l’évolution microbienne. Ce modèle mis à jour vise à déterminer les mutations qui pourraient être enrichies lors d’un traitement antibiotique. J’étudie également les régimes pour atténuer l’émergence de la résistance. Dans le troisième chapitre, je construis expérimentalement avec le DMS, le paysage d’aptitude de TEM-1 (Temoneira-1), une enzyme de la ß-lactamase pour déterminer son niveau de résistance et sa dépendance envers céfotaxime.
Mots-clés : Résistance aux antibiotiques, évolution, paysage d’aptitude, modèle évolutif, balayage mutationnel profond, coût d’aptitude
iii
Abstract
Antimicrobial resistance is an emerging health crisis that threatens our ability to control bacterial infections. Advances in medical treatments depend on the ability to fight infections with antibiotics. Thus, there is a need to understand the mechanism surrounding the evolution of antibiotic resistance. Predicting the evolutionary trajectories to drug resistance remains a daunting task and is urgently needed. Currently, our aptitude to predict pathways in bacterial evolution to drug resistance is limited. It entails bridging several constraints on various levels of biological organization—from molecular properties of proteins to organismal fitness, to microbial population dynamics.
In this memoir, I develop a new multi-scale framework for microbial evolution that integrates principally population genetics with biophysics. My model system is beta-lactamase that provides broad-spectrum resistance against beta-lactam antibiotics. First, I determine the fitness landscape of ß‐lactamase using deep mutational scanning, a novel tool to experimentally assay the fitness of around 5000 variants of beta-lactamase. Then, I integrate this experimental fitness landscape data into my computational model of microbial evolution to study the evolutionary pathways to drug resistance.
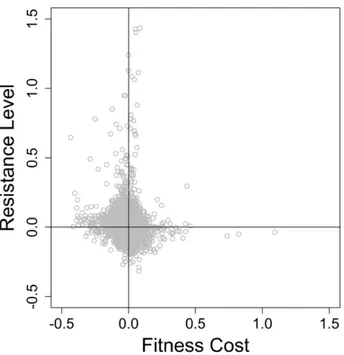
In the first chapter, I develop a deterministic evolutionary model combining population dynamics and the biochemical effects of mutations to capture the effects of purifying selection under selection with ampicillin. Due to the limited information that a deterministic model can provide, in the second chapter, I build upon the initial model to develop a stochastic model of microbial evolution. This updated model aims to determine mutations that might be enriched during antibiotic treatment. I investigate the landscape of fitness cost against resistance level. I also investigate drug regimens to alleviate the rise of resistance. In the third chapter, I experimentally determine with DMS the fitness landscape of TEM-1 (Temoneira-1), a ß-lactamase enzyme, to study its resistance level and its dose-dependence for cefotaxime.
Keywords: antibiotic resistance, evolution, fitness landscape, evolutionary model, deep mutational scanning, fitness cost
v
Table of Contents
Résumé ... i Abstract ... iii Table of Contents ... v List of Tables ... ix List of Figures ...xList of abbreviations ... xii
Acknowledgment ... xiii
Chapter 1: Introduction ... 1
1. Antibiotic resistance... 2
1.1 Emergence of antibiotic resistance ... 2
1.2 TEM-1 beta-lactamase ... 3
1.3 Fitness cost of resistance-conferring mutations ... 4
1.4 Current approaches to alleviate antibiotic resistance ... 5
2. Pathways to resistance on fitness landscapes ... 6
2.1 Hierarchy of constraints on the pathways to drug resistance ... 6
2.2 Fitness Landscapes and the Genotype-Phenotype relationship ... 7
2.3 Epistatic constraints on the pathways to drug resistance ... 10
2.4 Population dynamics constraints on the pathways to resistance ... 10
2.5 Current development of theoretical evolutionary models ... 11
3. Stochastic evolutionary models of population genetics ... 12
4. Experimental approach to determine fitness changes ... 14
4.1 Distribution of Fitness Effects ... 14
4.2 Deep mutational scan ... 15
Chapter 2: Problem and Specific Aims ... 17
Problem ... 17
Chapter 3: A deterministic evolutionary model for purifying selection ... 20
Methodology ... 20
Fitness landscape of TEM-1 β-lactamase under Amp selection ... 20
Deterministic evolutionary model algorithm for purifying selection ... 22
Analysis of the evolutionary trajectories ... 24
Comparison of fixed mutations from simulation with mutations enriched from clinical isolates and experimental laboratory evolution ... 24
Results ... 25
Evolution trajectories form clusters ... 25
Comparison with clinical isolates and with laboratory evolution ... 28
Discussion ... 30
Evolutionary trajectories follow three distinct growth rates ... 31
Blockbuster mutations dictate the trajectories’ behavior ... 32
Clinical isolates are not recapitulated in the additive fitness model ... 32
Enriched mutations from directed evolution are recapitulated in the additive fitness model ... 33
Summary of the deterministic evolutionary model ... 34
Chapter 4: Adaptive selection stochastic evolution model ... 35
Methodology ... 36
Tau-leaping to solve stochastic evolutionary models ... 39
Tau-Leaping Stochastic Solver ... 40
Stochastic evolutionary model algorithm for adaptive selection ... 40
Fitness landscape of TEM-1 β-lactamase under cefotaxime selection ... 42
Adaptive evolution simulations ... 43
Evolution trajectory analysis... 44
Model analysis ... 44
Oscillating treatment with different conditions ... 46
Results ... 47
vii
Performing evolutionary simulations with different time constants of drug administration
... 50
Determining the role of fitness cost in the evolutionary model ... 53
Survival probability of mutants and duration of antibiotic administration ... 57
Discussion ... 60
Fitness effects dictate the mutants’ evolutionary trajectories ... 61
Identification of resistant mutants from literature ... 61
Fitness cost decreases the overall quality of resistant strains in our model’s population . 62 Time spent in the regime with only fitness cost is key to alleviating resistance ... 64
Summary of the stochastic evolutionary model ... 64
Chapter 5: Fitness landscape of TEM-1 for cefotaxime ... 66
Methodology ... 66
TEM-1 WT recovery... 66
TEM-1 library primers design ... 67
TEM-1 comprehensive whole-gene saturation mutagenesis library ... 67
Nicking Mutagenesis: comprehensive single-site saturation mutagenesis ... 67
TEM-1 library selection assays ... 70
TEM-1 Illumina sequencing ... 71
NGS analysis ... 71
Results ... 72
TEM-1 selection assays ... 72
NGS analysis ... 73
Simulations with our own dataset ... 75
Discussion ... 80
Our TEM-1 fitness landscape is incomplete ... 80
Our TEM-1 fitness landscape does not cover a large dynamic range ... 81
No correlation between our fitness landscapes following simulations ... 82
Issues to solve for the TEM-1 fitness landscape ... 82
Chapter 6: General discussion ... 83
Fitness cost and its role in alleviating resistance ... 84
Phase-space of resistance to design an optimal drug dosage regimen ... 84
Limitations in our current evolutionary models... 85
Chapter 7: Conclusions ... 87
Bibliography ... 89
Appendix 1: TEM-1 WT Recovery Protocol ... i
Appendix 2: Nicking mutagenesis protocol for TEM-1 ... v
ix
List of Tables
Table I. Clinical isolates and enriched mutations for TEM-1 under Amp selection. . 25 Table II. The p-values for enriched mutations and clinical isolates were calculated with a two-sided KS-test in the first cluster... 30 Table III. Clinical isolates and laboratory evolution mutations for TEM-1 under Cfx selection. ... 46 Table IV. Resistance level and fitness cost of the most common mutations observed in clinical isolates... 53 Table V. Average fitness effects for the stochastic simulations to study the effects of fitness cost. ... 57 Table VI. Mutation comparison between simulation and experiments... 79 Table VII. Primers used to prepare the Tile 1 samples for NGS. ... xii
List of Figures
Figure 1. Mechanisms of resistance acquisition. ... 3
Figure 2. Hierarchy of constraints in evolution. ... 7
Figure 3. Evolutionary pathways on the fitness landscapes. ... 9
Figure 4. Distribution of fitness effects of new mutations. ... 15
Figure 5. Overview of deep mutational scanning. ... 16
Figure 6. Comprehensive fitness landscape of β-lactamase under Amp selection. ... 21
Figure 7. Algorithm for the deterministic evolutionary model. ... 23
Figure 8. Trajectories from the deterministic evolutionary model form three distinct clusters. ... 27
Figure 9. Clinical isolates and enriched mutations observed in the fast adaptation cluster. ... 28
Figure 10. Resistance level against fitness cost mapping. ... 36
Figure 11. Moran model: a stochastic evolutionary model. ... 37
Figure 12. The Moran model consists of a birth-death process. ... 39
Figure 13. Algorithm for the stochastic evolutionary model. ... 42
Figure 14. Comprehensive fitness landscape of TEM-1 under cefotaxime selection. . 43
Figure 15. Trajectories from the stochastic evolutionary model form three distinct clusters. ... 48
Figure 16. Survival probability in oscillating antibiotic concentration depends on the trade-off between resistance level and fitness cost. ... 50
Figure 17. Evolutionary trajectories using different time constants. ... 51
Figure 18. Count of mutants reaching the 50% threshold after 24 h and 48 h. ... 52
Figure 19. Evolutionary trajectories without fitness cost in the simulations. ... 54
Figure 20. Mutant count following 48 h evolutionary simulations with fitness cost (FC) and without FC. ... 56
Figure 21. Phase-space of TEM-1 resistance to cefotaxime. ... 59
xi
Figure 24. NGS analysis of TEM-1 under cfx selection. ... 74 Figure 25. Correlation between experimental fitness landscapes. ... 75 Figure 26. DMS datasets of TEM-1 from our continuous experiments and single selection assays. ... 76 Figure 27. Correlation between relative fitness effects and probability of survival. .. 78 Figure 28. Alignment between the recovered TEM-1 WT strain and the p-salectnk TEM-1 plasmid... iv
List of abbreviations
AMR: Antimicrobial resistance Amp: Ampicillinbp: base pair Cfx : Cefotaxime
DFE: Distribution of Fitness Effects DMS: Deep mutational scan
DNA: Deoxyribonucleic acid FC: Fitness Cost
HGT: Horizontal Gene Transfer LB: Lysogeny broth (Luria broth) MIC: Mean Inhibitory Concentration Mut: Mutant
NGS: Next-Generation Sequencing OD: Optical density (600)
PCR: Polymerase Chain Reaction RL: Resistance Level
RNA: Ribonucleic Acid Tau (τ): Time constant TEM: Temoneira Tet: Tetracycline WT: Wild-type
ATP: Adenosine triphosphate PNK: Polynucleotide Kinase NFH2O: Nuclease-Free Water
dNTPs: Deoxynucleoside triphosphate DMSO: Dimethyl sulfoxide
xiii
Acknowledgment
I would first like to thank my supervisor, Adrian Serohijos for giving me the chance to join his group and believing in me and my potential when others did not. I would not be where I am today without his help and guidance. I am grateful to all members of the Serohijos lab for their help throughout my Masters: Yun Zhu and Christopher Savoie for teaching me the experimental aspects of research; and Pouria Dasmeh and Sebastien Boyer for discussing theoretical questions. Without their valuable help, I would have never accomplished what I did during my Masters. I would finally like to thank my family and friends for their support throughout the challenging times endured during my studies. Their support allowed me to push through to complete my work and my memoir.
Chapter 1: Introduction
The discovery of antibiotics is one of the most important medical advances that lead to the reduction of human mortality and morbidity (Andersson et al., 2010). Antibiotic resistance can be described as the ability of microorganisms to survive the drugs designed to eradicate them (Ventola, 2015). Our understanding of the mechanisms behind the evolution of resistance remains incomplete. As such, the emergence of multiple drug resistance in patients has proven difficult to efficiently treat (Higgins, 2007). One possible treatment to alleviate resistance is to reduce the use of antibiotics (Melnyk et al., 2015). This strategy exploits the fitness cost imposed by the evolution of resistance-conferring mutations to purge them out of a population. Thus, the existing approaches to mitigate resistance depend on our understanding of the evolution of resistance.
To gain a better understanding of the evolution of antimicrobial resistance, we developed a stochastic evolutionary model to study the dynamics of resistance-conferring mutations. The stochastic evolutionary model is built by combining theories from biophysics, such as epistasis (Serohijos and Shakhnovich., 2014), and from population genetics, such as effective population size (Charlesworth, 2009). This theoretical model provides valuable insight into the evolutionary pathways to drug resistance. The emergence of resistance is often described as a pathway. This pathway to resistance consists of a set of mutations fixing in a population, leading to resistance (Hall, 2002). Evolutionary pathways are commonly studied by constructing the appropriate fitness landscapes of resistance. Consequently, an accurate construction of the fitness landscape of resistance is critical to increase the accuracy of our models and to study the emergence of resistance.
One of the new methods to construct the fitness landscapes of proteins that confer resistance is deep mutational scanning (Fowler and Fields, 2014). This technique combines library mutagenesis, selection, and next-generation sequencing to assay several thousands of mutational variants. The fitness landscapes constructed from the deep mutational scan can be
2
introduce the concepts of the emergence of antibiotic resistance and how to study the pathways to resistance on fitness landscapes. We also introduce experimental approaches to determine fitness landscapes of resistance.
1. Antibiotic resistance
1.1 Emergence of antibiotic resistance
Antimicrobial resistance has become an emerging problem in healthcare and is among the major causes of mortality and morbidity in clinical settings throughout the world (Guo, 2012). Because of antibiotic-resistant strains, there are fewer antibiotics that can effectively treat infections (Maharjan, 2017). The emergence of antibiotic-resistant strains is partially due to the widespread use of antibiotics in healthcare and agriculture industries (Chang et al., 2015). This increased exposure to antibiotics constitutes a strong and persistent selective pressure for the evolution of resistant strains in a population (Andersson, 2010).
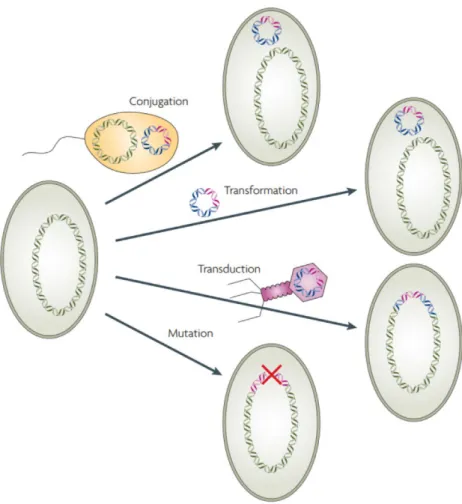
There are also multiple other mechanisms that could lead to the emergence of resistance in a population. The emergence of antibiotic resistance can occur from de novo mutations or other types of genetic changes. The most common mutations for resistance alter antibiotic targets or increase drug efflux rates, but mutations have also been observed to affect gene amplification and to reduce the expression of the antibiotic target (Melnyk et al., 2015). Another important mechanism for a bacterium to acquire resistance is through horizontal gene transfer (HGT) of resistance cassettes between microbes (Sundqvist, 2014, Melnyk et al, 2015). HGT mechanisms include drug modification enzymes, antibiotic target protection, replacement of drug targets, and acquisition of new efflux pumps to clear out the drugs (Andersson and Hughes, 2010, Robicsek et al., 2006). The most common mechanisms for acquiring resistance are presented in Figure 1.
Figure 1. Mechanisms of resistance acquisition.
An antibiotic resistance gene (pink) can be transferred by horizontal gene transfer to another strain by multiple paths: cell-to-cell conjugation, the transformation of DNA, phage-mediated transduction. Resistance mutations can also arise de novo in the new organism. (Adapted from Andersson and Hughes, 2010)
1.2 TEM-1 beta-lactamase
Beta-lactam antibiotics, such as penicillin – the first antibiotic developed, were commonly used to treat bacterial infections. This treatment proved to be efficient until bacteria developed resistance to first-generation beta-lactams antibiotics (Kong et al., 2011). Bacteria developed resistance against lactam antibiotics by producing lactamases. TEM-1, the first beta-lactamase enzyme identified, degrade these antibiotics by hydrolyzing the beta-lactam ring
4
resistance against beta-lactams. To counteract the growing problem of TEM-1 producing bacteria, newer beta-lactams antibiotics were developed (Shaik et al., 2015). However, antibiotic resistance emerged against these alternative antibiotics with the appearance of modified beta-lactamases (Shaik et al., 2015). The development of novel antibiotics gave rise to TEM variants with different amino acid sequences that confer different resistance phenotypes (Salverda, 2010). TEM-3, one of the first derivatives of TEM-1, had a single amino acid substitution and is carried by a plasmid which encodes a gene responsible for a new ceftazidime resistance (Shaik et al., 2015). These derivates of TEM-1 likely evolved long ago, but they emerged when faced against these new drugs. Due to a large number of beta-lactam antibiotics, beta-beta-lactamases cover a wide spectrum of resistance and confers good resistance against second, third, and fourth-generation of beta-lactamase inhibitors. Because of the current extensive knowledge and detailed description of the natural evolution of TEM alleles, TEM-1 has been a frequent target to study the emergence of antibiotic resistance.
1.3 Fitness cost of resistance-conferring mutations
Although there have been numerous interpretations of fitness, fitness is generally understood as the ability of organisms to survive and reproduce in their environment. Surviving organisms reproduce and contribute to the gene pool of subsequent generations. Consequently, fitness is a measure of an organism’s reproductive abilities and reflects its adaptive capabilities in a specific environment. Following that definition, the fitness of a resistant mutation determines its survival in a population under selective pressure (Orr, 2009). Resistance level is the fitness of a protein under prevailing antibiotic selection environments (Melnyk et al., 2015). Acquisition of a resistance mutation might increase the resistance level, but it can also impose a fitness cost on the organism (Sundqvist, 2014). Fitness cost is defined as the reduced competitive ability of a mutant in the absence of antibiotics (Vogwill et al., 2015). Many antibiotics target important biological processes, and resistance to them imposes large energetic burdens and metabolic costs that reduce competitive ability against antibiotic-sensitive strains (Andersen, 2006; Melnyk, 2015). Because of fitness cost, strains that contain resistant mutations may be depleted in the population when the antibiotic is not present.
It is believed that antibiotic-susceptible strains will competitively eliminate the resistant strains in selection-free environments unless the resistant ones acquire mutations that can compensate for this fitness cost (Maharjan et al, 2017). This fitness loss by the resistant mutants is reflected by numerous changes in functional roles, such as reduced growth rate, reduced transmission rate, higher clearance rate, or decreased invasiveness in the absence of antibiotics (Schulz, 2010). Therefore, resistant mutations are more likely to persist in the absence of antibiotic pressure if they suffer little or no fitness cost. Mutant strains that do not pay a cost or very little cost for their resistance have a higher chance to replace other resistant strains (Johnsen, 2009). Thus, determining the extent of fitness cost and how to modulate it are key to determine the strategies to alleviate the emergence of resistance (Schuzl, 2010).
1.4 Current approaches to alleviate antibiotic resistance
There are several potential strategies to address drug resistance, such as multidrug therapy. Multidrug therapy consists of prescribing a combination of different drugs to a patient when resistance has emerged (Perron et al., 2012). Another approach is by exploiting fitness cost (Sundqvist, 2014). The magnitude of fitness cost is one of the primary factors that increases the development of resistance, but it can also decrease resistance when antibiotic is absent (Guo, 2012). Fitness cost can be exploited to introduce competition between antibiotic-susceptible strains and resistant strains (Lipsitch et al., 2000). Antibiotic-antibiotic-susceptible strains are free from fitness costs and therefore can potentially outcompete resistant strains in a selection-free environment. Exploiting fitness cost by reducing antibiotic use is a viable approach to alleviate resistance.
Nevertheless, reducing antibiotic use once resistance has emerged, has not always been effective at alleviating resistance (Sundqvist, 2010). There are two main hypotheses for the persistence of resistant strains in the absence of antibiotics – genetic linkage, and pleiotropic cost (Andersson, 2010).
6
Compensatory mutations counteract the effects of fitness costs incurred by resistance mutations. The presence of compensatory mutations might prevent genetic reversions of the resistant genes. Both the resistance genotype and the compensatory genotype individually may confer an overall lower fitness than the combined genotype. Therefore, the resistant-compensated genotype cannot revert back the wild-type genotype (Schulz, 2014).
2. Pleiotropic cost is defined as the effects of ancestor genes on the fitness of resistant mutants (Melnyk et al., 2015). Resistance mutations have highly variable pleiotropic costs. Therefore, they may inherit a fitness that is indistinguishable from their antibiotic sensitive ancestor and become “no-cost” mutations. (Andersson, 2003, Melnyk, 2015). These mutations will persist in an antibiotic-free environment as there is no selective pressure against them.
Fitness cost remains a crucial factor in preventing and reverting resistance development. Newer antibiotics could exploit fitness cost by targeting strains for which resistance mechanisms confer a high fitness cost and a low compensation system (Andersson, 2010). There is a need to better understand the biological mechanisms behind fitness cost and how to incorporate them in our quantitative models of antibiotic resistance evolution.
2. Pathways to resistance on fitness landscapes
2.1 Hierarchy of constraints on the pathways to drug resistance
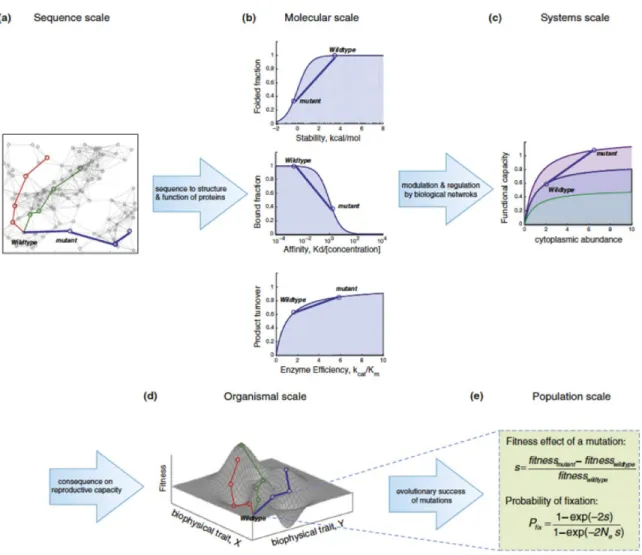
Mutational pathways to adaptation, including antibiotic resistance, are influenced by numerous constraints at distinct levels of biological organization, as presented in Figure 2. However, there is an incomplete understanding of the pathways to antibiotic resistance as these constraints are traditionally studied separately (Serohijos et al., 2014; Harms and Thornton., 2013; Wilke et al., 2012). The mutational pathways to resistance are defined by the mapping between microbial fitness and the molecular properties of the target gene. This mapping is referred to as the fitness landscape.
Figure 2. Hierarchy of constraints in evolution.
Combining fitness with the biophysical properties of macromolecules will better shape the genotype-phenotype map (fitness landscape). A. Effect of sequence variation on the phenotype. B. The relationship between biophysical traits and fitness effects of the organism. C. The effects of mutations are regulated by biological networks. D. Fitness landscape built on biophysical properties. E. Importance of population genetics in the construction of fitness landscapes, such as the selection coefficient and the probability of fixation. (Adapted from Bershtein et al., 2016).
2.2 Fitness Landscapes and the Genotype-Phenotype relationship
8
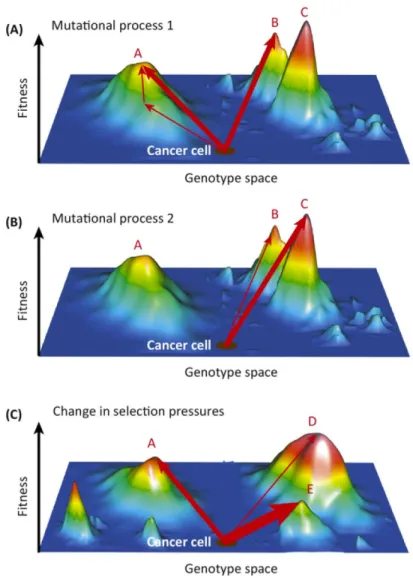
fitness could be any measure of reproductive success (e.g. growth rates) or any phenotypes (e.g. drug resistance). Such maps define feasible combinations of mutations (“the mutational pathways”) towards drug resistance (Hartl, 2014). These evolutionary pathways are dictated by the molecular mechanisms revealed by the landscape. A sample fitness landscape with the evolutionary pathways for the evolution of cancer is presented in Figure 3.
Consequently, evolutionary pathways are represented as walks on the fitness landscape. Walks around the map represent evolution with small changes to fitness, and climbs on top of fitness peaks represent adaptation and increased fitness (Visser et al., 2014; Wright, 1932). A landscape based on resistance can be used to predict paths to fitter genotype or resistance (Weinreich, 2006). However, apart from knowing the fitness landscape, several other constraints that affect the mutational pathways to drug resistance need to be taken into consideration. These include epistasis and the population dynamics of the evolving microbial population. Previous theoretical evolutionary models have considered the importance of accounting for these constraints, and have been successfully implemented to study evolution. Therefore, the inclusion of these parameters is not a novelty in the field of evolutionary models. However, these approaches have not been used to study emergence of antibiotic resistanc. Current evolutionary models will be further discussed in section 2.5.
Figure 3. Evolutionary pathways on the fitness landscapes.
Evolutionary pathways of resistant mutations are influenced by the shape and accessibility of fitness peaks on the landscape. The vertical axis represents the fitness level of all genotypes. A. A specific set of mutations is allowed to climb to peak A or B which confers resistance. B. A different set of mutations which are constrained by biophysical traits or population genetics are only allowed to move to peak B or C. C. A change in selective pressure such as a different antibiotic, shifts the fitness landscape and new resistance peaks are formed. Although all pathways in A, B, and C reach resistance, they are constrained to take a different set of mutations (pathways) to reach a fitness peak. (Adapted from Lipinski et al., 2016).
10
2.3 Epistatic constraints on the pathways to drug resistance
Protein biophysics properties such as folding stability, solubility, and maintenance of functions, impose constraints on the evolutionary pathways leading to drug resistance (Serohijos and Shakhnovich, 2014). However, predicting and reproducing the pathways to resistance is much more complex due to molecular epistatic constraints. Epistasis is broadly defined as the composition of a genotype and the influence that this specific genetic background has on a set of alleles (Phillips, 2008). Consequently, the phenotypic effect of a mutation at one genetic site can change, depending on which alleles are present at other sites. The mutations, in this case, depend on the evolutionary background of the population, and epistasis can greatly influence evolution in populations. Therefore, for some of the resistance-conferring mutations, they are dependent on the genetic background from which they arise. Importantly, epistasis suggests that the order of mutations in the evolutionary pathway is crucial, and the effects of mutations are not always simply additive (Weinreich, 2006). The ruggedness and curvature of the fitness landscape influence epistatic effects on the pathways; therefore, the population may need to traverse low fitness valleys to reach fitness peaks. Consequently, accurately identifying the role of molecular epistasis in evolution is critical to determine the potential pathways taken by populations on the fitness landscape (Breen et al., 2013).
2.4 Population dynamics constraints on the pathways to resistance
Population size is another major constraint on the types of mutational pathways that can arise in the evolution of antimicrobial resistance. Population size (Ne) is a core concept in both
evolutionary biology and population genetics as it tunes the balance between selection and mutational drift (Charlesworth, 2009). The force of selection is proportional to the population size. In large populations, mutations with slightly beneficial or deleterious effects can reach fixation or escape genetic drift, thus allowing the mutants to outcompete the wild-type. In small populations, only mutations with strong selection coefficients will fix in the population, as the effects of genetic drift are significantly more intense. In the case where there is only a single individual in a population (Ne=1), there is no competition and there is no selection. All
mutations, deleterious or beneficial, can be fixed. The role of population size in the probability of fixation is formalized by the classic Kimura formula, shown in Figure 2E, derived for the simple case of a monoclonal population (Kimura, 1968).
In general, the following forces need to be considered for the evolution of a biological system: i. Natural selection is the process in which alleles for fitter organisms become more
frequent in a population as they survive and reproduce, consequently transmitting their alleles to the next generation (Andrews, 2010). The selection coefficient s is often used to quantify the differences in fitness between different genotypes (Hartl et al., 2007). ii. Mutation is the process in which new alleles appear in the genome. Mutations can
either be deleterious, beneficial, or neutral. Deleterious mutations result in the death or deformation of the organism, while beneficial mutations profit the organism by making it fitter. Mutations are not necessarily a binary process, but instead cover a wide distribution as there exist other mutations, such as neutral mutations (Eyre-Walker et al., 2007).
iii. Genetic drift is the process in which allele frequency is changed due to random sampling. Genetic drift has a higher impact on smaller population size, as the involved allele is either lost or fixed in the population at a faster rate (Kliman et al., 2008). The level of variability in a population and the effect of selection relative to drift can be determined through the effective population size. (Charlesworth, 2009).
2.5 Current development of theoretical evolutionary models
Presently, there exist numerous evolutionary models integrating the various molecular, biophysical and population dynamics constraints to provide valuable insight into the process of evolution. Sailer and Harms developed an evolutionary model considering epistatic constraints (Sailer and Harms, 2017). They studied the role of high-order epistasis by creating a model that would remove epistasis from fitness landscapes. They generated two sets of evolutionary pathways, ones from the fitness landscapes with epistasis, and ones from their computational fitness landscapes without epistasis. Using their model, they determined that
12
epistasis, not the order itself. Interestingly, these findings were contrary to previous experimental work performed by Weinreich (2006). Nonetheless, they arrived at the same conclusion from their simulations that epistasis and interactions between mutations strongly shape the evolutionary trajectories on fitness landscapes.
Another model has been developed by Meyer and Wilke, integrating protein structure and sequence variation constraints (Meyer and Wilke, 2013). Their model was used to identify resistance sites in neuraminidase under oseltamivir selection. They demonstrated that using structural information with protein sequences can be a powerful predictive tool to identify sites of interest in resistance. They observed that the accuracy of their model for specific proteins improved significantly by considering the biophysical aspect of solvent exposure. Their model provided additional accurate evolutionary information on the resistance mutation sites.
There also exist other evolutionary models integrating multiple constraints simultaneously. The model combining protein biophysics and population dynamics constraints (Serohijos and Shakhnovic, 2014) was used to determine the effects of selection for protein folding stability on the patterns of evolutionary forces in coding regions. In a similar fashion, a model combining population genetics with simple biophysical protein folding (Wylie and Shaknovich, 2011) was used to study the interplay between biophysical and population genetic forces on the shape of the distribution of fitness effects.
Therefore, although there exist a few evolutionary models combining the various molecular and population genetics constraints, we aim to integrate these parameters as a novel approach to specifically elucidate the emergence of resistance on fitness landscapes.
3. Stochastic evolutionary models of population genetics
Our ability to study the genetics of populations depends on our capacity to accurately construct models that capture the essential biological features of populations. A deterministic model of evolution was implemented by Dieckmann and Law in 1996. They identified a deterministic approximation of the stochastic evolutionary process and demonstrated that
evolutionary dynamics can be represented as directed random walks on adaptive landscapes. From their model, they showed that evolutionary paths are equivalent to hill-climbs on landscapes (Dieckmann and Law, 1996). However, their models provide limited insight into the process of mutant selection in a population, as advantageous mutations will always fix in a deterministic model (Nowak, 2006). This is not always the case in nature. In stochastic models, beneficial mutations are not always guaranteed to reach fixation, and there is always a risk of extinction for the mutant. Stochastic models can, therefore, provide additional understanding of actual population evolution.
There are two primary stochastic population genetic models used throughout most studies: The Wright-Fisher model and the Moran model. The Wright-Fisher model represents a population of non-overlapping generations while the Moran model represents a population of overlapping generations (Wakeley, 2008). A population is said to evolve under the Moran process if it satisfies three conditions: the population remains at a constant size N; generations can overlap; and at discrete time intervals, two individuals are chosen randomly to undergo the birth-death process (Nowak, 2006). The model of interest to this memoir is the Moran model. It can replicate the effects of neutral drift, and the probabilistic dynamics of two alleles competing for dominance at populations of finite size (Wakeley, 2008). Studies implementing the stochastic Moran process to elucidate evolutionary dynamics has already been published previously (Muirhead and Wakeley, 2009; Harper and Fryer, 2016). Their Moran model approaches provide the means of modeling a wide variety of fitness schemes. They demonstrated that the Moran model is not strongly dependent on approximations, and therefore this stochastic process can be applied to study evolution requiring population parameters such as selection and effective population size. Thus, we will be using these principles in constructing our stochastic evolutionary model. It will be used to study the emergence of resistance in populations. Our Moran model based on population parameters will be further described in Chapter 4.
14
4. Experimental approach to determine fitness changes
4.1 Distribution of Fitness Effects
Antibiotic pressure imposes changes on a population and selects for diverse types of mutants in a population, such as resistant mutants. The Distribution of Fitness Effects (DFE) is defined as the spectrum of changes on the fitness of an organism upon genetic perturbations (Eyre-Walker, 2007). The DFE can be used to study the range of mutations observed in a selective environment (Martinez et al., 2000). The DFE is mainly composed of three mutations: beneficial, neutral, and deleterious. Beneficial mutations in the DFE are of special interest as they can potentially confer resistance.
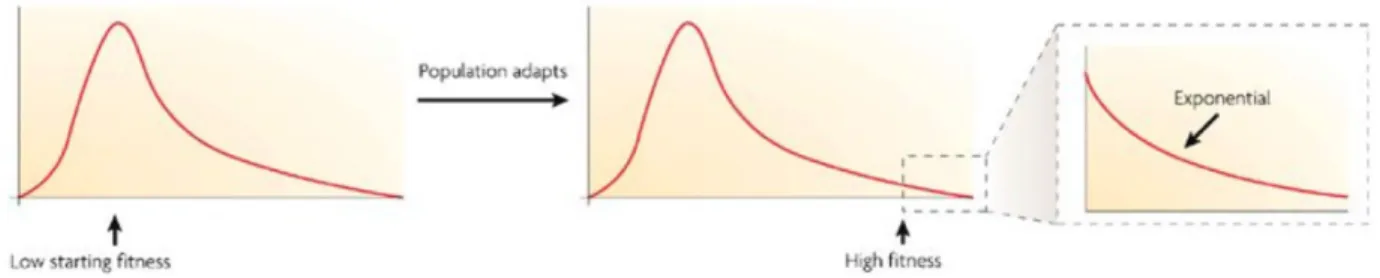
Beneficial mutations are the rarest ones, but they also have the highest impact on the fitness of the organism (Silander et al., 2007). When these mutations are selected for fixation, they contribute substantially to adaptive evolution and reduce genetic diversity (Eyre-Walker, 2006). The small number of beneficial mutations shapes the DFE into an exponential tail (Orr, 2003). The DFE becomes increasingly like an exponential distribution as the population evolves, and strongly advantageous mutations are selected for fixation (Sanjuan et al., 2004, Eyre-Walker et al., 2007). The exponential tail of the DFE for beneficial mutation is represented in Figure 4. The spectrum of selective effects defined by the DFE is critical to determine the type and frequency of mutations fixing in the population. Due to its importance, there are multiple experimental methods to quantify the DFE, such as deep mutational scan – defined in the next section.
Figure 4. Distribution of fitness effects of new mutations.
The population (represented by the black arrow) starts at a state of low fitness and evolves to a state of high fitness. As the DFE remains constant through evolution, the DFE for advantageous mutations available to the population becomes exponential towards the right-hand tail of the distribution. (Adapted from Eyre-Walker, 2007).
4.2 Deep mutational scan
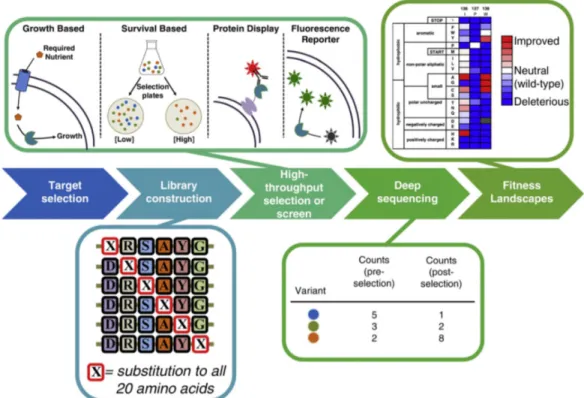
Deep mutational scanning (DMS) is a new high-throughput approach to comprehensively measure a fitness landscape. It combines saturation mutagenesis, selection, and high-throughput DNA sequencing to assay the functional effects of several thousands of mutations on a protein (Fowler et al., 2010; Fowler et al., 2014). DMS can be used to produce a high-resolution, fine-scale map of protein sequence-function relationships (Fowler et al., 2014). The framework for a DMS is presented in Figure 5. This approach generates large-scale mutagenesis datasets containing a functional score for each mutation variant. A large dataset of mutations renders the task of profiling their functional effects on proteins much more manageable and eases the prediction of mutation progression. By performing DMS in the presence of a drug, it is possible to generate a nearly complete map of resistance to the specific drug (Fowler et al., 2010). The map is useful to guide the development of drug treatments to alleviate the emergence of resistance.
16
Figure 5. Overview of deep mutational scanning.
Deep mutational scanning can be used to assess the functional consequences of all mutant variations in a protein. A comprehensive mutagenesis library of a protein of interest is constructed. The library is subjected to high-throughput selection or screen for function. Variants are counted via deep sequencing. Fitness landscapes are built from the normalized functional score obtained from sequencing. (Adapted from Wrenbeck et al., 2017).
Chapter 2: Problem and Specific Aims
Problem
Understanding the emergence of resistance in microorganisms is an urgent problem in medicine and public health. Due to resistance, the inefficacy of first-line and second-line antibiotic treatments is forcing healthcare specialists to use stronger drugs that may potentially be toxic to patients (Ventola, 2015). The rise of resistance prevents the effective treatment of common infectious diseases caused by bacteria, parasites, viruses, and fungi, resulting in prolonged illness, or even death. Therefore, there is a need to predict and identify the emergence of resistance. Currently, determining the first passage time of resistance by analyzing the evolutionary trajectories on fitness landscapes might be possible, as demonstrated by numerous groups (Hartl, 2014; Palmer et al., 2013; Poelwijk et al., 2007; Martinez et al., 2007; Rodrigues et al., 2016). Here, we define the first passage time of resistance as the event where the stochastic process of evolution encounters its first resistance-conferring mutation. The emergence of resistance is often described as a specific series of mutations an organism acquires. If we can retrace those trajectories, we could potentially identify the first mutations arising in resistance.
There are only a few studies that combine biophysics and population genetics to study evolution (Wylie and Shakhnovich, 2011; Serohijos and Shakhnovic, 2014). These approaches have certain limitations due to the robustness of genotype-phenotype relationships and quantitative disagreements between models and experiments. Although these limitations hamper model accuracy and predictivity, solving these limitations is outside the scope of this memoir. Nonetheless, these models provide valuable approximations to study evolution, but they have not been applied to study the emergence of resistance. Consequently, the application of evolutionary models and theories to the resistance problem is largely unknown. The role and contribution of molecular biophysics and population genetics to the emergence of resistance remains unclear. Therefore, elucidating their role would be greatly beneficial to our capacity to fight resistance. Integrating both distinct and non-interacting disciplines could
18
we are using concepts from theoretical evolutionary studies to investigate the real-world crisis of drug resistance.
Aims
In this memoir, we will combine techniques from biophysics and biochemistry with principles from evolutionary biology and population genetics to develop a framework to study drug resistance. This framework will combine theory and experiment to predict the near-term evolution of resistance against β-lactamase enzymes, the primary targets of several antibiotics. One of the core concepts borrowed from previous evolutionary models is the principle that fitness landscapes (genotype-phenotype mapping) and evolutionary pathways can be used to study the progress of a population towards resistance. Therefore, we aim to use fitness landscapes with the evolutionary models derived from population genetics to construct the framework of a new multiscale evolutionary model used to predict the emergence of resistance. The models can also be used to further establish the link between experimental fitness landscapes and theoretical evolutionary models.
1. The first objective is to develop an evolutionary model that integrates principally population genetics constraints. We first determine the possibility to relay the initial passage time to resistance acquisition on the fitness landscape. More importantly, we seek to integrate the theoretical work on evolution to experimental results of fitness landscapes.
2. The second objective consists of determining the contribution of fitness cost on the survivability – the ability to remain alive, of resistant mutants. Using the evolutionary model developed in the first objective, we study the role and the clinical relevance of fitness cost in resistance. We determine the relationship and dependency between fitness cost and resistance level.
3. The third objective is to determine the fitness landscape of TEM-1 under cefotaxime selection. By constructing the fitness landscape of TEM-1, we can study the resistance level and dose-dependence for cefotaxime. Cefotaxime is a β-lactam
antibiotic and is part of the third-generation class of cephalosporins. It is often used to treat penicillin and penicillin-derivate resistance (Ma et al., 2002). Therefore, our fitness landscape can be used to test the evolutionary model and to study the emergence of cefotaxime resistance in TEM-1.
The development of a multi-scale framework for microbial evolution will provide insight into the quantitative relationship between the biochemical properties of the target gene, selection regimes, population dynamics, and, more importantly, the first passage time to drug resistance.
20
Chapter 3: A deterministic evolutionary model for
purifying selection
In this chapter, we determine the potential pathways for the emergence of resistance in TEM-1 β-lactamase. We relate the biochemical effects of mutation on target genes with the population demography and the selection regime (drug dosage) experienced by the bacteria. We propose a deterministic evolutionary model of additive fitness. We use the model to investigate the underlying molecular mechanism for the emergence of resistance. We determine if the selection coefficients of resistant mutants are sufficient to recapitulate the beneficial mutations observed in the literature. Using the model, we found that in the context of purifying selection, comprehensive fitness landscapes capture a large fraction of enriched mutations retrieved from the literature. Nonetheless, our deterministic model of additive fitness does not fully capture the pathways to resistance.
Methodology
Fitness landscape of TEM-1 β-lactamase under Amp selection
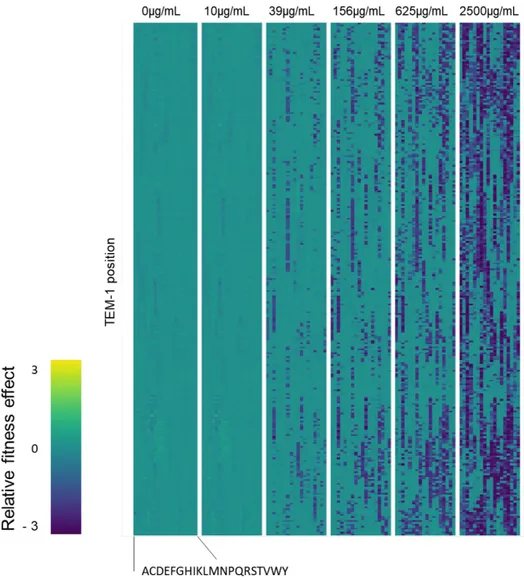
Our deterministic evolutionary model requires fitness landscapes as input. To construct the comprehensive fitness landscape of TEM-1 β-lactamase under ampicillin (Amp) selection, we used the DMS dataset from Stiffler et al. (2015). Their dataset consists of the relative fitness effects for all single amino acid mutations in TEM-1 under selection for several concentrations of Amp. To generate this dataset, they constructed a whole-gene saturation mutagenesis library of TEM-1. Their library was screened on a growth and survival basis in different selection conditions, followed by next-gen sequencing. The relative fitness for each TEM-1 variant is defined as:
where the relative fitness 𝐹𝐹𝑖𝑖𝑎𝑎 of each amino acid mutation a at each position i is determined as the logarithm in the allele counts (N) between the selected population (𝑁𝑁𝑖𝑖𝑎𝑎,𝑠𝑠𝑠𝑠𝑠𝑠) and the unselected population (𝑁𝑁𝑖𝑖𝑎𝑎,𝑢𝑢𝑢𝑢𝑠𝑠𝑠𝑠𝑠𝑠), relative to the wild-type allele. Their DMS of TEM-1 under Amp selection is presented in Figure 6.
Figure 6. Comprehensive fitness landscape of β-lactamase under Amp selection. Each DMS represent the relative fitness of mutants in specific Amp selection conditions. Each row represents a TEM-1 position, and each column is one of the twenty possible amino acid mutation. Beneficial mutations are highlighted in yellow while deleterious mutations are highlighted in blue. We use the 2500 μg/mL Amp set for our simulations. (Adapted from Stiffler et al., 2015).
22
Deterministic evolutionary model algorithm for purifying selection
The model consists of a computational workflow to replicate evolutionary pathways on a fitness landscape. We simulated the evolution of the TEM-1 library under constant selection at 2500 μg/mL Amp. The effective population size Ne was set to 106 individual cells. The model
replicates purifying selection as we iteratively remove deleterious alleles from the pool of available mutations. An initial protein variant with low fitness is selected as the starting point for the simulations and is defined as 𝐹𝐹𝑐𝑐𝑢𝑢𝑐𝑐𝑐𝑐𝑠𝑠𝑢𝑢𝑐𝑐. Another mutation is then randomly selected from the dataset as a mutational attempt and is defined as 𝐹𝐹𝑎𝑎𝑐𝑐𝑐𝑐𝑠𝑠𝑎𝑎𝑎𝑎𝑐𝑐. To determine if the mutation was fixed and retained, we calculated its selection coefficient with Eq. 2:
(Eq. 2)
where the fitness for the initial strain is 𝐹𝐹𝑐𝑐𝑢𝑢𝑐𝑐𝑐𝑐𝑠𝑠𝑢𝑢𝑐𝑐 and the fitness for the new mutant is 𝐹𝐹𝑎𝑎𝑐𝑐𝑐𝑐𝑠𝑠𝑎𝑎𝑎𝑎𝑐𝑐. As the model assumes simple additivity of fitness effects, it does not take epistasis into consideration.
We calculated the probability of fixation (𝑃𝑃𝑓𝑓𝑖𝑖𝑓𝑓) for the mutational attempt using Kimura’s formula:
(Eq. 3)
Where s is the selection coefficient for the mutational attempt, and Ne is the effective
population size. We determine if the mutation was fixed by comparing 𝑃𝑃𝑓𝑓𝑖𝑖𝑓𝑓 to a random number generated between 0 and 1. If 𝑃𝑃𝑓𝑓𝑖𝑖𝑓𝑓 is larger than the random number, then the mutation is fixed. The fitness of 𝐹𝐹𝑐𝑐𝑢𝑢𝑐𝑐𝑐𝑐𝑠𝑠𝑢𝑢𝑐𝑐 is updated to the fitness of the new mutant. If 𝑃𝑃𝑓𝑓𝑖𝑖𝑓𝑓 is smaller than the random number, then the mutation is discarded, and the iteration moves to the next mutational attempt. Although Ne inherently accounts for the stochasticity of evolution, we
used the 𝑃𝑃𝑓𝑓𝑖𝑖𝑓𝑓 step to ensure that only strongly beneficial mutations are fixed in the population, thus maintaining the additive fitness characteristic of our model. A schema of the full algorithm is shown in Figure 7. The evolutionary process is repeated until convergence where
a total of 1000 mutational attempts have been performed. As there is only a pool of 4997 mutations available and the model assumes additivity of fitness effects, 1000 mutational attempts were deemed sufficient for the model to capture the dynamics of evolution.
The algorithm keeps track of several variables for each trajectory: the fitness values of each mutational attempt; all fixed mutations occurring in a pathway; and the selection coefficient of each fixed mutation. The evolutionary model was written in Python, and simulations were performed on an iMac, version 10.12.6 with 3.2 GHz Intel Core i5, and 16GB memory.
Figure 7. Algorithm for the deterministic evolutionary model.
With the available fitness landscape, we build the model of microbial evolution that replicates bacterial population dynamics to study the emergence of resistance. We calculate the selection coefficient and the probability of fixation as defined by Kimura, to determine which mutations are fixed in our simulations. Beneficial mutations will have a higher probability to fix than a deleterious mutation. We use the algorithm to simulate 106 evolutionary trajectories to study the emergence of resistance.
24
Analysis of the evolutionary trajectories
The population dynamics simulations generate 106 pathways, each with their set of fixed mutations. In our model, each step of an evolutionary trajectory/pathway is defined by the selection coefficient of its fixed mutations. Therefore, we calculated the overall mean and median trajectory of all the pathways in the simulations to determine if they recapitulate the evolutionary behavior. In case the mean and median did not recapitulate the evolutionary behavior, we clustered the trajectories to determine their different evolutionary behaviors. We determined an optimal sample size to perform cluster analysis. The sample size can be used to estimate the overall behavior of the pathways. The sample size (n) is defined as:
(Eq. 4)
Where z is the z-score for the confidence level, p is the sample proportion, and M is the margin error. To ensure that we capture the behavior of the pathways, we set the confidence interval at 95% with a z-score at 1.96; p at 0.5 to ensure the largest sample size calculation, and M at 0.01 for a margin of error of 1%. Using these parameters, we obtained a sample size of 9604 pathways. For the cluster analysis, we randomly sampled 10,000 pathways from the complete set. The sampled trajectories are grouped using the kml package (Genollini C. et al., 2015). The kml algorithm was set to generate a number of clusters to optimally represent the evolutionary pathways. We calculated the centroid and the standard deviation for each cluster. We performed the sampling and clustering five times, and the average centroid and standard deviation are used to assign all 106 evolutionary trajectories to their respective cluster. The analysis was performed with R 3.3.0 (R Core Team, 2013).
Comparison of fixed mutations from simulation with mutations enriched
from clinical isolates and experimental laboratory evolution
The mutations from clinical isolates and laboratory evolution under purifying selection are described in Table 1. The sets of enriched mutations under Amp selection in laboratory evolution are obtained from Bershtein et al. (2008), and the clinical isolates mutations under Amp selection were obtained from Hall (2002), Matagne et al. (1998), Salverda et al. (2010);
Brown et al. (2010); and Imtiaz et al. (1994). The mutations from the literature were compared against mutations observed in our simulations.
Clinical isolates Clinical isolates (cont.) Enriched mutations
A42G A184V N52D I47V T188I N52S M69L I208M E63A M69V E240K K111E G92S R241H K111R M96I R244S R120G E104K R244C E147G S130G R244T H153R R164C T265M M182T R164H S268G L201P R164S R275L I208L W165R R275Q I208V M182T N276D K288R A184V
Table I. Clinical isolates and enriched mutations for TEM-1 under Amp selection.
The mutations were sampled from the literature on TEM-1 resistance. Clinical isolates represent mutations that were observed in a clinical setting, while the enriched mutations correspond to mutations that were observed in laboratory evolution. The mutations are used to compare against our results from the simulations. The mutations are presented in alphabetical order.
Results
Evolution trajectories form clusters
We build a deterministic evolutionary model of additive fitness. The model generates distinct evolutionary trajectories. We observe that the majority of the trajectories reach resistance
26
we observe that the overall mean and median of the trajectories reach an optimum with diminishing returns in fitness, as shown in Figure 8A. Therefore, the average and median of the evolutionary trajectories do not reflect the complex evolutionary dynamics, as they do not account for different growth behaviors.
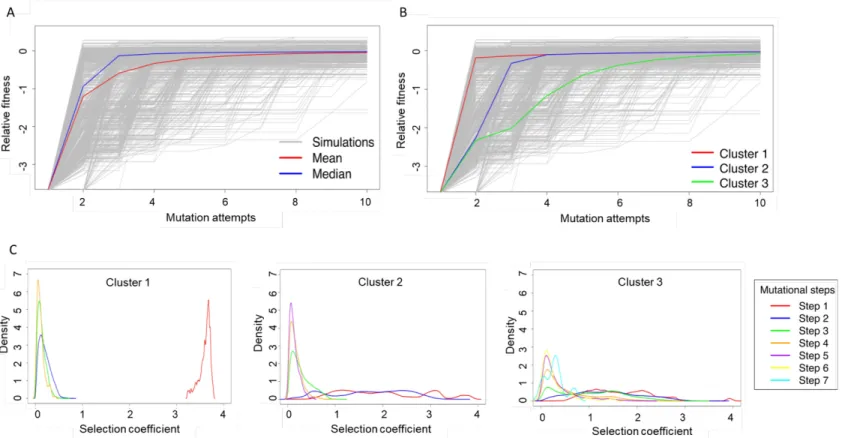
Instead, the evolutionary trajectories form distinct clusters. We use K-means clustering to group the pathways. We identify three cluster centroids from the evolutionary trajectories. The first cluster represents ~43% of the pathways and corresponds to “fast” adaptation whereby resistance was acquired using only one mutation (Figure 8B, red). The second cluster represents ~29% of the pathways and corresponds to “intermediate” adaptation whereby resistance was acquired in two mutations (Figure 8B, blue). The third cluster represents ~28% of the pathways and corresponds to “slow” adaptation whereby resistance was acquired in three or more mutations (Figure 8B, green).
Next, we investigate the selection coefficient of the mutation or their combination for the three clusters (Figure 8C). We define a mutational "step" as a fixed mutation. Trajectories in the fast adaptation cluster required only one step in average to reach resistance. The first step in the fast adaptation cluster (Cluster #1) is dominated by mutations with high selection coefficients that confer large fitness gains. Subsequent mutational steps confer minimal gains in fitness as the trajectories already reached a fitness plateau. For the intermediate adaptation cluster (Cluster #2), the first and second steps cover a broader and wider range of selection coefficients compared to Cluster #1. Thus, their density is lower compared to the fast adaptation cluster as they are not grouped around the same selection coefficients. The slow adaptation cluster is characterized by a high number of mutational steps that cover a broad range of selection coefficients.
Figure 8. Trajectories from the deterministic evolutionary model form three distinct clusters.
The population dynamics simulation was performed for 106 trajectories. Each trajectory could go through 1000 mutation attempts. Shown are the first 10 mutation attempts from each trajectory. The mean (A. red) and median (A. blue) of the evolutionary trajectories are not sufficient to recapitulate the adaptive behavior of the population dynamics simulations. The evolution trajectories behave in a clustering trend at high concentration of Amp (2500 μg/mL) and high population size (106). The most populated cluster (B. red) includes 43% of the trajectories in which 1 mutation attempt is sufficient to confer resistance during adaptation. 29% of trajectories (B. blue) require at least 2 mutation attempts, and 28% require (B. green) 3 attempts or more. The density of selection coefficients at each mutation attempts was graphed, with each color representing a different mutation step. C. Cluster 1, the fast growth is dominated by a large selection coefficient at the first mutation and lower selection
28
Comparison with clinical isolates and with laboratory evolution
As each evolution trajectory is defined by a sequence of fixed mutations, we seek to determine which mutations are selected more frequently. Beneficial mutations that confer resistance should occur at high frequency. Therefore, we determine the correlation between mutations at high occurrence in the fast adaptation cluster, and mutations observed in clinical isolates and laboratory evolution. We want to determine if comprehensive fitness landscapes combined with our model can capture the resistance mutations reported in the literature.
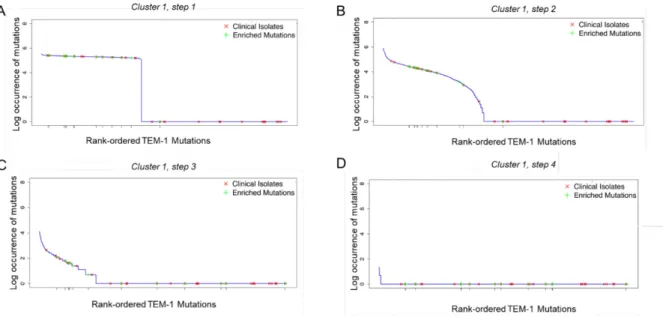
Figure 9. Clinical isolates and enriched mutations observed in the fast adaptation cluster.
The natural log occurrence of each mutation during the population dynamics simulations is graphed with the clinical isolates (red) and enriched mutations (green). We rank-ordered the TEM-1 mutations by their occurrence in the simulations. A. For cluster 1, at its first step, the enriched mutations are seen in high occurrence. B. For the second step, if resistance was not reached within the first step, the resistance mutation occurs at the second step. As adaptation progresses, the pool of available mutations that confer resistance diminishes as fitness is already at a maximum plateau. Ergo, step 3 (C), and 4 (D) show the low occurrence of clinical isolates and enriched mutations as they already occurred in step 1 and 2. We observe that mutants with a high occurrence count from the simulations are not necessarily conferring resistance. Currently, we cannot recapitulate mutations observed in clinical isolates.
For the first step, we observe that the occurrence rate per mutation is distributed into two segments: high occurrence and low or no occurrence, as shown in Figure 9A. The separation is due to the density of the selection coefficients. As only a few mutations can confer high fitness, the same mutations are selected at the first step of the simulations. We compare the high occurrence mutations against mutations reported from directed evolution and clinical isolates. The p-values reported from the two-sided Kolmogorov-Smirnov test (KS test) showed a significant relationship between high occurrence mutations at the first step and laboratory evolution mutations (p = 0,001) (Bershtein et al., 2008). We observed no relationship with clinical isolates (p = 0,4).
In the second step, fewer mutations are fixed at high occurrence, since the pool of available mutations is diminished (Figure 9B). The enriched mutations are still observed at a higher rate than the clinical isolates. There is a significant relationship between enriched mutations and high occurrence mutations (p=0,0003), and, to a lesser extent, between clinical isolates and high occurrence mutations (p=0,05). In the third step, we observe that enriched mutations and clinical isolates occur at a lower frequency, and are more disparate, as shown in Figure 9C. We did not observe any significant relationship between enriched mutations and high occurrence mutations (p = 0,2), and neither for clinical isolates (p = 0,5). For the last step in the fast adaptation cluster, only a few mutations are available mutations as the pool of potential mutations has run out. This is reflected in the low occurrence rate of mutations, as shown in Figure 9D. The enriched mutations and the clinical isolates are not reported in any of the mutations, and there is no relationship for either case (p = 1).
30
Table II. The p-values for enriched mutations and clinical isolates were calculated with a two-sided KS-test in the first cluster.
We use the test to determine whether the samples were drawn from the same distribution. We set the rank-ordered occurrence rate of mutations in the simulations as the reference probability distribution. The occurrence rates of enriched mutations observed from laboratory evolution (Bershtein et al., 2008), and clinical isolates (Salverda et al., 2010) are assigned as sample sets, and we determine if there is a correlation between the reference and sample datasets. The p-values returned in step 1 and step 2 are significant for the enriched mutations. From the table, it is possible to determine that the enriched mutations observed in high frequency at step 1, and 2 are not random. Mutations from clinical isolates from ampicillin and all other selection agents observed were not recapitulated in any of the high occurrence mutations, except for step 2 of ampicillin. From step 4, the mutations observed are due to random chance. The purifying selection simulations are more accurate to recapitulate the enriched mutations.
Discussion
In this chapter, we seek to determine the potential pathways for the emergence of resistance by relating the biochemical effects of mutation on target genes, population demography, and single drug dosage. Our model shows that there is possibly pervasive epistasis in clinical isolates and mutants from laboratory evolution as we cannot fully recapitulate them in our single-step simulations. If there was no epistasis involved in clinical isolates mutants from laboratory evolution, our model should be able to recapitulate all first mutations arising in resistance. Therefore, we hypothesize that this behavior is due to the dependency of each mutation to its genetic background. Thus, simple and additive models of fitness such as our deterministic model cannot fully capture the evolutionary pathways as they do not consider the underlying epistatic networks involved in evolution. Nonetheless, in the context of purifying selection, comprehensive fitness landscapes capture a large fraction of enriched mutations, but only for selection in short-term evolution (Gupta and Adami, 2016). To summarize, we
develop an evolutionary model based on additive fitness to determine the pathways to drug resistance. We construct a comprehensive fitness landscape of TEM-1 under Amp selection from published DMS. By starting the simulations with a protein variant with low fitness, we allow competition between all mutants and perform adaptive walks on the fitness landscapes to study purifying selection and resistance.
Evolutionary trajectories follow three distinct growth rates
We constructed 106 evolutionary trajectories under high Amp concentration (2500 μg/mL) and at large population size (Ne = 106). Each trajectory represents a specific sequence of fixed mutations to reach resistance. The average and median of all evolutionary pathways do not reflect the evolutionary dynamics and dispersion of the pathways as they do not account for different growth rates. Instead, the pathways form three distinct clusters with different behaviors: fast adaptation, intermediate adaptation, and slow adaptation. The three clusters highlight the uniqueness of each pathway during purifying selection. The clustering behavior should be expected as proteins sharing mutations with common biochemical traits are shown to evolve parallelly, and often with the repeated acquisition of the same mutations (Harms and Thornton, 2013).
The fast adaptation cluster is populated by pathways which require in average only one mutation attempt to reach resistance. These pathways select and fix “blockbuster mutations” that confer high fitness gains. Blockbuster mutations or first-step mutations (the early mutations occurring in an evolutionary trajectory) are key mutations in an evolutionary pathway. They have been shown to cause extensive changes in gene expression and significantly impact the landscape’s shape for subsequent mutations (Rodriguez-Verdugo et al., 2015). These pathways contain first steps which are dominated by mutations with large selection coefficients, with subsequent steps contributing minimal fitness gains. This behavior is not observed in the other two clusters. The intermediate adaptation cluster is characterized by a climb to resistance, requiring in average two mutational attempts as it lacks “blockbuster mutations” in the first step, but is present in the second step. In average, the initial two steps
32
behavior. None of the pathways contain a “blockbuster mutation” conferring significant fitness gains. Instead, they crawl slowly to resistance as their mutations do not have high selection coefficients. These simulations are accurate for evolution where genetic variation within a population is primarily supplied by mutations. Consequently, the model replicates mutation-driven evolution (Ueda et al., 2017).
Blockbuster mutations dictate the trajectories’ behavior
As our simulations begin from a TEM-1 variant with low fitness, any mutation fixed initially will be beneficial and increase the overall fitness of TEM-1. The model will always favor beneficial mutations over deleterious mutations. Thus, reaching resistance is much faster with our current model, as only a few mutational attempts are required in most pathways. The increase in fitness diminishes the pool of available mutations since mutations conferring a lower fitness will not fix in the current model. This behavior is explained by the dynamic mutation-selection balance concept: an excess of strongly beneficial mutations will push a population towards higher fitness, and simultaneously, the available pool of beneficial mutation is depleted by adaptation (Goyal et al., 2012). Therefore, after the “blockbuster mutation”, the number of available mutations that can increase the overall fitness of TEM-1 in Amp selection is much smaller. These initial mutations dictate the remaining available mutations for subsequent selection (Rodriguez-Verdugo et al., 2015; Harms and Thornton, 2013).
Clinical isolates are not recapitulated in the additive fitness model
We analyze the sequence of mutations of the fast adaptation cluster to study the effects of “blockbuster mutations” occurring in the first evolutionary steps. We compare the high occurrence mutations from the fast adaptation cluster to the resistance mutations observed in clinical isolates for Amp selection. We observe no statistically significant relationship between clinical isolates and high occurrence mutations. Due to pervasive epistasis, our evolutionary model cannot efficiently recapitulate the mutations observed in clinical isolates under Amp selection. The current evolutionary model and DMS do not account for the background on