INTRODUCTION
Phytoplankton growth under sea ice has been spo-radically documented over the last 50 yr in the Arctic (e.g. English 1961, Fukuchi et al. 1989, Michel et al. 1993, Strass & Nöthig 1996, Fortier et al. 2002, Arrigo
et al. 2012). However, it remains common practice to assume negligible water column production when the ocean is ice-covered, due to the strong light attenuation properties of snow, sea ice, and ice algae. Recently, Mundy et al. (2009) showed that significant primary production can take place under sea ice
dur-© Inter-Research 2014 · www.int-res.com *Corresponding author: [email protected]
Role of environmental factors on phytoplankton
bloom initiation under landfast sea ice in
Resolute Passage, Canada
C. J. Mundy
1, 2,*, Michel Gosselin
2, Yves Gratton
3, Kristina Brown
4,
Virginie Galindo
5, Karley Campbell
1, Maurice Levasseur
5, David Barber
1,
Tim Papakyriakou
1, Simon Bélanger
61Centre for Earth Observation Science (CEOS), University of Manitoba, Winnipeg, Manitoba R3T 2N2, Canada 2Institut des sciences de la mer (ISMER), Université du Québec à Rimouski, Rimouski, Québec G5L 3A1, Canada
3Institut National de la Recherche Scientifique — Eau, Terre et Environnement, Université du Québec, Québec,
Québec G1P 4S5, Canada
4Earth, Ocean and Atmospheric Sciences, University of British Columbia, Vancouver, British Columbia V6T 1Z4, Canada 5Département de biologie, Université Laval, Québec, Québec G1V 0A6, Canada
6Département de biologie, chimie et géographie, Université du Québec à Rimouski, Rimouski, Québec G5L 3A1, Canada
ABSTRACT: It has been common practice in scientific studies to assume negligible phytoplankton production when the ocean is ice-covered, due to the strong light attenuation properties of snow, sea ice, and ice algae. Recent observations of massive under-ice blooms in the Arctic challenge this concept and call for a re-evaluation of light conditions prevailing under ice during the melt period. Using hydrographic data collected under landfast ice cover in Resolute Passage, Nunavut, Canada between 9 May and 21 June 2010, we documented the exponential growth phase of a substantial under-ice phytoplankton bloom. Numerous factors appeared to influence bloom initi-ation: (1) transmitted light increased with the onset of snowmelt and termination of the ice algal bloom; (2) initial phytoplankton growth resulted in the accumulation of biomass below the devel-oping surface melt layer where nutrient concentrations were high and turbulent mixing was rela-tively low; and (3) melt pond formation rapidly increased light transmission, while spring-tidal energy helped form a surface mixed layer influenced by ice melt — both were believed to influ-ence the final rapid increase in phytoplankton growth. By the end of the study, nitrate+nitrite was depleted in the upper 10 m of the water column and the under-ice bloom had accumulated 508 mg chl a m−2with a new production estimate of 17.5 g C m−2over the upper 50 m of the water column.
The timing of bloom initiation with melt onset suggests a strong link to climate change where sea ice is both thinning and melting earlier, the implication being an earlier and more ubiquitous phytoplankton bloom in Arctic ice-covered regions.
KEY WORDS: Under-ice bloom · Phytoplankton · Arctic · Sea ice melt · Transmitted PAR Resale or republication not permitted without written consent of the publisher
F
REE
REE
ing the spring-summer transition, when sea ice melt rapidly increases light transmission and enhances surface stratification of the water column.
In fact, under-ice phytoplankton blooms can rival open water blooms as demonstrated in Arrigo et al. (2012). In the Canadian high Arctic, under-ice water column integrated chlorophyll a (chl a) concentra-tions have been documented to exceed 450 mg m−2
(Fortier et al. 2002). It was suggested that the central Canadian Arctic archipelago could represent a re -gion where under-ice phytoplankton blooms have been a regular, yet under-documented occurrence due to several important factors (Mundy et al. 2009). The shallow and narrow waterways of the archipel-ago act to mix nutrient-rich waters into the surface layer (Michel et al. 2006). The narrow waterways also result in extensive landfast sea ice formation that locks ice in place long into the melt period, permit-ting it to reach very advanced stages of ice melt prior to break-up. Furthermore, the waterways and land-fast ice limit intrusions of large, thick multiyear ice floes from the central Arctic ice pack, resulting in a predominant first-year ice (FYI) cover towards cen-tral and southern regions of the Archipelago (Melling 2002).
It is important to consider that FYI has become the dominant ice type in the Arctic at the expense of a rapidly disappearing multiyear ice cover (Comiso et al. 2008). Among other distinguishing factors, FYI is generally less thick with a thinner snow cover (due to timing of formation) and during the melt season, tends to have greater areal melt pond coverage (due to less topographic relief) in comparison to multiyear ice (Polashenski et al. 2012). Subsequently, consider-ably more light transmits through FYI than through multiyear ice (Nicolaus et al. 2012). With enhanced water-column light absorption associated with the ice-albedo feedback, a decrease in seasonal sea ice thermodynamic growth also is expected (Perovich et al. 2011). All of these factors play a significant role on the amount of light transmitted to the underlying water column. Furthermore, water temperatures under the sea ice in the western Arctic are usually close to freezing, which would reduce top-down influences on under-ice phytoplankton bloom devel-opment (Sherr et al. 2009). Therefore, Mundy et al. (2009) suggested that the importance of under-ice phytoplankton blooms in the Arctic marine ecosys-tem could increase with the thinning ice cover. If this suggestion proves true, under-ice phytoplankton blooms could represent a major, yet challenging to monitor, response of the ecosystem to climate change. As part of a time-series landfast ice study in
the central Canadian Arctic archipelago called the Arctic - Ice Covered Ecosystem (Arctic-ICE) study, we identified a set of environmental conditions that led to the development of an under-ice phytoplank-ton bloom. Our study took place from 9 May to 21 June 2010, with a focus on the timing of key envi-ronmental factors that initiated the bloom.
MATERIALS AND METHODS Data collection
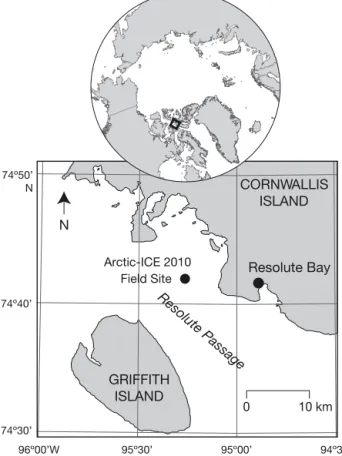
The Arctic-ICE 2010 main field study took place on landfast ice in Resolute Passage (74° 42.6’ N, 95° 15.0’ W; 141 m water depth), near Resolute Bay, Nunavut, Canada (Fig. 1). A meteorological station was installed within 500 m of our main site at which air temperature (3.9 m height; Vasailla HMP45C212 sensor), shortwave surface albedo (1.3 m height; Kipp & Zonen™ CNR1 sensor), and incident photo-synthetically available radiation (PAR; 1.3 m height; Kipp & Zonen™ PAR-Lite sensor) were monitored during the study. Two separate tethers, each with
74º50’ N 74º40’ 74º30’ 96º00’W 95º30’ 95º00’ 94º30’ 0 10 km Resolute Passage Resolute Bay CORNWALLIS ISLAND GRIFFITH ISLAND Arctic-ICE 2010 Field Site N
Fig. 1. Arctic-ICE 2010 study site located in Resolute Pas-sage, Nunavut, Canada, at 74° 42.6’ N and 95° 15.0’ W over a
scalar PAR sensors (ALEC MKV-L) mounted at 2, 5, 7.5, 10, and 20 m water depths, were moored to the ice under high (> 30 cm) and low (<12 cm) snow depth sites, respectively, to monitor transmitted PAR. The tethers were installed approximately 500 m from the main meteorological station through 4 cm diame-ter ice auger holes while air temperatures were still well below freezing. A range is presented in percent transmittance estimates in an effort to compare the underwater scalar versus incident cosine irradiance measurements. The range was derived by multiply-ing the under-ice scalar measurements by a down-welling irradiance average cosine of 0.5 (diffuse light field; minimum estimate) and 1.0 (downward direc -ted light field; maximum estimate). Furthermore, to simplify, we assumed negligible upward irradiance in the under-ice water column. To measure currents, a 614 kHz Acoustic Doppler Current Profiler (ADCP; RD Instruments Workhorse Sentinel 600) was moun -ted at the ice bottom looking downward following Marsden et al. (1994). Due to logistical problems, ADCP data only cover the periods of 10 to 23 May and 27 May to 9 June 2010. As tides are the main influence on local currents, we used current veloci-ties centered at a 3 m water depth predicted by har-monic analysis over the entire study period (Pawlow-icz et al. 2002). The harmonic analysis correlated well with the actual observations (r2= 0.50, n = 644), but
pro vided consistently lower velocities, and were therefore considered conservative estimates. Hydro-graphic profiles from 2 to 130 m using a SBE-19 plus CTD sensor (Seabird Electronics) equipped with an in vivo chl a fluorometer (Wet Labs ECO-FLRT) were collected at an approximate daily interval through a 1 × 1 m hole covered with a heated enclosure. Sensor casts started at 2 m to minimize the influence of the ice access hole on the profiles (e.g. pooling of melt water within the hole). A quadratic polynomial was used to calibrate fluorometer data against extracted chl a measurements (Parsons et al. 1984) from dis-crete water column samples (r2= 0.98, n = 83).
Fluo-rescence of the extracted pigments was measured before and after acidification with 5% HCl using a 10-005R Turner Designs fluorometer. Chl a concen-trations were then calculated using the equation described by Holm-Hansen et al. (1965).
Using 5 l Niskin bottles, water column samples were collected immediately following the morning’s CTD cast at 2, 5, 10, 25, 50, and 130 m every 3 to 4 d throughout the study. Nitrate+nitrite, silicic acid and phosphate concentrations were measured on water column samples using a Bran-Luebbe 3 autoanalyzer (adapted from Grasshoff et al. 1999). Particulate or
-ganic carbon (POC) and nitrogen (PON) were meas-ured on selected water subsamples filtered through precombusted (450°C) Whatman GF/F filters dried at 60°C for 24 h and analyzed using a Costech ECS 4010 CHN analyzer. Furthermore, selected subsamples were taken for cell identification and enumeration, preserved with acidic Lugol’s solution (Parsons et al. 1984) and stored in the dark at 4°C until analysis. Cells > 2 µm were identified to the lowest possible taxonomic rank using inverted microscopy according to Lund et al. (1958).
On the day after water column sampling, sea ice core samples (bottom 10 cm) were collected using a 9 cm core barrel (Kovacs Mark II). Ice cores were sampled at a distributed sampling site under 3 snow depths when present: low (<10 cm), medium (10– 20 cm) and high (> 20 cm) classes. The distributed sampling site was located < 500 m from the PAR tether site and <1000 m from the meteorological sta-tion. We attempted to monitor the snow classes as melt commenced, which resulted in a decrease in snow depths with the low class represented by melt ponds over the final 2 sampling days. For each class, 2 to 3 ice cores were pooled together in isothermal 7.5 l containers and diluted using 0.2 µm-filtered sea-water to minimize osmotic shock of the microbial community while melting (Garrison & Buck 1986). Samples were melted in the dark over a 12 to 24 h period. Subsamples from ice melt were taken for determination of chl a, POC, and cell identification and enumeration.
RESULTS Light transmission
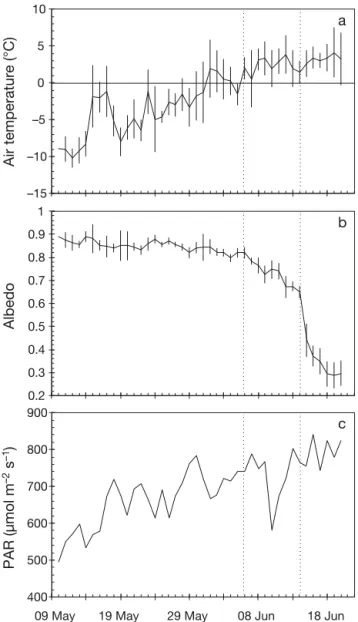
Prior to 6 June, air temperatures were predomi-nately less than 0°C, and surface albedo slowly decreased over the first half of the study from 0.9 to 0.8 (Fig. 2a,b). Following 6 June, air temperatures mostly remained above 0°C. Furthermore, between 6 and 14 June, surface albedo decreased from 0.8 to 0.7 as the snow cover melt rate increased, then pro-ceeded to exponentially decrease after 14 June as a melt pond formed under the radiation tower. Here-inafter, 6 and 14 June are described as snow melt and melt pond onsets, respectively. Daily averaged inci-dent PAR seasonally increased with slight variations associated with cloud cover (Fig. 2c). In particular, a system with thick cloud cover and light snow precipitation occurred over 10 and 11 June, causing a de -crease in incident PAR over this period. Daily
aver-aged transmitted PAR closely followed incident PAR with a slow increase prior to 6 June, particularly under the low snow cover (Fig. 3b,c). As snowmelt increased after 6 June, transmitted PAR rapidly increased, with 0.4 to 0.7% incident PAR reaching a 20 m depth by 14 June. After the formation of surface melt ponds, transmitted PAR at 2 m depth reached a maximum of 253 (16 to 32% incident PAR) and 152 µmol photons m−2s−1(10 to 20% incident PAR) by
the end of the study under the low and high snow depth sites, respectively. Using light attenuation measured between the 2, 5, 7.5, and 10 m sensors, we
extrapolated the percent of incident PAR transmitted to the ice bottom to be 21 to 42% and 11 to 22% for the low and high snow depth sites, respectively. These percent transmitted irradiances fit within the range of transmitted PAR to the ice bottom reported in Ehn et al. (2011) under similar surface cover. How-ever, water column attenuation increased during this period due to phytoplankton accumulation (see below), resulting in a decrease in transmitted PAR to depth. Interestingly, PAR under the high snow cover site was higher at 7.5 m than at shallower depths before 8 June. This apparent inversion in surface
Albedo Air temperature (°C) PAR (µmol m –2 s –1)
09 May 19 May 29 May 08 Jun 18 Jun
a b c –15 –10 –5 0 5 10 0.2 0.3 0.4 0.5 0.6 0.7 0.8 0.9 1 400 500 600 700 800 900
Fig. 2. Time series of daily averaged (a) air temperature, (b) surface shortwave albedo, and (c) incident downwelling photo synthetically available radiation (PAR) monitored at the automated meteorological station installed near the ice camp. Vertical bars are standard deviations of the daily averages and vertical dotted lines show snow melt and melt
pond onsets, respectively
1 10 100 –10 10 30 50 High snow Low snow 2 m 5 m 7.5 m 10 m 20 m 1 10 100
09 May 19 May 29 May 08 Jun 18 Jun
Snow and pond depths (cm)
Pond depth Snow depth PAR (µmol m –2 s –1 )
a
b
c
Fig. 3. Daily measured (average with standard deviation bars) (a) snow and melt pond depths at the high and low snow sites where transmitted photosynthetically available radiation (PAR) was monitored at specified depths along ice-moored tethers. Daily averaged transmitted PAR (plotted on a log scale) is presented for the (b) high and (c) low snow depth site tethers, respectively. Vertical dotted lines are
transmitted PAR attenuation was likely a function of horizontal light propagation under the variable snow and ice surface (Ehn et al. 2011).
Timing of primary producers
At the start of the study, ice algal chl a was highest (45 mg m−2) under the low snow class but decreased
to an average of 6 mg m−2between 30 May through
the end of the study (Fig. 4a,c). Under the medium snow class, ice algal chl a accumulated during the first portion of the study to 46 mg m−2, then rapidly
decreased after 31 May. Ice algal chl a under the high snow class followed a similar pattern to that of the
medium but remained relatively low throughout the study. These observations agree with previous stud-ies where ice algae under low snow covers are lost first from the sea ice during the spring-summer tran-sition, likely associated with ablation of the ice algal habitat (Mundy et al. 2005, Juhl & Krembs 2010) and possibly photoinhibition (Juhl & Krembs 2010). In contrast, ice algae under the medium and high snow classes were probably light limited and thermally insulated from the atmosphere (Mundy et al. 2005) to start, then as air temperature and transmitted light levels increased, a loss of algae from the ice oc -curred. By 2 June, ice algal chl a was consistently less than 20 mg m−2under all the snow classes. Interest-ingly, following 30 May, a minimal ice algal chl a (~6 mg m−2) remained as a visible film on the bottom
of the ice cores under the low snow class, even though the ice was rapidly ablating with the forma-tion of surface melt ponds. We surmise that the ice algae were actively growing, balancing a loss associ-ated with ice ablation during this period.
Discrete samples of chl a integrated over the upper 50 m of the water column showed a slow but steady exponential increase up to 14 mg m−2prior to 8 June
(Fig. 4c, solid line). During this early period, ice algae were consistently sloughing from the low and, later, medium and high snow cover sites. This sloughing can help explain the slight increase in water column chl a. An alternative explanation could be slow accu-mulation of light limited in situ phytoplankton pro-duction. For example, Lovejoy et al. (2007) observed a slow exponential increase in chl a and cell concen-trations in the under-ice water column before and during an ice algal bloom in the Beaufort Sea, which was suggested to be associated with in situ produc-tion by picoplankton. Between 8 and 11 June, we observed a rapid rise in water column integrated chl a, followed by a shallow increase that lasted until 14 June, then a rapid exponential increase to a maxi -mum of 508 mg m−2by the end of the study period.
This maximum closely matched that previously observed in Resolute Passage (Fortier et al. 2002). From a sample taken on 19 June, the under-ice phyto plankton community > 2 µm was found to be nu merically dominated by the centric diatoms Chae -to ceros spp. and Thalassiosira spp., which accounted for 68% and 7.5% of the total autotrophs, respec-tively. In contrast, a sample of the ice algae under the medium snow depth collected on 24 May (i.e. prior to the major sloughing event) revealed that 75% of the community were pennate diatoms, with 40% and 18% Nitzschia frigida and Navicula pelagica, res -pectively. Therefore, it was clear that the under-ice –10 10 30 50 Ice algae chl a (mg m –2) Water column chl a (mg m –2 ) Ice thickness (cm)
Snow and pond depths (cm)
Pond depth Snow depth 125 135 145 1 10 100 1000 0 20 40
09 May 19 May 29 May 08 Jun 18 Jun
High Medium Low a b c
Fig. 4. Average (with standard deviation bars where appro-priate) of (a) snow and melt pond depth, (b) ice thickness, and (c) bottom ice algae chlorophyll a (chl a) concentration measured at high, medium, and low snow depth class dis-tributed sampling sites (dashed lines). Included in (c) is a plot of water column chl a concentration integrated over the upper 50 m (right axis with log scale; solid line) from discrete water samples collected at 2, 5, 10, 25, and 50 m approxi-mately every third day. Vertical dotted lines are snow melt
phytoplankton bloom was distinct, and accumulated at least an order of magnitude more chl a than the ice algae while the local region was still ice-covered. It is also significant to note that the under-ice bloom fol-lowed ~1 wk after the majority of ice algae had sloughed from the ice bottom. From their relationship with chl a concentration presented in Ehn & Mundy (2013), bottom ice scalar attenuation coefficients were estimated to be 39.8 and 13.6 m−1 for the ob
-served maximum and minimum bottom ice chl a con-centrations of 46 and 5 mg m−2, respectively.
There-fore, applying Lambert-Beer’s law (Gordon 1989), the decrease in bottom ice chl a observed in our study corresponded to a 50% increase in transmitted irradiance. Thus, the loss of ice algae also contrib -uted significantly to the seasonal increase in under-ice transmitted irradiance.
Under-ice bloom dynamics
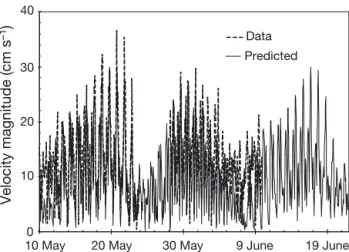
There was a periodicity in water column profiles of temperature and salinity from the hydrocast data (Fig. 5a,b). For example, the −1.6°C and 32.5 salinity isolines shoaled at a frequency that closely corre-sponded to timing of changes in current velocities (Fig. 6), which are driven predominately by the spring-neap tidal cycle in Resolute Passage (Marsden et al. 1994). On 14 June, salinity started to de -crease slightly at the 2 m water depth, coupled with an increase in stratification in the upper 2 to 3 m (Brunt-Väisälä frequency (N2) = 1.85 × 10⁻³s−2from
maximum values of ≤0.16 × 10⁻³s−2prior to 14 June;
data not shown). This decrease in salinity and increase in stratification was likely associated with the commencement of melt water collecting at the undersurface of the sea ice. Following 16 June, salin-ities rapidly decreased in the surface water column (Fig. 5b). This rapid decrease corresponded with peak current velocities associated with the spring tide, suggesting that tidal energy had acted to deepen the surface stratified layer by mixing the melt layer with the underlying water column. Following Mann & Lazier (1991), the squared current velocity showed that mixing forces were up to 18 times stronger during the maximum peak of predicted tidal currents on 16 June relative to the minimum of the daily maximum predicted current velocities reached on 6 June. By 21 June, a strong salinity gradient cre-ated a pycnocline that extended to a depth of 47 m (Fig. 7a).
From 8 to 11 June, a clearly defined increase in chl a occurred with peak concentrations around a
a) Temperature (°C) b) Salinity c) Chl a (mg m–3) 20 60 100 40 80 120
10 May 20 May 30 May 9 June 19 June
Depth (m) 20 60 100 40 80 120 20 60 100 40 80 120
Ocean Data View
Fig. 5. Interpolated time series of (a) water column tempera-ture (°C), (b) salinity, and (c) chlorophyll a concentration via
in vivo fluorescence (mg m−3). Data from 67 hydrocasts
(ver-tical dotted lines) were interpolated and plotted using Ocean DataView v. 3.3.1 (Schlitzer 2006)
10 May 20 May 30 May 9 June 19 June
40 30 20 10 0 Velocity magnitude (cm s –1) Data Predicted
Fig. 6. Absolute current velocities measured with a down-looking 614 kHz ADCP (2 m bin centered at a 3 m water
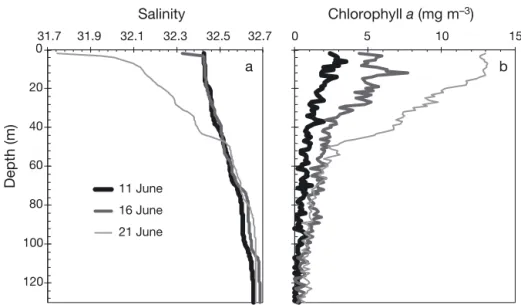
6 m water depth and a long decreasing tail reaching depths of more than 100 m (Figs. 5c & 7b). As the sur-face water column was not strongly stratified during this period, the under-ice phytoplankton were likely produced within the euphotic zone, then settled down in the water column. We note that the chl a peak at 6 m occurred below any ice melt water influ-ence. Ice melt water is expected to be nutrient deplete due to segregation and brine drainage pro-cesses during ice growth. Unfortunately, only 1 low salinity surface water sample (salinity of 6.9) was col-lected during our study. In accordance with a nutri-ent deplete ice melt assumption, silicic acid and phosphate concentrations fell below a dilution curve crossing through the origin, but nitrate+nitrite con-centrations fell well above (data not shown). Cota et al. (1990) noted that ice algae may store intracellular pools of nitrate, evidenced by elevated concentra-tions in the sea ice. These intracellular pools could be released as cells encounter osmotic stress during ice melt. Future work on this topic is warranted.
Water column chl a only slightly increased be -tween 11 and 14 June but then increased exponen-tially following 14 June to the end of the study period (Fig. 4c). This growth increase matched with the tim-ing of melt pond formation on the ice surface and deepening of the surface mixed layer that was influ-enced by low salinity ice melt.
Water column nutrient concentrations were di vi -ded by their salinity, averaged over the upper 10 m of the water column, then multiplied (standardized) to an averaged salinity of 32.4 to examine the temporal development of the bloom through nutrient draw-down (Fig. 8). Prior to 6 June, standardized nitrate+ nitrite, silicic acid, and phosphate concentrations
were relatively stable, averaging 7.2, 14.7, and 1.2 µmol l−1, respectively. These concentrations fall along the lower range previously reported for the region (Cota et al. 1990, Michel et al. 2006). Follow-ing 6 June, standardized nutrient concentrations were drawdown with molar uptake ratios for silicic acid:nitrate+nitrite of 1.7 (r2= 0.98, n = 5) and nitrate+
nitrite:phosphate of 10.3 (r2= 0.99, n = 5). Our silicic
acid:nitrate+nitrite uptake ratio was slightly less than that presented for the western Canadian Arctic (1.8 to 1.9) associated with a diatom dominated sub-surface chlorophyll maximum (Tremblay et al. 2008). Tremblay et al. (2008) suggested that a high optimal silicon requirement for the dominant diatoms and growth under low irradiance at the subsurface chlo -rophyll maximum best explained the higher uptake ratios observed in the western Canadian Arctic. Both explanations fit the under-ice bloom observed in our study. 0 20 40 60 80 100 120 31.7 31.9 32.1 32.3 32.5 32.7 11 June 16 June 21 June 0 5 10 15 a b Salinity Chlorophyll a (mg m–3) Depth (m)
Fig. 7. Water column profiles of (a) salinity and (b) chlorophyll a (via in
vivo fluorescence) on 11, 16, and
21 June
0.1 1 10
09 May 19 May 29 May 08 Jun 18 Jun
Nitrate+nitrite Silicic acid Phosphate Concentration (µmol l –1 )
Fig. 8. Time series of nitrate+nitrite, silicic acid, and phos-phate concentrations averaged over the upper 10 m water
Prior to 6 June, nitrate+nitrite was well correlated with salinity ([nitrate+nitrite] = 8.60 × salinity − 272; r2= 0.84, n = 63), similar to that observed by Cota et
al. (1990) for the same region. By the end of the study period, nitrate+nitrite was depleted over the upper 10 m to less than 0.2 µmol l−1, whereas silicic acid and
phosphate averaged 2.8 and 0.6 µmol l−1, respec-tively. Using a conservative assumption that ice melt had an end point of 0 salinity and 0 nitrate+nitrite concentration, we constructed a dilution curve up to the lower data bounds of the abovementioned rela-tionship. N-uptake was then calculated as the differ-ence between the dilution curve and regression line with observations made on 21 June. N-uptake was integrated over the upper 50 m of the water column, then, following Smith et al. (1991), converted to a new production estimate using a measured POC: PON molar ratio of 6.7. The resultant estimate was 17.5 g C m−2for the bloom period 6 to 21 June, which
corresponded to a daily average rate of 1.1 g C m−2
d−1. This daily average rate was close to the rate
esti-mated during an ice-edge upwelling bloom in the Canadian Beaufort Sea (Mundy et al. 2009). Further-more, a specific accumulation rate of 0.24 d−1 was
obtained by fitting an exponential curve to the time series of integrated (50 m) chl a data between 5 and 21 June (r2= 0.95, n = 6). From this, a net particulate accumulation rate of 1.9 g C m−2d−1was estimated by
multiplying the specific rate by the average chl a over the period and converted to POC using a meas-ured POC:chl a ratio of 50 (g:g).
A current analysis on the 2 m resolution (3 to 27 m) ADCP data was undertaken to examine the potential influence of advected biomass into the region from adjacent open waters. Averaged currents over the entire dataset moved in a northwest direction (along Resolute Passage) and increased approximately lin-early from <1 cm s−1 at 3 m to 2.1 cm s−1at 27 m.
These currents were comparable to those presented in Marsden et al. (1994), but in an opposite direction. We note that the lower current velocities are difficult to separate from instrument noise where a minimum random error of the order 1 cm s−1 (we averaged
60 one-minute ensembles) was associated with the ADCP. As our sampling station was approximately 25 km from the ice-edge in Barrow Strait, the above mean currents imply that water from the adjacent ice-free region would have transited for 29 d at 3 m, and 14 d at 27 m before reaching our station. Sinking rates of diatom cells and chains have been found to range around 1 m d−1(ca. 0.6 to 1.2 m d−1) during
ini-tial bloom phases (Riebesell 1989). At this sinking rate, a phytoplankton bloom would be vertically
off-set by 14 to 29 m by the time cells were advected under our station. As the under-ice phytoplankton bloom first accumulated at 6 m and peak water col-umn biomass was consistently observed above 12 m (Fig. 7b), we suggest that the majority of the biomass observed in our study was produced under the ice cover. Ocean color data from the Medium Resolution Imaging Spectrometer (MERIS) sensor at full resolu-tion (330 m) were obtained (see the Sup plement at
www.int-res.com/articles/suppl/m497p039_supp. pdf)
from the Ocean Biology & Bio geochemistry Program (http://oceancolor.gsfc.nasa.gov/). Satellite-derived chl a concentration along the ice-edge re mained low (< 0.5 mg m−3) in the vicinity of the study site until the end of June. Although satellite-derived chl a concen-tration in presence of sea ice could be underesti-mated (Bélanger et al. 2007), these results suggest that the phytoplankton did not develop in the nearby open water during our study. By the end of June, however, high chl a concentrations (> 2 mg m−3and
up to 10 mg m−3) appeared within Barrow Strait.
These satellite data showed that the bloom in open water occurred at the same time or later as the under-ice bloom observed at our study site and, therefore, provided further evidence that our observations were of in situ under-ice production given the transit dis-tance presented earlier.
DISCUSSION
Timing and initiation of the under-ice phytoplank-ton bloom in our case study can be divided into a series of stages and events:
Firstly, the majority of ice algae had sloughed from the sea ice at least 1 wk prior to the commencement of the under-ice phytoplankton bloom. This slough-ing demarcated the end of the ice algal bloom, and was important as high algal biomass in the bottom ice can attenuate similar levels of light as a deep (> 20 cm) snow cover (Mundy et al. 2007). Although the early integrated chl a increase in the water col-umn may have been associated with the sloughing ice algae, these algae apparently did not directly seed the under-ice phytoplankton bloom, as the dom-inant diatom composition of the 2 communities were distinct.
Secondly, snow melt onset rapidly decreased sur-face albedo, resulting in an exponential increase in transmitted irradiance that deepened the euphotic zone to at least 20 m prior to the formation of surface melt ponds. It was during this stage that the phyto-plankton bloom started to develop. Interestingly,
ac-cumulation of surface chl a occurred before any sig-nificant surface mixed layer developed in the water column. Recently, Taylor & Ferrari (2011) showed through modeling and satellite observations that phytoplankton blooms in the North Atlantic could be initiated as a response to weakened turbulent con-vection associated with a decrease in the air-sea heat flux during the winter to spring transition. This weak-ened turbulent mixing was proposed as an alternative condition to the critical depth hypothesis that is appli-cable only for consistent mixing regimes (Sverdrup 1953). With respect to our dataset, both brine re -jection during ice formation and tidal currents can in-crease turbulent mixing of the upper water column. The under-ice bloom in our study was initiated after melt onset (little to no brine rejection) and during neap-tide, and therefore during a period of weakened turbulent mixing. Due to the reduced shear, we spec-ulate that the under-ice phytoplankton were able to grow near the surface, shade-acclimated to the low but ample light conditions. However, due to a lack of surface stratification (N2≤ 0.16 × 10⁻³s−2), this initial
phytoplankton growth appeared to be associated with rapid sinking of cells, inferred from the long de-creasing tail of chl a down to depths >100 m. Similar observations have been made for under-ice phyto-plankton blooms in this region (Apollonio & Matrai 2011). A slight leveling in the chl a accumulation rate at the end of this stage coincided with a light snow precipitation event that occurred over 10 to 11 June, which caused incident and transmitted PAR to de-crease slightly, decreasing the euphotic zone depth. Furthermore, increasing tidal currents toward the end of this period could have enhanced turbulent mixing, thus decreasing residence time of phyto-plankton in the euphotic zone.
Thirdly, phytoplankton production accelerated fol-lowing the formation of surface melt ponds. Melt pond formation further increased transmitted irradi-ance, but as phytoplankton biomass increased in the upper layers, water column light attenuation rapidly in creased. The provision of ice melt water and tidal mixing with seawater during this period resulted in a strongly stratified surface mixed layer that also likely influenced the increased phytoplankton accumula-tion rate after 14 June.
The data presented in this paper clearly show the development of a phytoplankton bloom below land-fast sea ice cover in Resolute Passage at the center of the Canadian Arctic archipelago. During our study, phytoplankton had accumulated an order of magni-tude more chl a in the water column than was observed in the ice cover during the ice algal bloom.
This finding, combined with previous observations of significant under-ice phytoplankton accumulation in the same vicinity (Fortier et al. 2002), supports the earlier hypothesis (Mundy et al. 2009) that under-ice phytoplankton blooms are likely a regular, but largely neglected occurrence in the Canadian Arctic archipelago, and perhaps across the Arctic. In partic-ular, the accumulation of phytoplankton biomass below the ice cover in the Chukchi Sea reported in Arrigo et al. (2012) demonstrated the potential wide-spread importance of these blooms. Their occurrence may also shed new light on ice-edge blooms (e.g. Sakshaug & Skjoldal 1989, Mundy et al. 2009, Per-rette et al. 2011). In particular, accumulated under-ice phytoplankton biomass could act to seed under-ice-edge blooms as the edge recedes in summer (Strass & Nöthig 1996) and perhaps during upwelling events. From a historical dataset collected during 1956 and 1961 to 1963, Apollonio & Matrai (2011) concluded that phytoplankton in the Canadian Arctic rapidly developed under intact melting sea ice, but about 2 to 3 wk later than observed in our study. Indeed, Michel et al. (2006) reported the region’s phyto-plankton bloom to peak late July-early August in a 10 yr dataset spanning 1983 to 1993. Although the maximum integrated chl a in our study closely matched the maximum observed from the 10 yr data-set compiled by Michel et al. (2006), it reached this value at least 1 mo prior, leading to the conclusion that our data lie on the early side of reported phyto-plankton blooms for the region. This difference in timing is consistent with recent work on the timing of landfast ice breakup and formation that shows breakup in the archipelago has advanced by about the same period (Galley et al. 2012).
Derived from the passive microwave satellite data record spanning 1979 to 2005, Stroeve et al. (2006) showed that in response to a warming climate, ice melt onset in the Western Arctic has been occurring earlier at a significant rate of 4 to 5 d decade−1. The relationship between the start of the under-ice phyto-plankton bloom and snowmelt onset links timing of local phytoplankton production to regional warming. Our observations on the early occurrence of maxi-mum phytoplankton production could be indicative of a major shift in the timing of local phytoplankton production in the central Canadian Arctic. This point could be critical as timing may be the single most important element affecting the ice-covered ecosys-tem through its influence on the transfer of organic carbon to the ice, pelagic, or benthic food webs (Leu et al. 2011). Furthermore, a currently thinning ice cover could lead to a more ubiquitous occurrence of
under-ice blooms across the entire Arctic. However, we note that these blooms are impossible to view from the surface and particularly via satellite obser-vations. Therefore, we need to look towards under-ice measurements that are currently lacking with respect to phytoplankton. Beyond dedicated field studies, the addition of biologically relevant sensors (e.g. transmitted light sensors and in vivo chl a fluo-rometers) to Arctic buoys, moorings, and automated underwater vehicles deployed under the sea ice could greatly assist in meeting the requirement for future under-ice observations.
Acknowledgements. Postdoctoral fellowship support was
provided from the Fonds québécois de la recherche sur la nature et les technologies to C.J.M. Field support for the project was provided by the Polar Continental Shelf Pro-gram of Natural Resources Canada and through Individual and Northern Research Supplement Discovery grants from the Natural Sciences and Engineering Research Council of Canada to C.J.M., M.G., Y.G., M.L., D.G.B., and T.N.P. Additional support was provided by Fisheries and Oceans Canada (DFO) and the Canadian International Polar Year federal program. Special thanks are extended to J. Ferland, C. Brouard, K. Swystun, P. Rioux, G. Desmeules, and P. Guil-lot for logistical and data processing assistance, to L. Miller for helpful suggestions on an earlier version of the paper, and to the 4 anonymous reviews that greatly improved the paper. This is a contribution to the research programs of the Canada Excellence Research Chair unit at the University of Manitoba, ArcticNet, CEOS, ISMER, Québec-Océan, and DFO. We dedicate this paper to the memory of Martin ‘Marty’ Bergmann; his help and advice were precious dur-ing the implementation of the Arctic-ICE project.
LITERATURE CITED
Apollonio S, Matrai P (2011) Marine primary production in the Canadian Arctic, 1956, 1961−1963. Polar Biol 34: 767−774
Arrigo KR, Perovich DK, Pickart RS, Brown ZW and others (2012) Massive phytoplankton blooms under Arctic sea ice. Science 336: 1408
Bélanger S, Ehn J, Babin M (2007) Impact of sea ice on the retrieval of water-leaving reflectance, chlorophyll a con-centration and inherent optical properties from satellite ocean color data. Remote Sens Environ 111: 51−68 Comiso JC, Parkinson CL, Gersten R, Stock L (2008)
Accel-erated decline in the Arctic sea ice cover. Geophys Res Lett 35: L01703, doi: 10.1029/2007GL031972
Cota GF, Anning JL, Harris LR, Harrison WG, Smith REH (1990) Impact of ice algae on inorganic nutrients in sea-water and sea ice in Barrow Strait, NWT, Canada, during spring. Can J Fish Aquat Sci 47: 1402−1415
Ehn JK, Mundy CJ (2013) Assessment of light absorption within highly scattering bottom sea ice from under-ice
light measurements: implications for Arctic ice algae
primary production. Limnol Oceanogr 58: 893−902 Ehn JK, Mundy CJ, Barber DG, Hop H, Rossnagel A,
Stew-art J (2011) Impact of horizontal spreading on light prop-agation in melt pond covered seasonal sea ice in the
Canadian Arctic. J Geophys Res 116: C00G02, doi: 10.
1029/2010JC006908
English TS (1961) Some biological observations in the cen-tral North Polar Sea Drift Station Alpha, 1957−1958. Arc-tic Institute of North America, Research Paper 13:1–80 Fortier M, Fortier L, Michel C, Legendre L (2002) Climatic
and biological forcing of the vertical flux of biogenic par-ticles under seasonal Arctic sea ice. Mar Ecol Prog Ser 225: 1−16
Fukuchi M, Watanabe K, Tanimura A, Hoshiai T, Sasaki H, Satoh H, Yamaguchi Y (1989) A phytoplankton bloom under sea ice recorded with a moored system in Lagoon Saroma Ko, Hokkaido, Japan. Proc NIPR Symp Polar Biol 2: 9−15
Galley RJ, Else BGT, Howell SEL, Lukovich JV, Barber DG (2012) Landfast sea ice conditions in the Canadian Arc-tic: 1983−2009. Arctic 65: 133−144
Garrison DL, Buck KR (1986) Organism losses during ice melting: a serious bias in sea ice community studies. Polar Biol 6: 237−239
Gordon HR (1989) Can the Lambert-Beer law be applied to the diffuse attenuation coefficient of ocean water? Lim-nol Oceanogr 34: 1389−1409
Grasshoff K, Kremling K, Ehrhardt M (1999) Methods of sea-water analysis, 3rd edn. Wiley-VCH, New York, NY Holm-Hansen O, Lorenzen CJ, Holmes RW, Strickland JD
(1965) Fluorometric determination of chlorophyll. J Cons Int Explor Mer 30: 3−15
Juhl AR, Krembs C (2010) Effects of snow removal and algal photoacclimation on growth and export of ice algae. Polar Biol 33: 1057−1065
Leu E, Søreide JE, Hessen DO, Falk-Petersen S, Berge J (2011) Consequences of changing sea-ice cover for pri-mary and secondary producers in the European Arctic shelf seas: timing, quantity, and quality. Prog Oceanogr 90: 18−32
Lovejoy C, Vincent WF, Bonilla S, Roy S and others (2007) Distribution, phylogeny, and growth of cold-adapted picoprasinophytes in Arctic seas. J Phycol 43: 78−89 Lund JWG, Kipling C, Le Cren ED (1958) The inverted
microscope method of estimating algal number and the statistical basis of estimations by counting. Hydrobiolo-gia 11: 143−170
Mann KH, Lazier JRN (1991) Dynamics of marine ecosys-tems. Blackwell Scientific Publications, Oxford
Marsden RF, Paquet R, Ingram RG (1994) Currents under land-fast ice in the Canadian Arctic Archipelago Part 1: Vertical velocities. J Mar Res 52: 1017−1036
Melling H (2002) Sea ice of the northern Canadian Arctic
Archipelago. J Geophys Res 107: 3181, doi: 10.1029/
2001 JC001102
Michel C, Legendre L, Therriault JC, Demers S, Vandevelde T (1993) Springtime coupling between ice algal and phytoplankton assemblages in southeastern Hudson Bay, Canadian Arctic. Polar Biol 13: 441−449
Michel C, Ingram RG, Harris LR (2006) Variability in oceanographic and ecological processes in the Canadian Arctic Archipelago. Prog Oceanogr 71: 379−401
Mundy CJ, Gosselin M, Ehn J, Gratton Y and others (2009) Contribution of under-ice primary production to an ice-edge upwelling phytoplankton bloom in the Canadian Beaufort Sea. Geophys Res Lett 36: L17601, doi: 10.1029/ 2009GL038837
Mundy CJ, Barber DG, Michel C (2005) Variability of snow and ice thermal, physical and optical properties
perti-➤
➤
➤
➤
➤
➤
➤
➤
➤
➤
➤
➤
➤
➤
➤
➤
➤
➤
➤
➤
nent to sea ice algae biomass during spring. J Mar Syst 58: 107−120
Mundy CJ, Ehn JK, Barber DG, Michel C (2007) Influence of snow cover and algae on the spectral dependence of transmitted irradiance through Arctic landfast
first-year sea ice. J Geophys Res 112: C03007, doi: 10.1029/
2006 JC003683
Nicolaus M, Katlein C, Maslanik J, Hendricks S (2012) Changes in Arctic sea ice result in increasing light trans-mittance and absorption. Geophys Res Lett 39: L24501, doi: 10.1029/2012GL053738
Parsons TR, Maita Y, Lali CM (1984) A manual of chemical and biological methods for seawater analysis. Pergamon Press, Toronto
Pawlowicz R, Beardsley B, Lentz S (2002) Classical tidal har-monic analysis including error estimates in MATLAB using T_TIDE. Comput Geosci 28: 929−937
Perovich DK, Jones KF, Light B, Eicken H, Markus T, Stroeve J, Lindsay R (2011) Solar partitioning in a chang-ing Arctic sea-ice cover. Ann Glaciol 52: 192−196 Perrette M, Yool A, Quartly GD, Popova EE (2011)
Near-ubiquity of ice-edge blooms in the Arctic. Biogeosciences 8: 515−524
Polashenski C, Perovich DK, Courville Z (2012) The mecha-nisms of sea ice melt pond formation and evolution. J Geophys Res 117: C01001, doi: 10.1029/2011JC007231 Riebesell U (1989) Comparison of sinking and sedimentation rate measurements in a diatom winter/spring bloom. Mar
Ecol Prog Ser 54: 109−119
Sakshaug E, Skjoldal HR (1989) Life at the ice edge. Ambio 18: 60−67
Schlitzer R (2006) Ocean data view. Alfred Wegener Insti-tute for Polar and Marine Research, Bremerhaven. Avail-able at http: //odv.awi.de
Sherr EB, Sherr BF, Hartz AJ (2009) Microzooplankton graz-ing impact in the western Arctic Ocean. Deep-Sea Res II 56: 1264−1273
Smith WO, Codispoti LA, Nelson DM, Manley T, Buskey EJ, Niebauer HJ, Cota GF (1991) Importance of Phaeocystis blooms in the high-latitude ocean carbon cycle. Nature 352: 514–516
Strass VH, Nöthig EM (1996) Seasonal shifts in ice edge phytoplankton blooms in the Barents Sea related to the water column stability. Polar Biol 16: 409−422
Stroeve J, Markus T, Meier WN, Miller J (2006) Recent chan -ges in the Arctic melt season. Ann Glaciol 44: 367−374 Sverdrup H (1953) On conditions for the vernal blooming of
phytoplankton. J Cons Int Explor Mer 18: 287−295 Taylor JR, Ferrari R (2011) Shutdown of turbulent
convec-tion as a new criterion for the onset of spring phytoplank-ton blooms. Limnol Oceanogr 56: 2293−2307
Tremblay JÉ, Simpson K, Martin J, Miller L, Gratton Y, Bar-ber D, Price NM (2008) Vertical stability and the annual dynamics of nutrients and chlorophyll fluorescence in the coastal, southeast Beaufort Sea. J Geophys Res 113: C07S90, doi: 10.1029/2007JC004547
Editorial responsibility: Graham Savidge, Portaferry, UK
Submitted: March 25, 2013; Accepted: October 4, 2013 Proofs received from author(s): January 6, 2014